


XRP price is correcting gains from the $0.585 resistance against the US Dollar. The bulls are active near $0.550 and might soon initiate a new rally.
- XRP started a strong increase above the $0.55 resistance.
- The price is now trading above $0.525 and the 100 simple moving average (4 hours).
- There is a key bullish trend line forming with support near $0.5520 on the 4-hour chart of the XRP/USD pair (data source from Kraken).
- The pair might correct further lower, but the bulls could remain active near $0.5320.
XRP Price Holds Ground
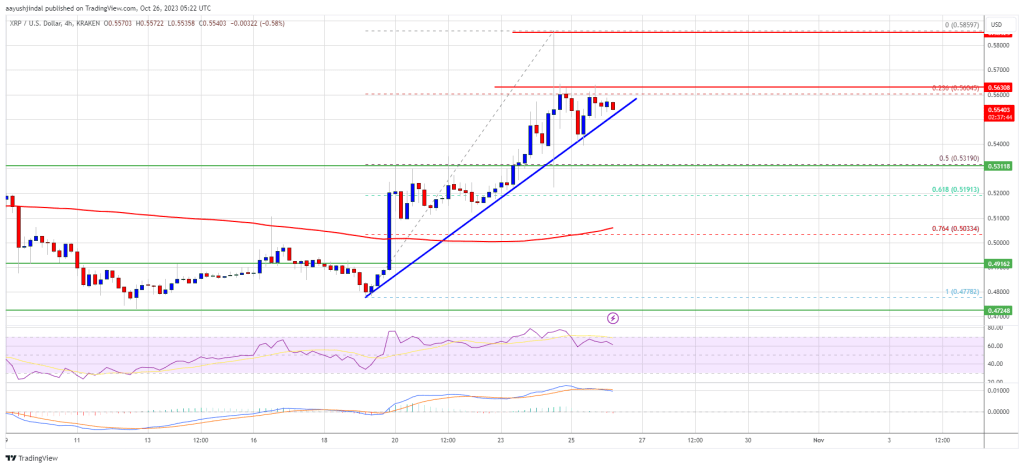
After forming a base above the $0.478 level, XRP started a fresh increase. The recent pump in Bitcoin and Ethereum also dragged XRP higher. The price gained pace after it broke the $0.525 resistance.
There was a move above the $0.550 and $0.565 resistance levels. Finally, it traded to a new multi-week high at $0.5859. Recently, there was a downside correction below the $0.575 level. The price declined below the 23.6% Fib retracement level of the upward move from the $0.4778 swing low to the $0.5859 high.
The price is now trading above $0.525 and the 100 simple moving average (4 hours). There is also a key bullish trend line forming with support near $0.5520 on the 4-hour chart of the XRP/USD pair.
Source: XRPUSD on TradingView.com
On the upside, immediate resistance is near the $0.563 level. A close above the $0.563 level could send the price toward the $0.585 resistance. If the bulls remain in action above the $0.585 resistance level, there could be a drift toward the $0.620 resistance. Any more gains might send XRP toward the $0.645 resistance.
Are Dips Limited?
If XRP fails to clear the $0.563 resistance zone, it could continue to move down. Initial support on the downside is near the $0.5520 zone and the trend line.
The next major support is at $0.532 or the 50% Fib retracement level of the upward move from the $0.4778 swing low to the $0.5859 high. If there is a downside break and a close below the $0.532 level, The price might accelerate lower. In the stated case, the price could retest the $0.505 support zone.
Technical Indicators
4-Hours MACD – The MACD for XRP/USD is now losing pace in the bullish zone.
4-Hours RSI (Relative Strength Index) – The RSI for XRP/USD is now above the 50 level.
Major Support Levels – $0.552, $0.532, and $0.505.
Major Resistance Levels – $0.563, $0.585, and $0.620.
XRP price is correcting gains from the $0.585 resistance against the US Dollar. The bulls are active near $0.550 and might soon initiate a new rally.
- XRP started a strong increase above the $0.55 resistance.
- The price is now trading above $0.525 and the 100 simple moving average (4 hours).
- There is a key bullish trend line forming with support near $0.5520 on the 4-hour chart of the XRP/USD pair (data source from Kraken).
- The pair might correct further lower, but the bulls could remain active near $0.5320.
XRP Price Holds Ground
After forming a base above the $0.478 level, XRP started a fresh increase. The recent pump in Bitcoin and Ethereum also dragged XRP higher. The price gained pace after it broke the $0.525 resistance.
There was a move above the $0.550 and $0.565 resistance levels. Finally, it traded to a new multi-week high at $0.5859. Recently, there was a downside correction below the $0.575 level. The price declined below the 23.6% Fib retracement level of the upward move from the $0.4778 swing low to the $0.5859 high.
The price is now trading above $0.525 and the 100 simple moving average (4 hours). There is also a key bullish trend line forming with support near $0.5520 on the 4-hour chart of the XRP/USD pair.
Source: XRPUSD on TradingView.com
On the upside, immediate resistance is near the $0.563 level. A close above the $0.563 level could send the price toward the $0.585 resistance. If the bulls remain in action above the $0.585 resistance level, there could be a drift toward the $0.620 resistance. Any more gains might send XRP toward the $0.645 resistance.
Are Dips Limited?
If XRP fails to clear the $0.563 resistance zone, it could continue to move down. Initial support on the downside is near the $0.5520 zone and the trend line.
The next major support is at $0.532 or the 50% Fib retracement level of the upward move from the $0.4778 swing low to the $0.5859 high. If there is a downside break and a close below the $0.532 level, The price might accelerate lower. In the stated case, the price could retest the $0.505 support zone.
Technical Indicators
4-Hours MACD – The MACD for XRP/USD is now losing pace in the bullish zone.
4-Hours RSI (Relative Strength Index) – The RSI for XRP/USD is now above the 50 level.
Major Support Levels – $0.552, $0.532, and $0.505.
Major Resistance Levels – $0.563, $0.585, and $0.620.


clomid without insurance order clomiphene pill can you buy generic clomid without a prescription cost of generic clomid without a prescription order clomiphene online where to buy clomid where to buy cheap clomid
This is a topic which is near to my callousness… Diverse thanks! Unerringly where can I find the phone details in the course of questions?
This website absolutely has all of the low-down and facts I needed there this case and didn’t positive who to ask.
generic azithromycin 250mg – order sumycin 500mg order flagyl
rybelsus cost – rybelsus online order cyproheptadine order
domperidone order online – buy tetracycline 250mg generic order flexeril 15mg generic
amoxiclav price – atbioinfo ampicillin drug
order esomeprazole generic – https://anexamate.com/ buy esomeprazole pills for sale
warfarin order – https://coumamide.com/ cozaar 50mg usa
buy mobic 15mg pills – https://moboxsin.com/ meloxicam generic
buy deltasone 5mg generic – allergic reactions deltasone 5mg brand
buy ed medications – https://fastedtotake.com/ cheapest ed pills
fluconazole 100mg drug – generic diflucan where to buy forcan without a prescription
cenforce 50mg sale – cenforce 100mg price cenforce 50mg for sale
cialis 5mg price comparison – https://ciltadgn.com/ cialis 2.5 mg
what is the difference between cialis and tadalafil – https://strongtadafl.com/# what is the active ingredient in cialis
viagra 50mg price walmart – legal order viagra over internet best price on viagra 100mg
More posts like this would add up to the online play more useful. kamagra comprar espaГ±a
More posts like this would bring about the blogosphere more useful. https://buyfastonl.com/isotretinoin.html
This is the compassionate of writing I positively appreciate. https://ursxdol.com/prednisone-5mg-tablets/
With thanks. Loads of conception! https://prohnrg.com/product/orlistat-pills-di/
The thoroughness in this section is noteworthy. https://aranitidine.com/fr/viagra-100mg-prix/