


XRP price failed to recover above the $0.5050 resistance zone. The price is now moving lower and might gain bearish momentum below the $0.480 support.
- XRP is gaining bearish momentum below the $0.500 support.
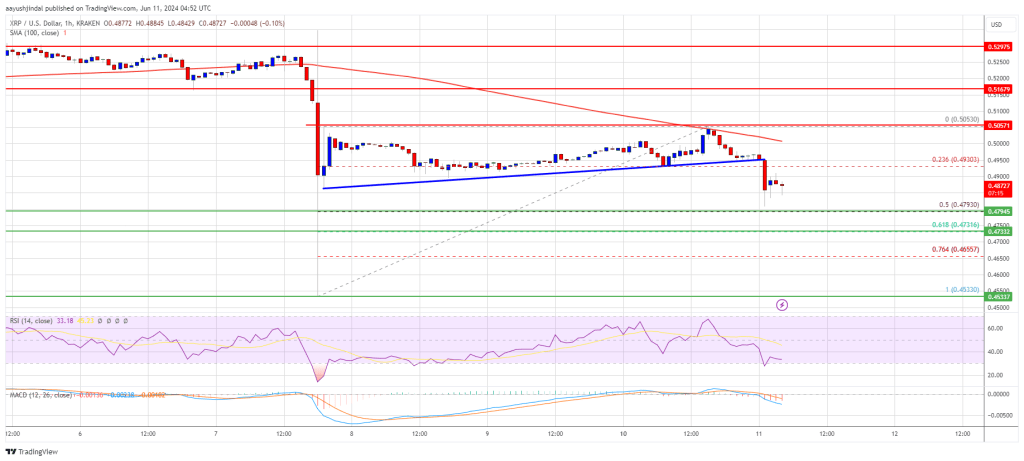
- The price is now trading below $0.500 and the 100-hourly Simple Moving Average.
- There was a break below a connecting bullish trend line with support at $0.4950 on the hourly chart of the XRP/USD pair (data source from Kraken).
- The pair could decline heavily if it breaks the $0.480 support zone.
XRP Price Breaks Support
XRP price attempted a recovery wave above $0.4920 like Ethereum and Bitcoin. The price climbed above the $0.500 resistance zone, but the bears were active near $0.5050.
A high was formed at $0.5053 and the price is again moving lower. There was a move below the $0.4980 and $0.4950 support levels. The price traded below the 23.6% Fib retracement level of the recovery wave from the $0.4533 swing low to the $0.5053 high.
Besides, there was a break below a connecting bullish trend line with support at $0.4950 on the hourly chart of the XRP/USD pair. The pair is now trading just above the 50% Fib retracement level of the recovery wave from the $0.4533 swing low to the $0.5053 high.
However, it is still trading below $0.50 and the 100-hourly Simple Moving Average. On the upside, the price is facing resistance near the $0.4920 level. The first key resistance is near $0.4950. The next major resistance is near the $0.500 level.

A close above the $0.500 resistance zone could send the price higher. The next key resistance is near $0.5050. If there is a close above the $0.5050 resistance level, there could be a steady increase toward the $0.5250 resistance. Any more gains might send the price toward the $0.5350 resistance.
More Losses?
If XRP fails to clear the $0.4950 resistance zone, it could continue to move down. Initial support on the downside is near the $0.480 level.
The next major support is at $0.4740. If there is a downside break and a close below the $0.4740 level, the price might accelerate lower. In the stated case, the price could decline and retest the $0.4550 support in the near term.
Technical Indicators
Hourly MACD – The MACD for XRP/USD is now gaining pace in the bearish zone.
Hourly RSI (Relative Strength Index) – The RSI for XRP/USD is now below the 50 level.
Major Support Levels – $0.4800 and $0.4740.
Major Resistance Levels – $0.4950 and $0.5050.
XRP price failed to recover above the $0.5050 resistance zone. The price is now moving lower and might gain bearish momentum below the $0.480 support.
- XRP is gaining bearish momentum below the $0.500 support.
- The price is now trading below $0.500 and the 100-hourly Simple Moving Average.
- There was a break below a connecting bullish trend line with support at $0.4950 on the hourly chart of the XRP/USD pair (data source from Kraken).
- The pair could decline heavily if it breaks the $0.480 support zone.
XRP Price Breaks Support
XRP price attempted a recovery wave above $0.4920 like Ethereum and Bitcoin. The price climbed above the $0.500 resistance zone, but the bears were active near $0.5050.
A high was formed at $0.5053 and the price is again moving lower. There was a move below the $0.4980 and $0.4950 support levels. The price traded below the 23.6% Fib retracement level of the recovery wave from the $0.4533 swing low to the $0.5053 high.
Besides, there was a break below a connecting bullish trend line with support at $0.4950 on the hourly chart of the XRP/USD pair. The pair is now trading just above the 50% Fib retracement level of the recovery wave from the $0.4533 swing low to the $0.5053 high.
However, it is still trading below $0.50 and the 100-hourly Simple Moving Average. On the upside, the price is facing resistance near the $0.4920 level. The first key resistance is near $0.4950. The next major resistance is near the $0.500 level.
A close above the $0.500 resistance zone could send the price higher. The next key resistance is near $0.5050. If there is a close above the $0.5050 resistance level, there could be a steady increase toward the $0.5250 resistance. Any more gains might send the price toward the $0.5350 resistance.
More Losses?
If XRP fails to clear the $0.4950 resistance zone, it could continue to move down. Initial support on the downside is near the $0.480 level.
The next major support is at $0.4740. If there is a downside break and a close below the $0.4740 level, the price might accelerate lower. In the stated case, the price could decline and retest the $0.4550 support in the near term.
Technical Indicators
Hourly MACD – The MACD for XRP/USD is now gaining pace in the bearish zone.
Hourly RSI (Relative Strength Index) – The RSI for XRP/USD is now below the 50 level.
Major Support Levels – $0.4800 and $0.4740.
Major Resistance Levels – $0.4950 and $0.5050.


get generic clomid without a prescription can you get cheap clomid without rx where to buy clomid pill cost cheap clomiphene without insurance cost of clomiphene at cvs cheap clomid online clomid generico
Greetings! Jolly serviceable suggestion within this article! It’s the scarcely changes which liking turn the largest changes. Thanks a lot quest of sharing!
With thanks. Loads of knowledge!
azithromycin order – metronidazole 400mg canada cheap metronidazole
order rybelsus 14mg pill – where to buy periactin without a prescription order cyproheptadine generic
motilium ca – oral tetracycline 250mg order cyclobenzaprine 15mg generic
order amoxicillin for sale – buy valsartan paypal ipratropium 100mcg drug
order amoxiclav online cheap – at bio info buy acillin medication
buy generic esomeprazole – nexium to us buy esomeprazole 40mg without prescription
buy coumadin 5mg pills – blood thinner purchase losartan pills
mobic 7.5mg brand – tenderness meloxicam pills
buy deltasone 10mg online – https://apreplson.com/ deltasone order
buy ed pills sale – site buy ed pills best price
order amoxil without prescription – https://combamoxi.com/ cheap amoxil
cenforce 50mg cheap – https://cenforcers.com/ buy cenforce 50mg online cheap
cialis 100mg from china – click tadalafil how long to take effect
prescription free cialis – https://strongtadafl.com/# cialis price south africa
cost zantac 150mg – https://aranitidine.com/# ranitidine 150mg over the counter
The thoroughness in this piece is noteworthy. buy cheap generic tamoxifen
More posts like this would make the blogosphere more useful. https://buyfastonl.com/
More articles like this would frame the blogosphere richer. https://ursxdol.com/cenforce-100-200-mg-ed/
Thanks an eye to sharing. It’s acme quality. https://prohnrg.com/product/rosuvastatin-for-sale/