- XRP was down by more than 4% in the last seven days.
- Most market indicators remained bearish on the token.
Like most cryptos, XRP was also facing trouble of late as it failed to raise its price. The latest price correction has pushed XRP down to a critical support level.
This allowed the token to make a bullish move to change the trend. However, if the token fails to test the support, then things can get worse.
XRP bears are leading
CoinMarketCap’s data revealed that XRP’s value dropped by more than 4% in the last seven days. In the last 24 hours alone, its price dipped by over 2%.
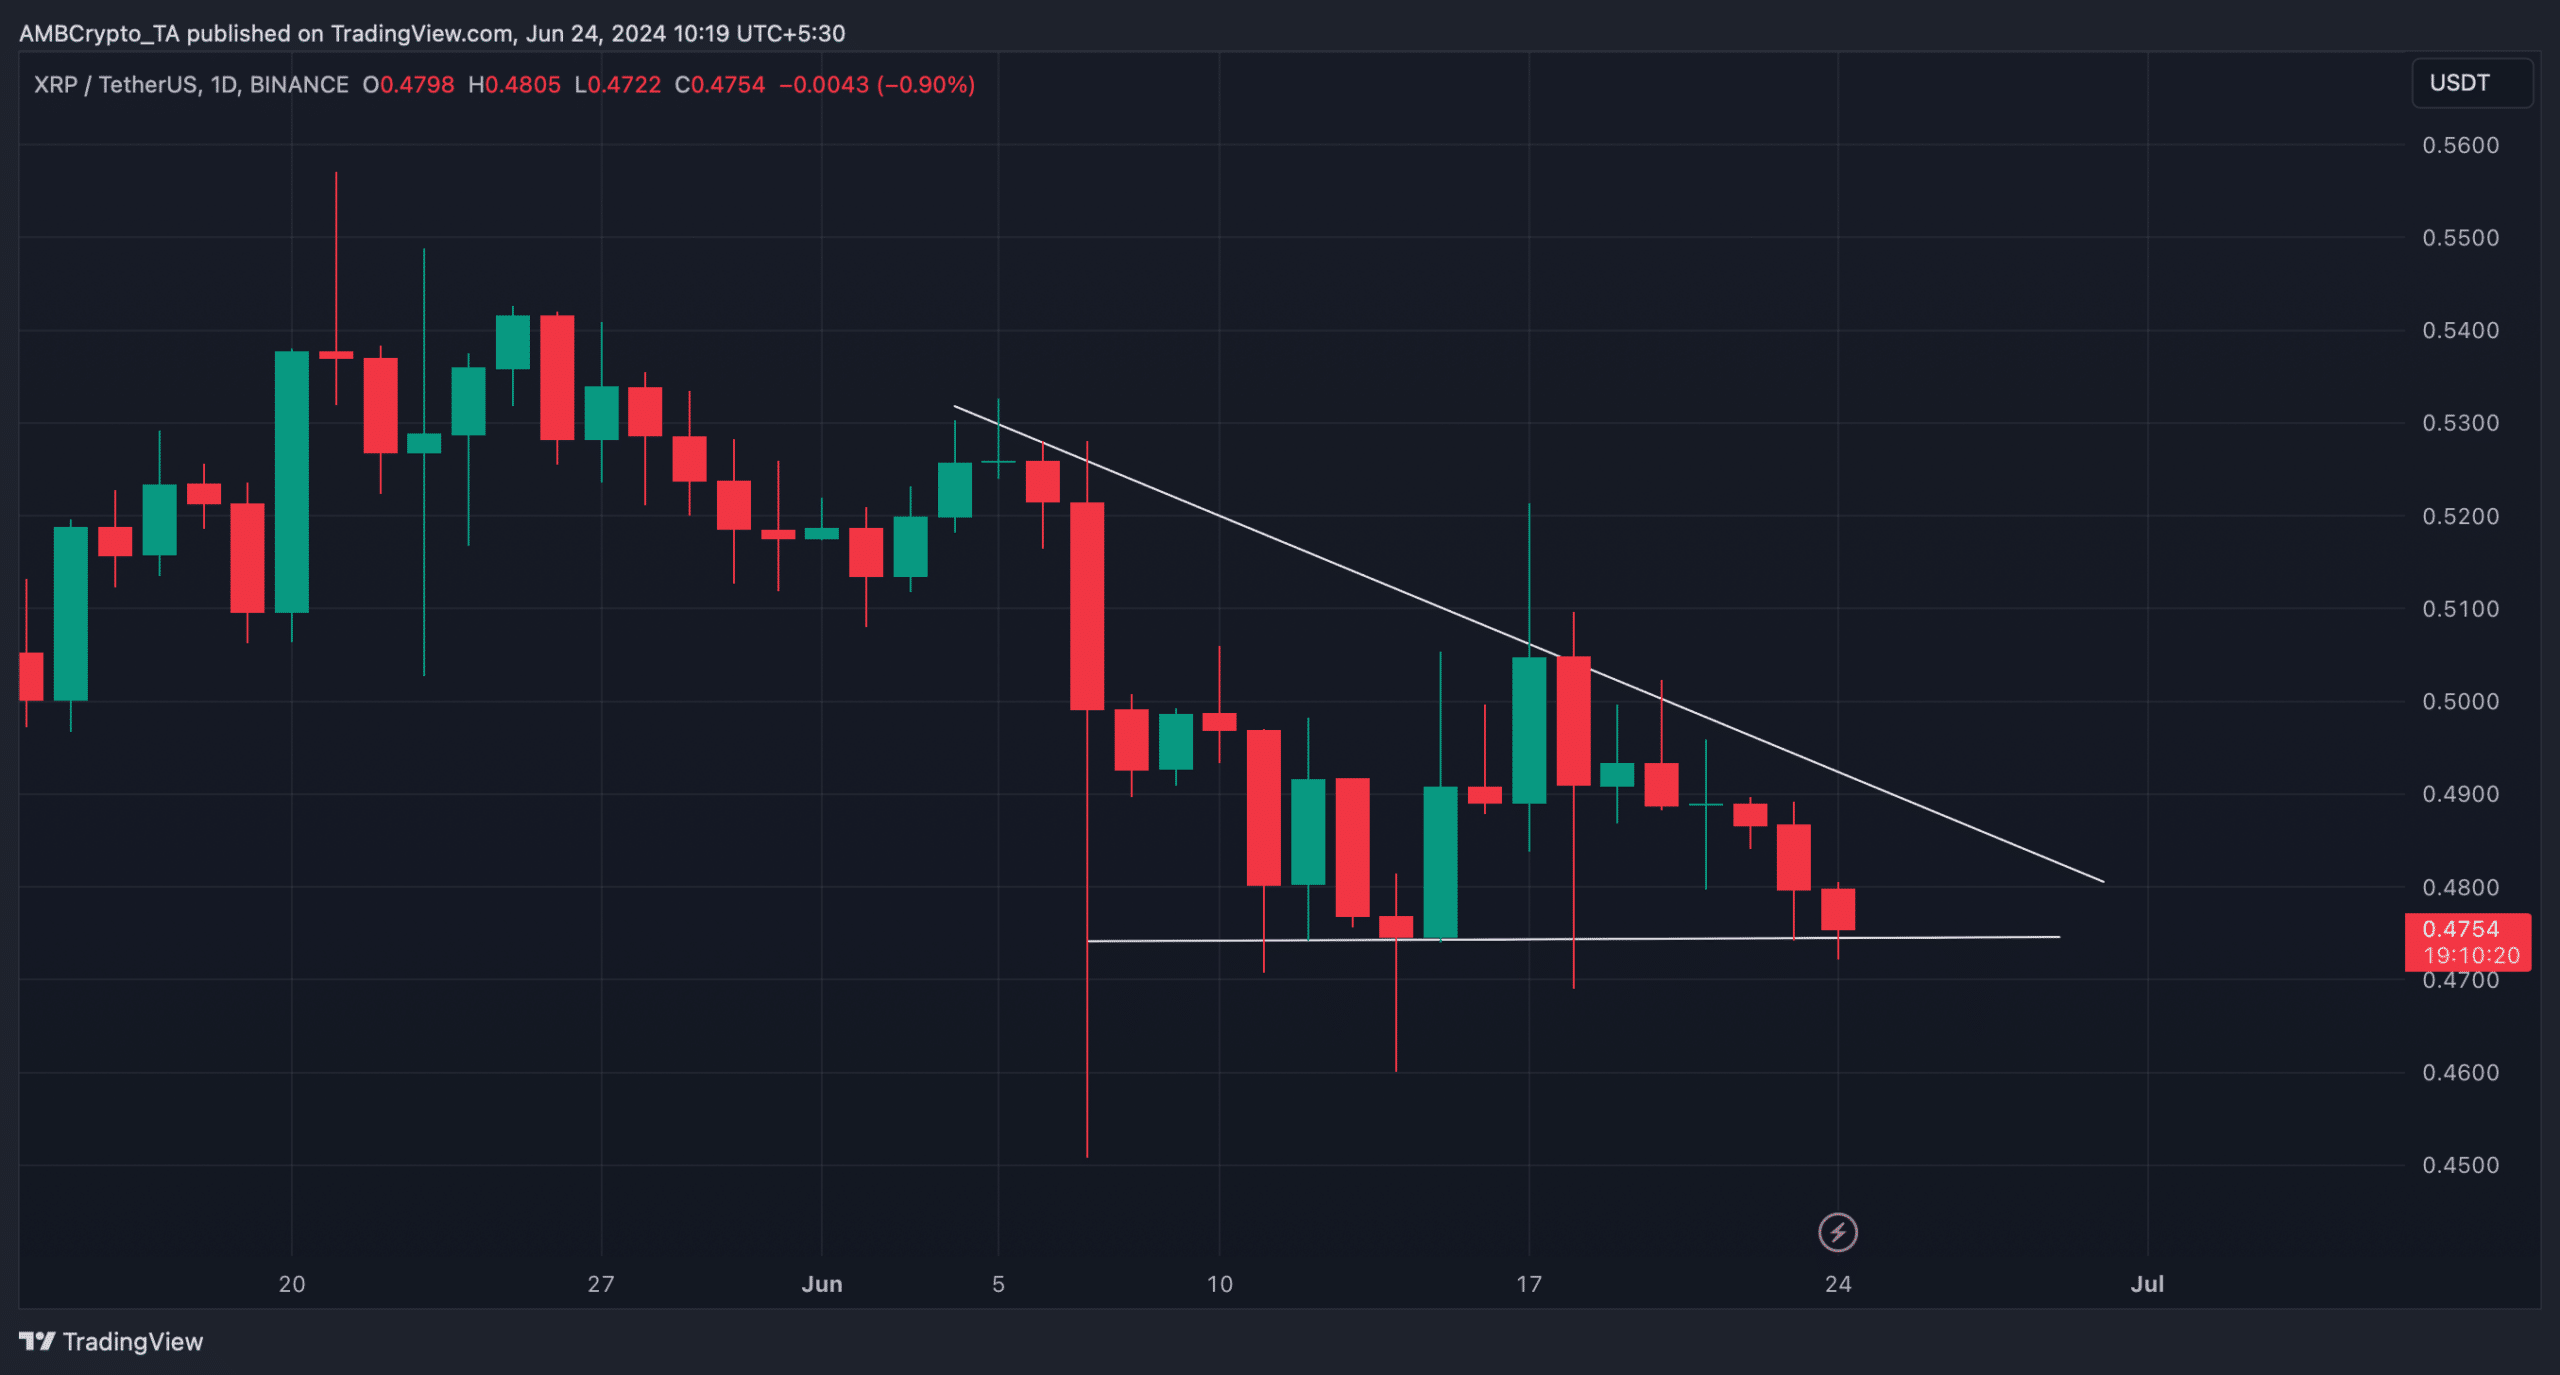
At the time of writing, the token was trading at $0.4754 with a market capitalization of over $26 billion, making it the seventh largest crypto.
AMBCrypto’s analysis of the token’s daily chart revealed that a descending triangle pattern appeared.
In fact, the token was testing its crucial support zone, which gave XRP an opportunity to rebound. But if it fails to test the support, then investors might witness a further price decline in the coming days.

Source: TradingView
What to expect?
Since there was uncertainty about XRP in the coming days, AMBCrypto planned to have a look at the token’s on-chain data.
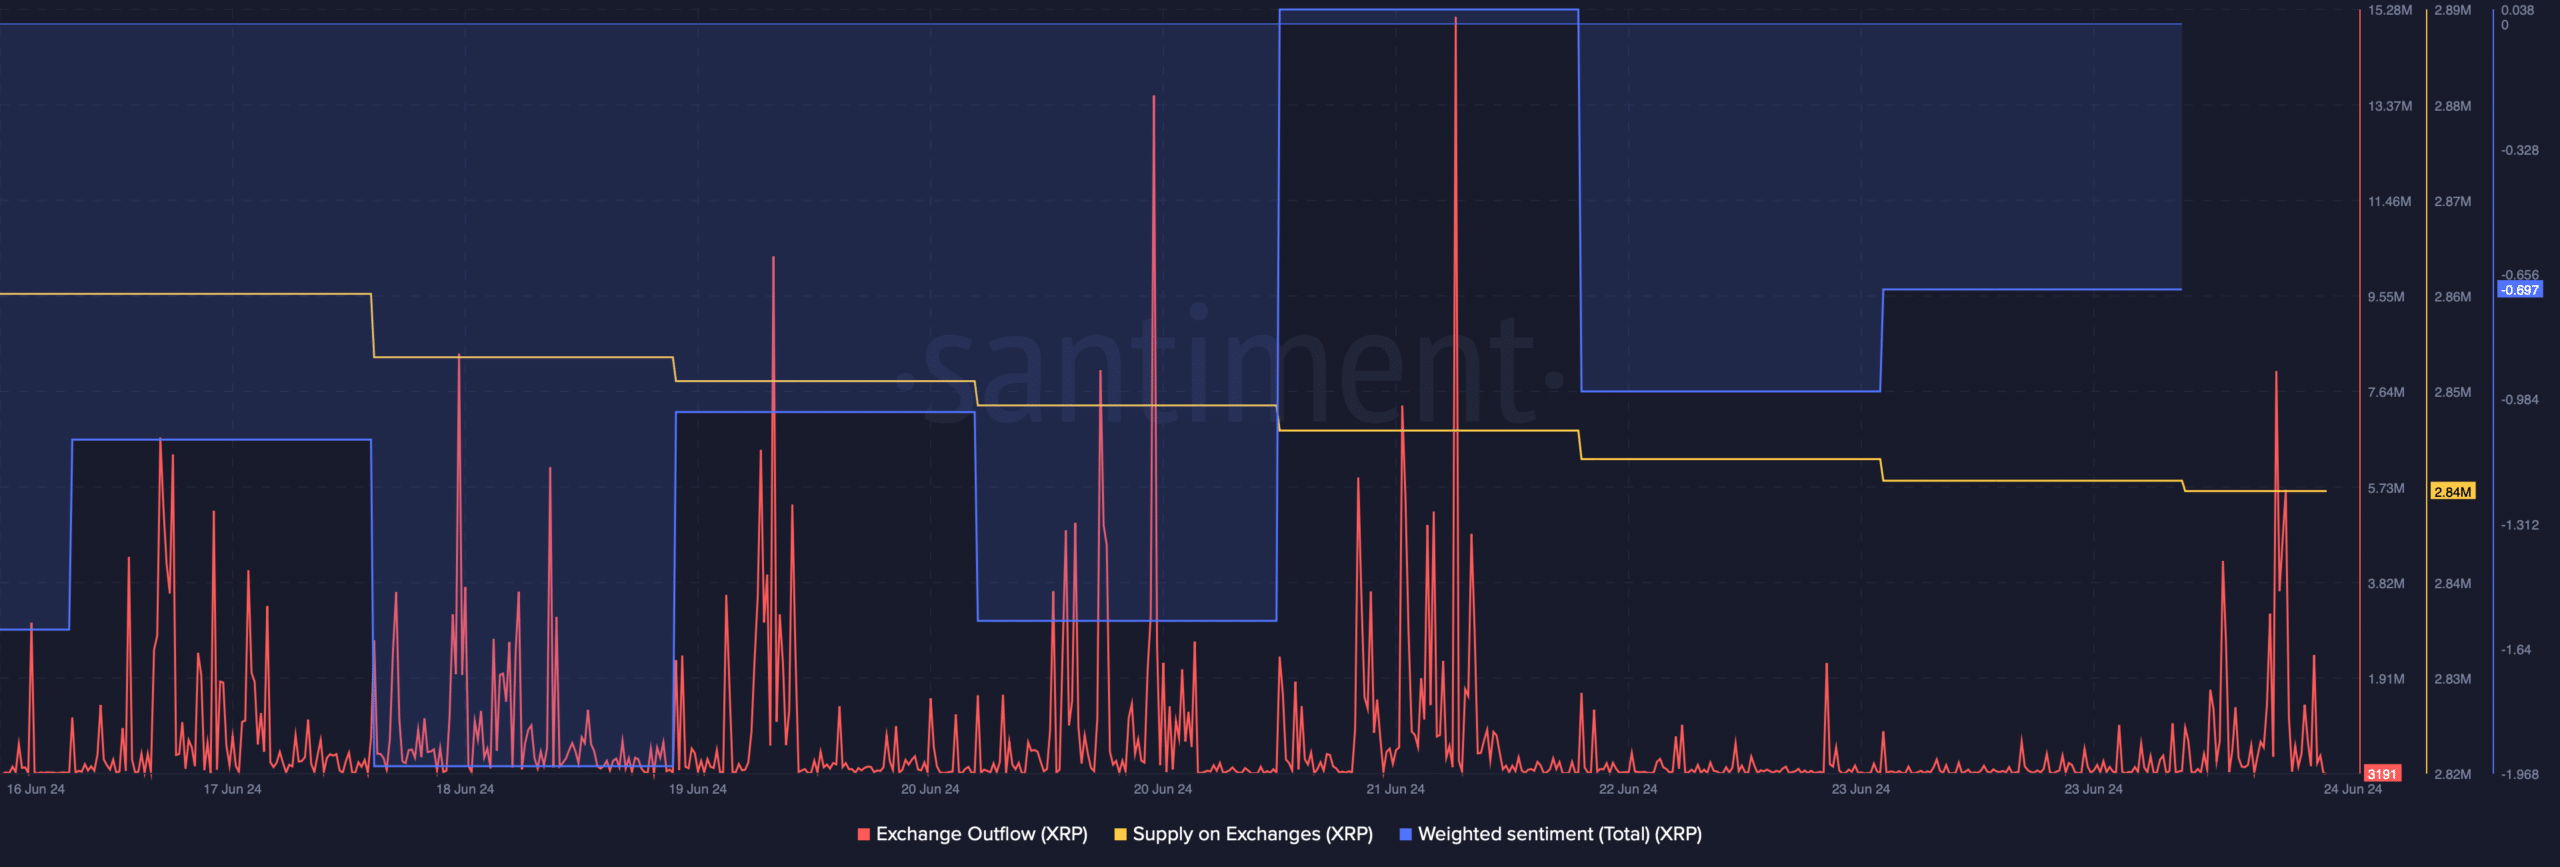
Our analysis of Santiment’s data revealed that buying pressure on XRP was rising. This was evident from the spikes in its exchange outflow last week.
On top of that, its supply on exchanges also dropped, meaning that investors were buying the token.
After a massive dip, the token’s weighted sentiment also improved. A rise in the metric means that investors were confident in XRP and bullish sentiment around the token was increasing.

Source: Santiment
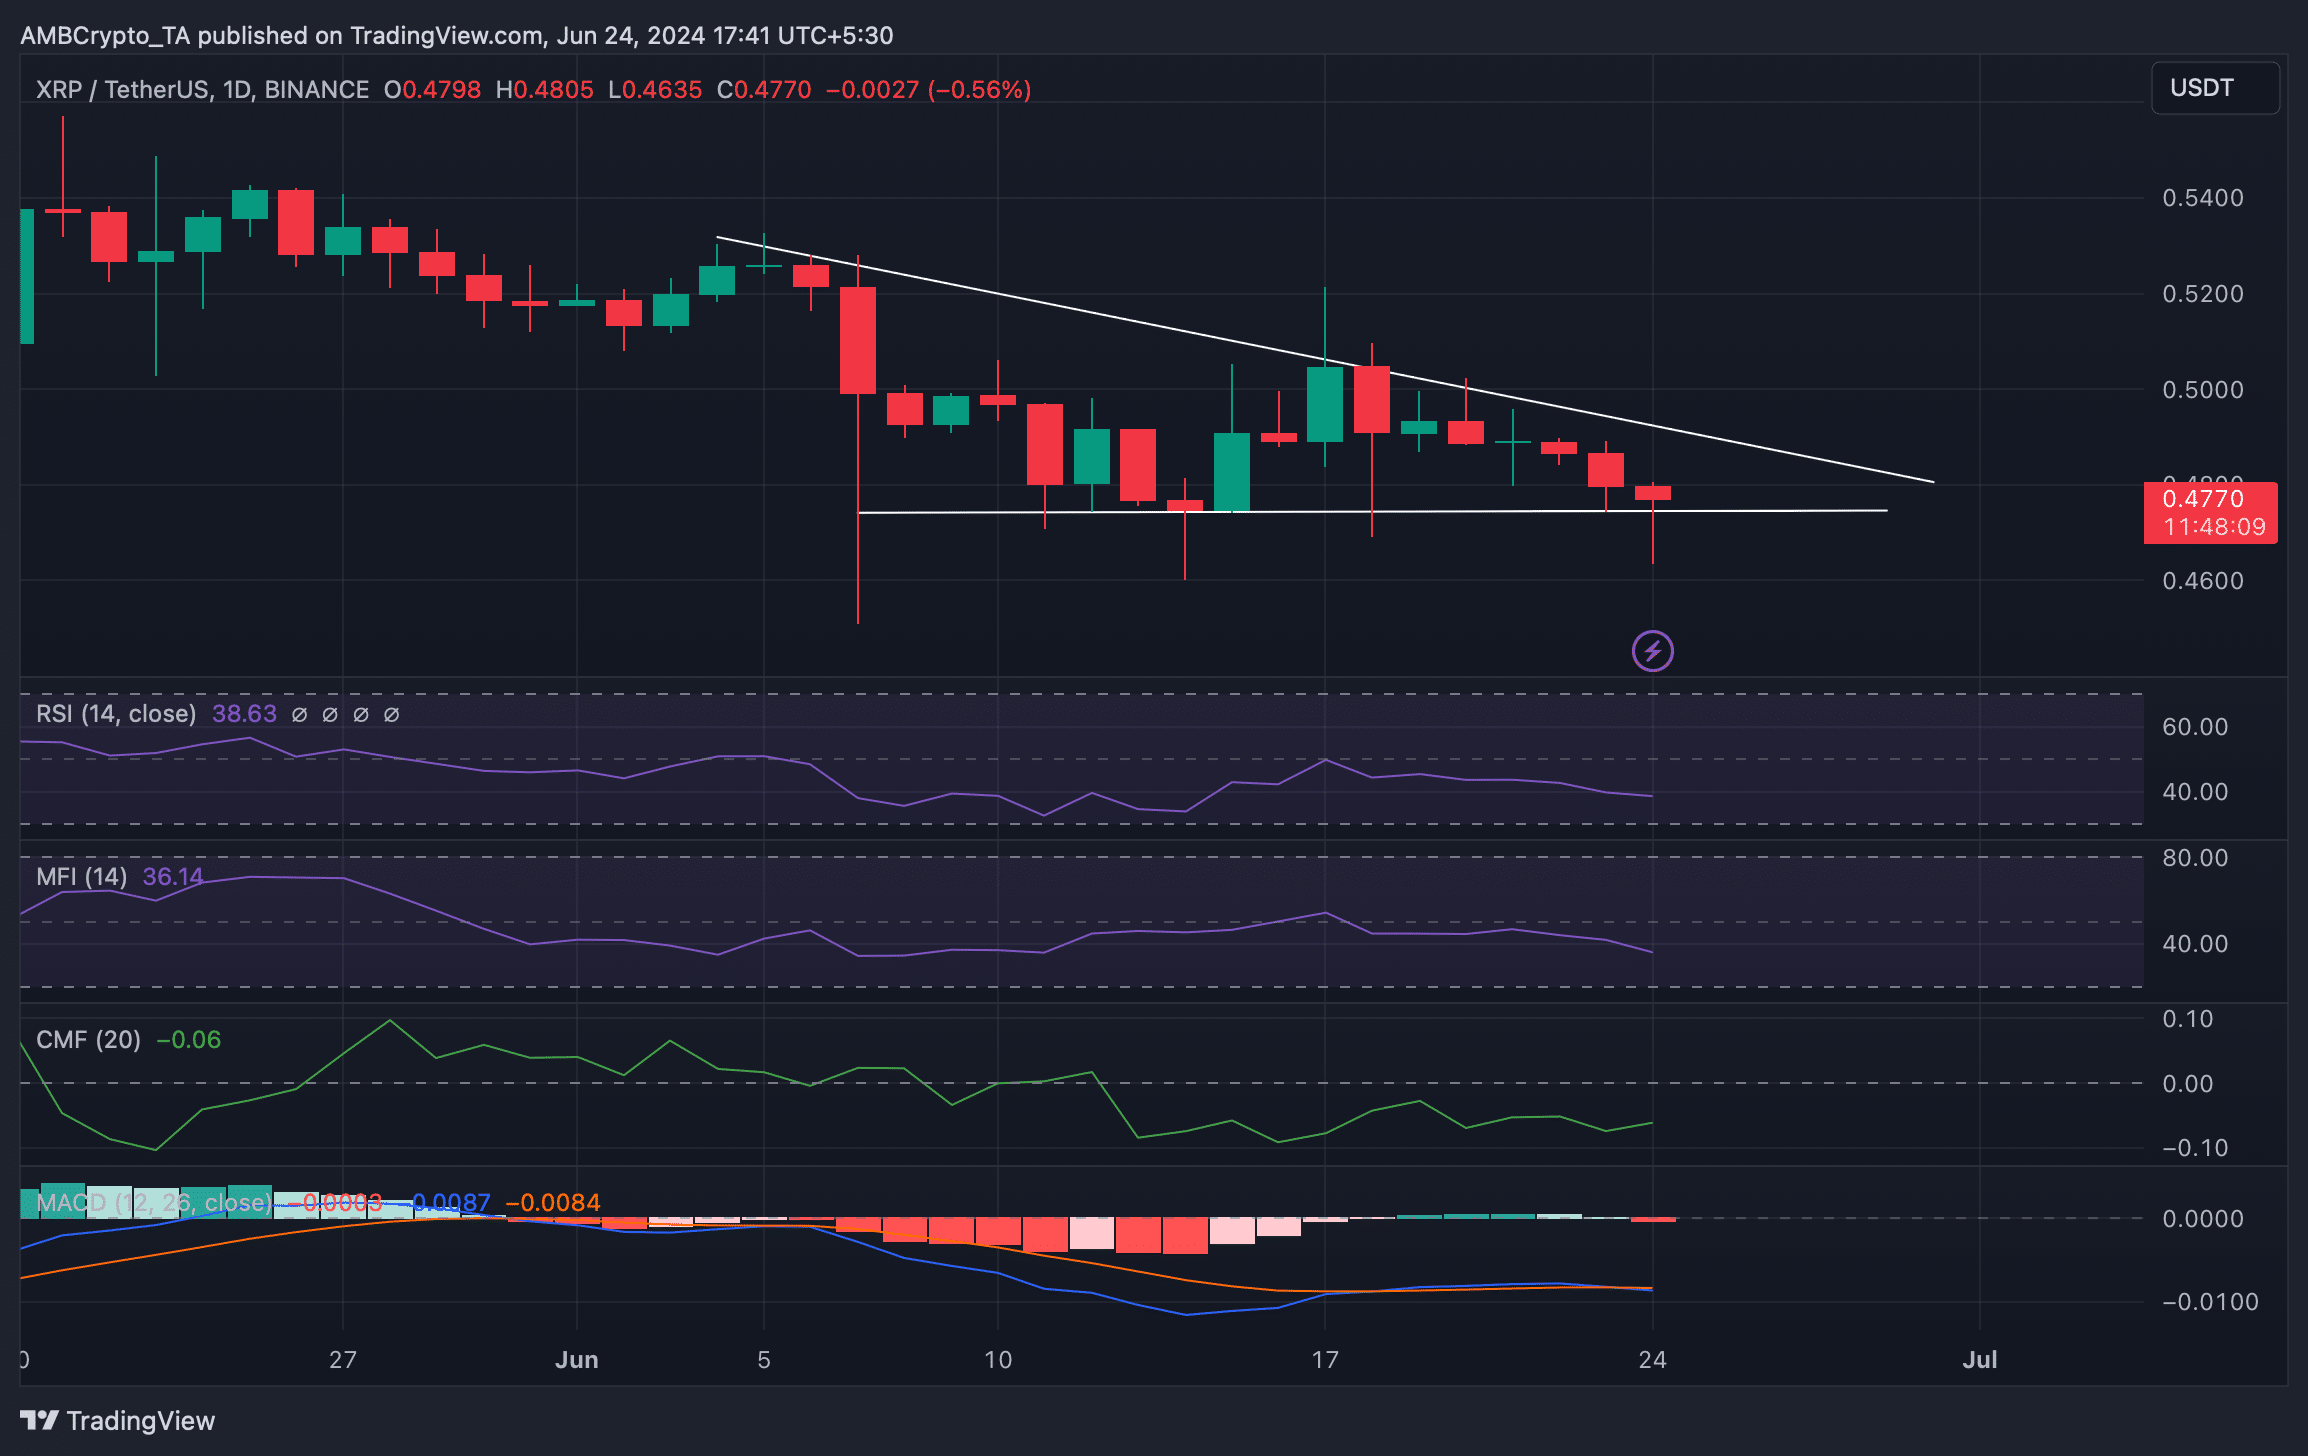
The token’s Chaikin Money Flow (CMF) also looked optimistic as it registered an uptick. However, the rest of the indicators looked bearish, suggesting that XRP might plummet under its support.
Both its Relative Strength Index (RSI) and Money Flow Index (MFI) registered downticks. Additionally, the MACD dispelled the idea that the bulls and the bears were in a battle to gain an advantage over each other.

Source: TradingView
Is your portfolio green? Check out the XRP Profit Calculator
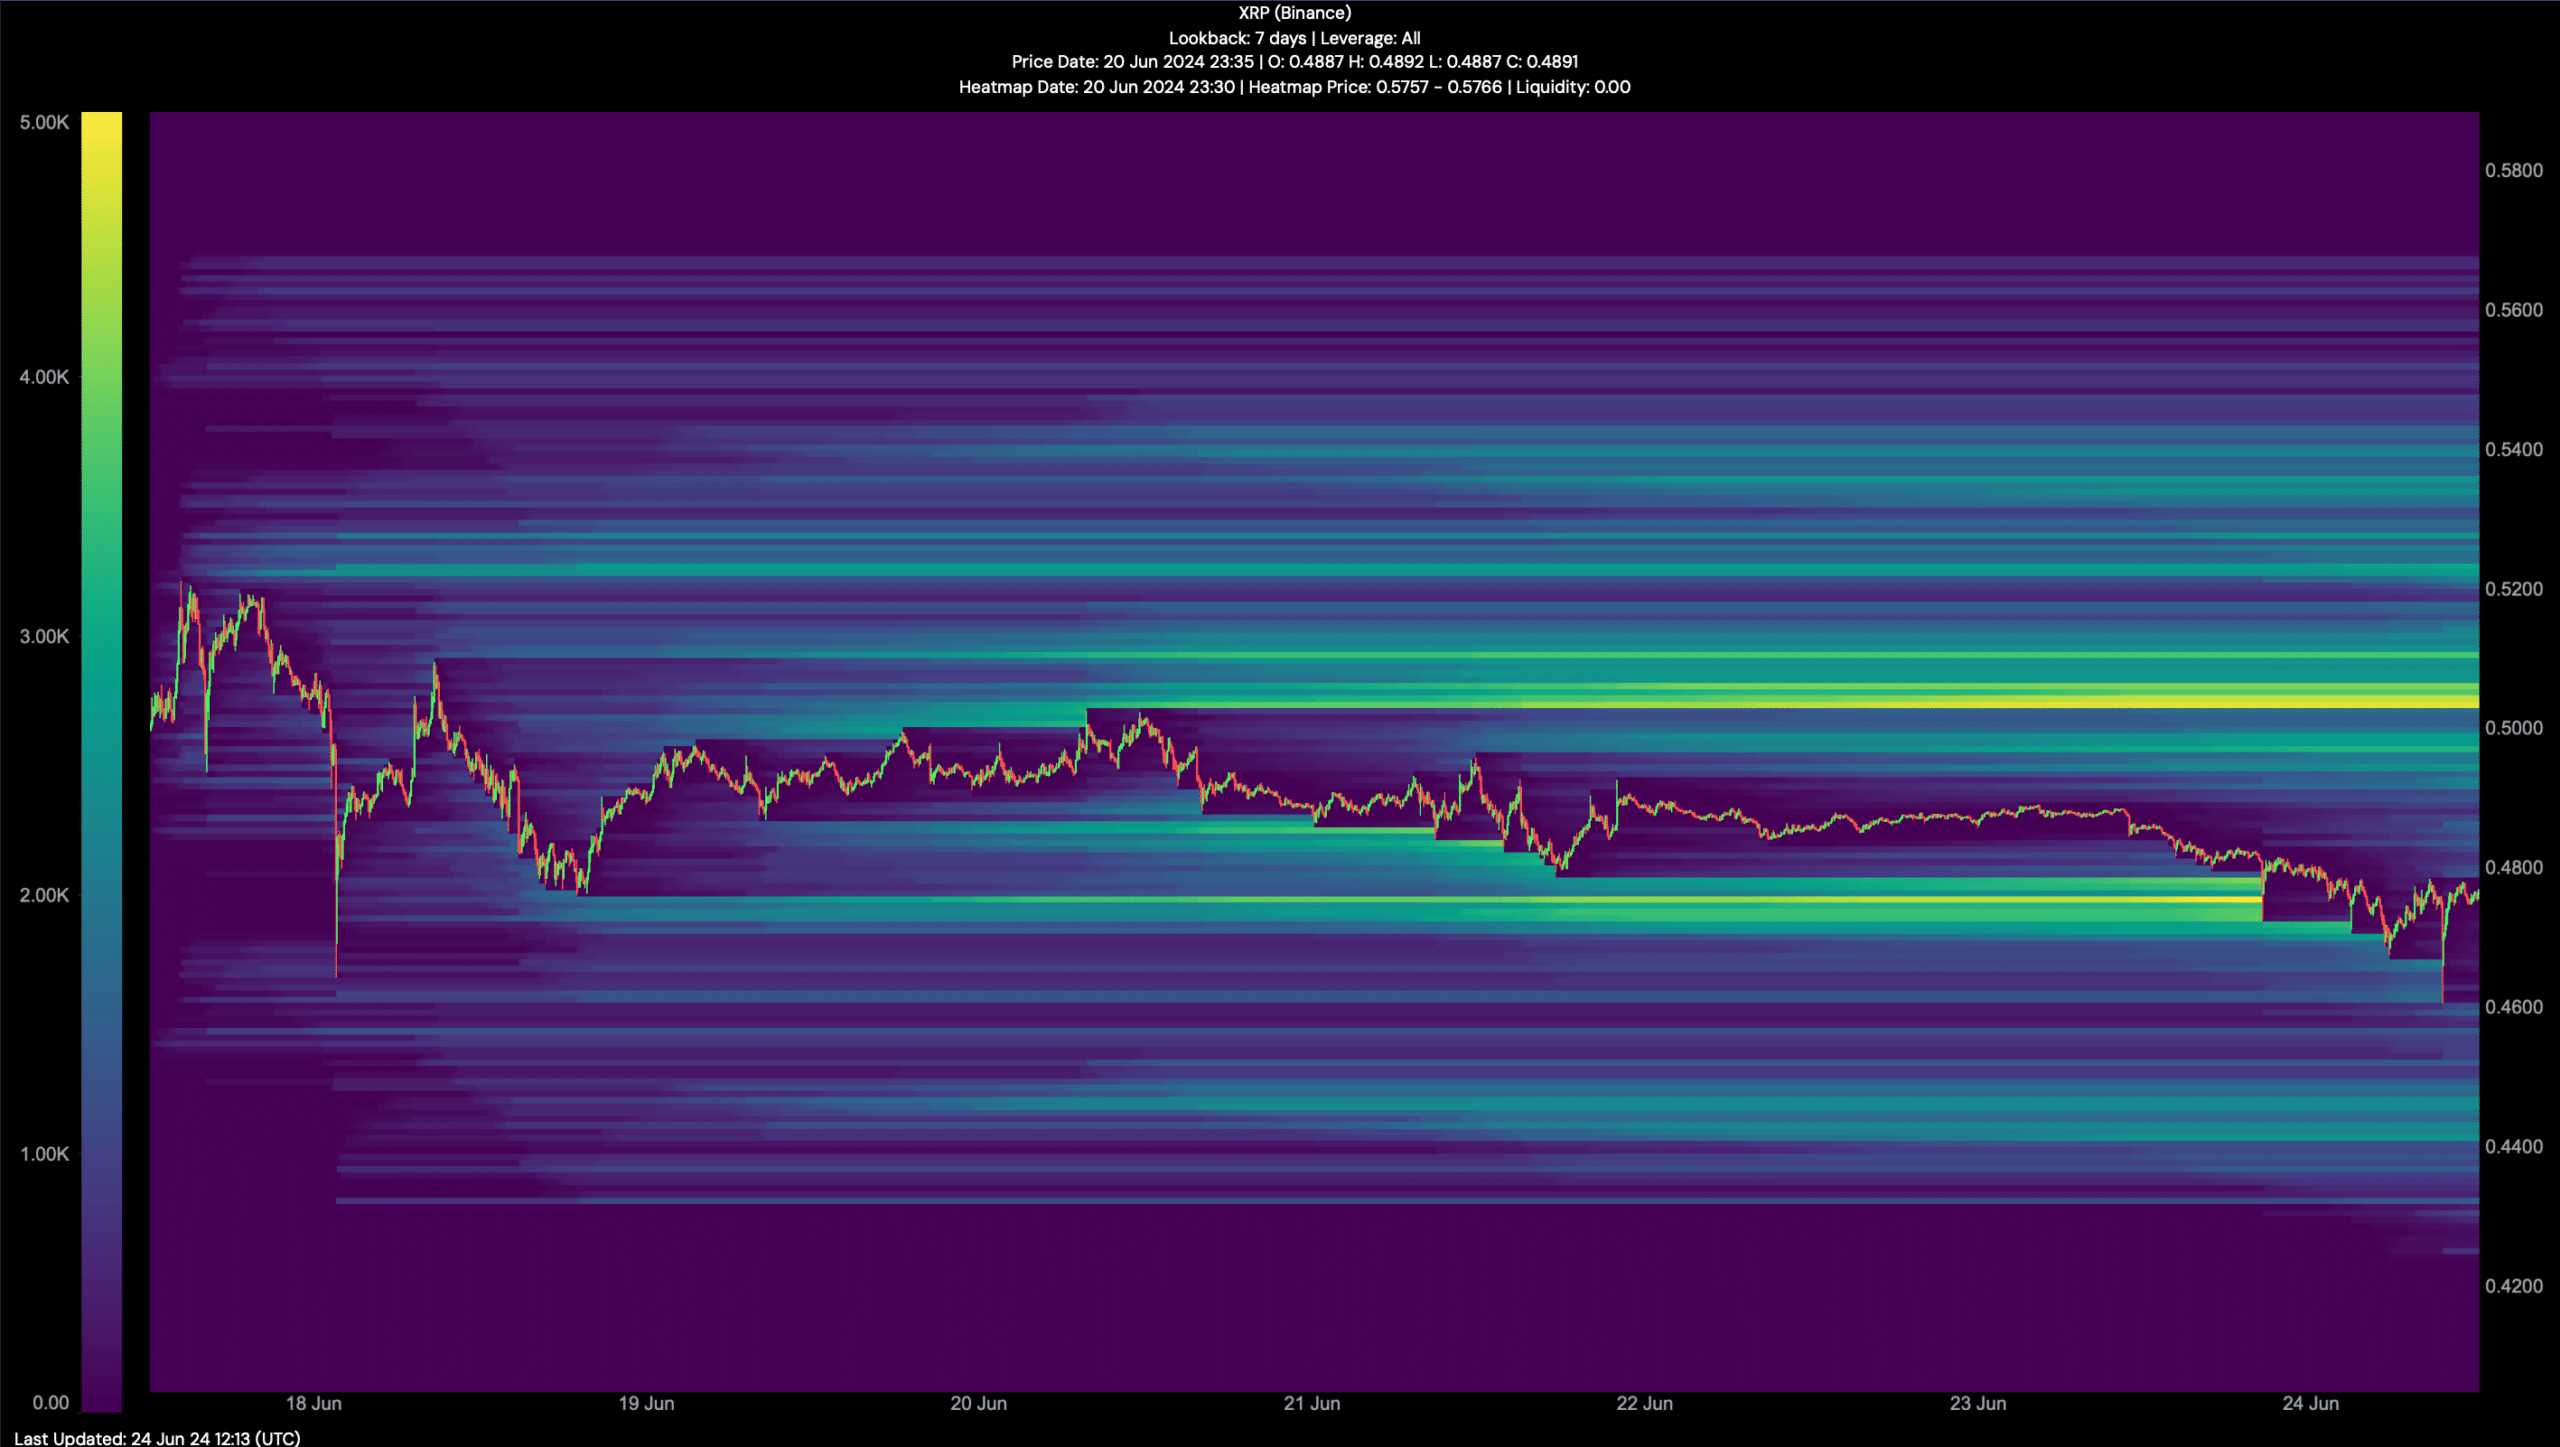
We then checked Hyblock Capital’s data to look for upcoming targets for XRP this week. As per our analysis, the bears continue to dominate.
Then investors might see the token drop to $0.445 this week. However, if the bulls step in and initiate a trend reversal, then the token might as well reclaim $0.5 as liquidation would rise at that level.

Source: Hyblock Capital
- XRP was down by more than 4% in the last seven days.
- Most market indicators remained bearish on the token.
Like most cryptos, XRP was also facing trouble of late as it failed to raise its price. The latest price correction has pushed XRP down to a critical support level.
This allowed the token to make a bullish move to change the trend. However, if the token fails to test the support, then things can get worse.
XRP bears are leading
CoinMarketCap’s data revealed that XRP’s value dropped by more than 4% in the last seven days. In the last 24 hours alone, its price dipped by over 2%.
At the time of writing, the token was trading at $0.4754 with a market capitalization of over $26 billion, making it the seventh largest crypto.
AMBCrypto’s analysis of the token’s daily chart revealed that a descending triangle pattern appeared.
In fact, the token was testing its crucial support zone, which gave XRP an opportunity to rebound. But if it fails to test the support, then investors might witness a further price decline in the coming days.

Source: TradingView
What to expect?
Since there was uncertainty about XRP in the coming days, AMBCrypto planned to have a look at the token’s on-chain data.
Our analysis of Santiment’s data revealed that buying pressure on XRP was rising. This was evident from the spikes in its exchange outflow last week.
On top of that, its supply on exchanges also dropped, meaning that investors were buying the token.
After a massive dip, the token’s weighted sentiment also improved. A rise in the metric means that investors were confident in XRP and bullish sentiment around the token was increasing.

Source: Santiment
The token’s Chaikin Money Flow (CMF) also looked optimistic as it registered an uptick. However, the rest of the indicators looked bearish, suggesting that XRP might plummet under its support.
Both its Relative Strength Index (RSI) and Money Flow Index (MFI) registered downticks. Additionally, the MACD dispelled the idea that the bulls and the bears were in a battle to gain an advantage over each other.

Source: TradingView
Is your portfolio green? Check out the XRP Profit Calculator
We then checked Hyblock Capital’s data to look for upcoming targets for XRP this week. As per our analysis, the bears continue to dominate.
Then investors might see the token drop to $0.445 this week. However, if the bulls step in and initiate a trend reversal, then the token might as well reclaim $0.5 as liquidation would rise at that level.

Source: Hyblock Capital


I really like your writing style, fantastic info , appreciate it for putting up : D.
Nice post. I used to be checking continuously this weblog and I’m impressed! Very helpful info specially the final part 🙂 I care for such info much. I was looking for this particular info for a very lengthy time. Thanks and good luck.
I appreciate, cause I found exactly what I was looking for. You have ended my four day long hunt! God Bless you man. Have a great day. Bye
I wanted to thank you for this great read!! I definitely enjoying every little bit of it I have you bookmarked to check out new stuff you post…
Great ?V I should definitely pronounce, impressed with your web site. I had no trouble navigating through all the tabs and related information ended up being truly easy to do to access. I recently found what I hoped for before you know it at all. Reasonably unusual. Is likely to appreciate it for those who add forums or something, website theme . a tones way for your client to communicate. Excellent task..
Thank you for another informative website. Where else could I get that type of info written in such an ideal way? I have a project that I am just now working on, and I’ve been on the look out for such information.
This is a very good tips especially to those new to blogosphere, brief and accurate information… Thanks for sharing this one. A must read article.
It’s really a great and useful piece of info. I’m glad that you shared this helpful information with us. Please keep us up to date like this. Thank you for sharing.
This really answered my problem, thank you!
where can i get clomiphene without dr prescription get cheap clomid without rx generic clomiphene where buy clomid no prescription clomiphene or nolvadex for pct can you get cheap clomid without insurance clomiphene pregnancy
More articles like this would pretence of the blogosphere richer.
hello!,I really like your writing so a lot! proportion we be in contact extra approximately your article on AOL? I require an expert on this area to resolve my problem. May be that’s you! Taking a look ahead to look you.
I couldn’t turn down commenting. Profoundly written!
azithromycin 500mg for sale – buy ofloxacin buy metronidazole 400mg sale
buy semaglutide 14 mg – cost cyproheptadine 4 mg generic periactin 4 mg
domperidone 10mg canada – buy sumycin 250mg sale order cyclobenzaprine pill
zithromax for sale – order generic azithromycin 500mg buy generic nebivolol online
incrível este conteúdo. Gostei muito. Aproveitem e vejam este conteúdo. informações, novidades e muito mais. Não deixem de acessar para se informar mais. Obrigado a todos e até a próxima. 🙂
order augmentin 1000mg without prescription – https://atbioinfo.com/ buy ampicillin sale
Adorei este site. Pra saber mais detalhes acesse nosso site e descubra mais. Todas as informações contidas são informações relevantes e exclusivas. Tudo que você precisa saber está está lá.
esomeprazole tablet – https://anexamate.com/ order nexium 40mg generic
order warfarin 5mg generic – blood thinner order generic hyzaar
order mobic 7.5mg sale – moboxsin order mobic 7.5mg pills
Its excellent as your other posts : D, thankyou for putting up. “A great flame follows a little spark.” by Dante Alighieri.
order deltasone 5mg without prescription – https://apreplson.com/ order deltasone for sale
low cost ed pills – fast ed to take site top ed pills
amoxicillin tablet – comba moxi purchase amoxil generic
This website absolutely has all of the information and facts I needed to this case and didn’t identify who to ask.
This is a topic which is virtually to my callousness… Diverse thanks! Quite where can I upon the contact details in the course of questions?
order diflucan 200mg – buy fluconazole 200mg for sale order diflucan 200mg for sale
cenforce 50mg generic – buy cenforce 50mg online cheap buy cenforce online cheap
cialis and poppers – https://ciltadgn.com/# tadalafil 20 mg directions
zantac 300mg pill – online cheap zantac 300mg
cialis coupon free trial – https://strongtadafl.com/ cialis super active vs regular cialis
Proof blog you possess here.. It’s hard to assign great calibre writing like yours these days. I really respect individuals like you! Take mindfulness!! site
where can i buy viagra from – click buy viagra quebec
Thanks for sharing. It’s acme quality. https://ursxdol.com/furosemide-diuretic/
This is a question which is forthcoming to my heart… Numberless thanks! Quite where can I find the contact details in the course of questions? https://buyfastonl.com/
Proof blog you procure here.. It’s obdurate to assign high calibre belles-lettres like yours these days. I justifiably recognize individuals like you! Withstand care!! https://prohnrg.com/
My brother suggested I might like this website. He was entirely right. This post truly made my day. You cann’t imagine just how much time I had spent for this information! Thanks!
I’ll certainly carry back to skim more. prix clenbuterol
This is the kind of glad I enjoy reading. https://ondactone.com/spironolactone/
Proof blog you possess here.. It’s intricate to on elevated worth belles-lettres like yours these days. I really recognize individuals like you! Take guardianship!!
https://doxycyclinege.com/pro/ondansetron/
This is the make of delivery I unearth helpful. http://bbs.dubu.cn/home.php?mod=space&uid=394715
Just wanna input on few general things, The website pattern is perfect, the articles is really good. “The idea of God is the sole wrong for which I cannot forgive mankind.” by Marquis de Sade.
I always was concerned in this subject and stock still am, thanks for putting up.
order forxiga 10mg generic – buy forxiga 10 mg sale dapagliflozin us
I have recently started a website, the info you offer on this web site has helped me greatly. Thanks for all of your time & work.
orlistat price – https://asacostat.com/# buy orlistat 60mg generic
I’m not sure where you’re getting your info, but good topic. I needs to spend some time learning more or understanding more. Thanks for excellent info I was looking for this info for my mission.
Thanks an eye to sharing. It’s outstrip quality. http://iawbs.com/home.php?mod=space&uid=916883