


- BTC has dropped below its 200-day moving average for the second time, the first being July 2024.
- An analyst predicted a drop to BTC’s realized price of $31500.
Bitcoin [BTC], has experienced extreme volatility over the last months. Since hitting a local high of $70016 in July, it has failed to maintain an upward momentum. In fact, over the last month, it has declined by 4.63%.
However, over the past week, BTC has attempted to reverse the trend by increasing by 4.16% weekly. Despite these attempts, it has failed to sustain the momentum.
As of this writing, BTC was trading at $58093. This marked a 0.40% decline over the past day.
Equally, the crypto’s trading volume dropped by 19.90% to $29.7 billion over the past 24 hours.
This market indecision and lack of clear trajectory has left market analysts seeing a further decline before a reversal. Inasmuch, popular Crypto analyst Ali Martinez a drop to its realized price citing its 200-day moving average
Market sentiment
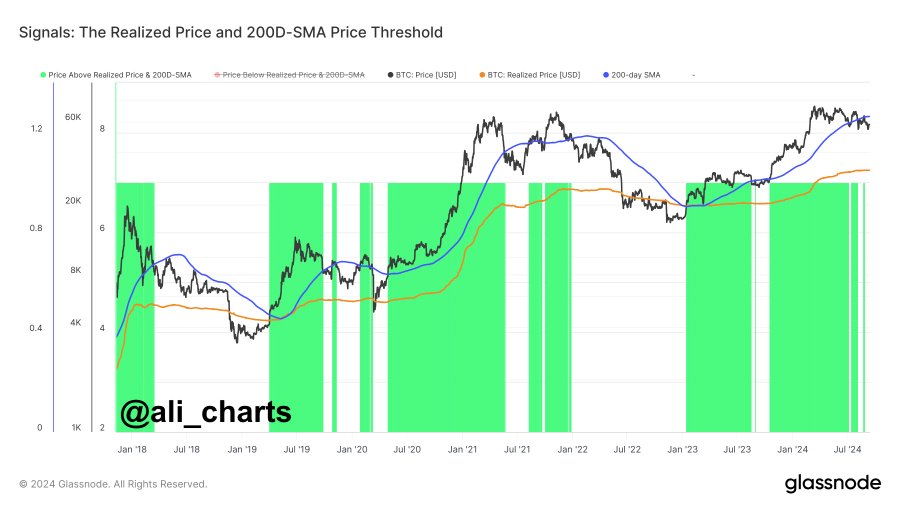
According to his analysis, when Bitcoin trades above its 200-day moving average, it indicated strong returns. However, when it drops below this level, it sets the crypto for a sustained decline.
Source: Ali on X
Therefore, since it has traded below $64000, over the past month, it suggested a potential drop to its realized price of $31500.
In context, when BTC markets trade below the 200-day average, it’s said to be in a downtrend. While, when it trades above the 200-day moving average, it’s considered bullish.
Historically, when BTC falls below its 200-day moving average, prices tend to drop shortly after. First, during the 2016-2017 bull market, BTC fell below the 200-day SMA for three consecutive months.
During the 2018-2019 cycle, it fell below the 200-day MA in mid-2019 before COVID-19 disrupted the pattern. In August 2023, it fell below 200-day MA until October, which was accompanied by a price decline.
Recently, on the 4th of July, BTC dropped by 2% to trade at $57300 thus falling below its 200-day moving average of $58720.
However, when BTC breaks above this trendline prices tend to surge. For instance, in October 2023, when prices broke above the 200-day MA, BTC was trading at $28000.
A breakout from this trendline fueled expectations for ETFs thus paving the way for ATH at $73737. In July when it broke out from the trendline, its prices recovered to $70016.
What Bitcoin charts indicate
Undoubtedly, as Martinez posited, a drop below the 200-day MA indicated a decline, per historical data. But what do other indicators say?
Source: CryptoQuant
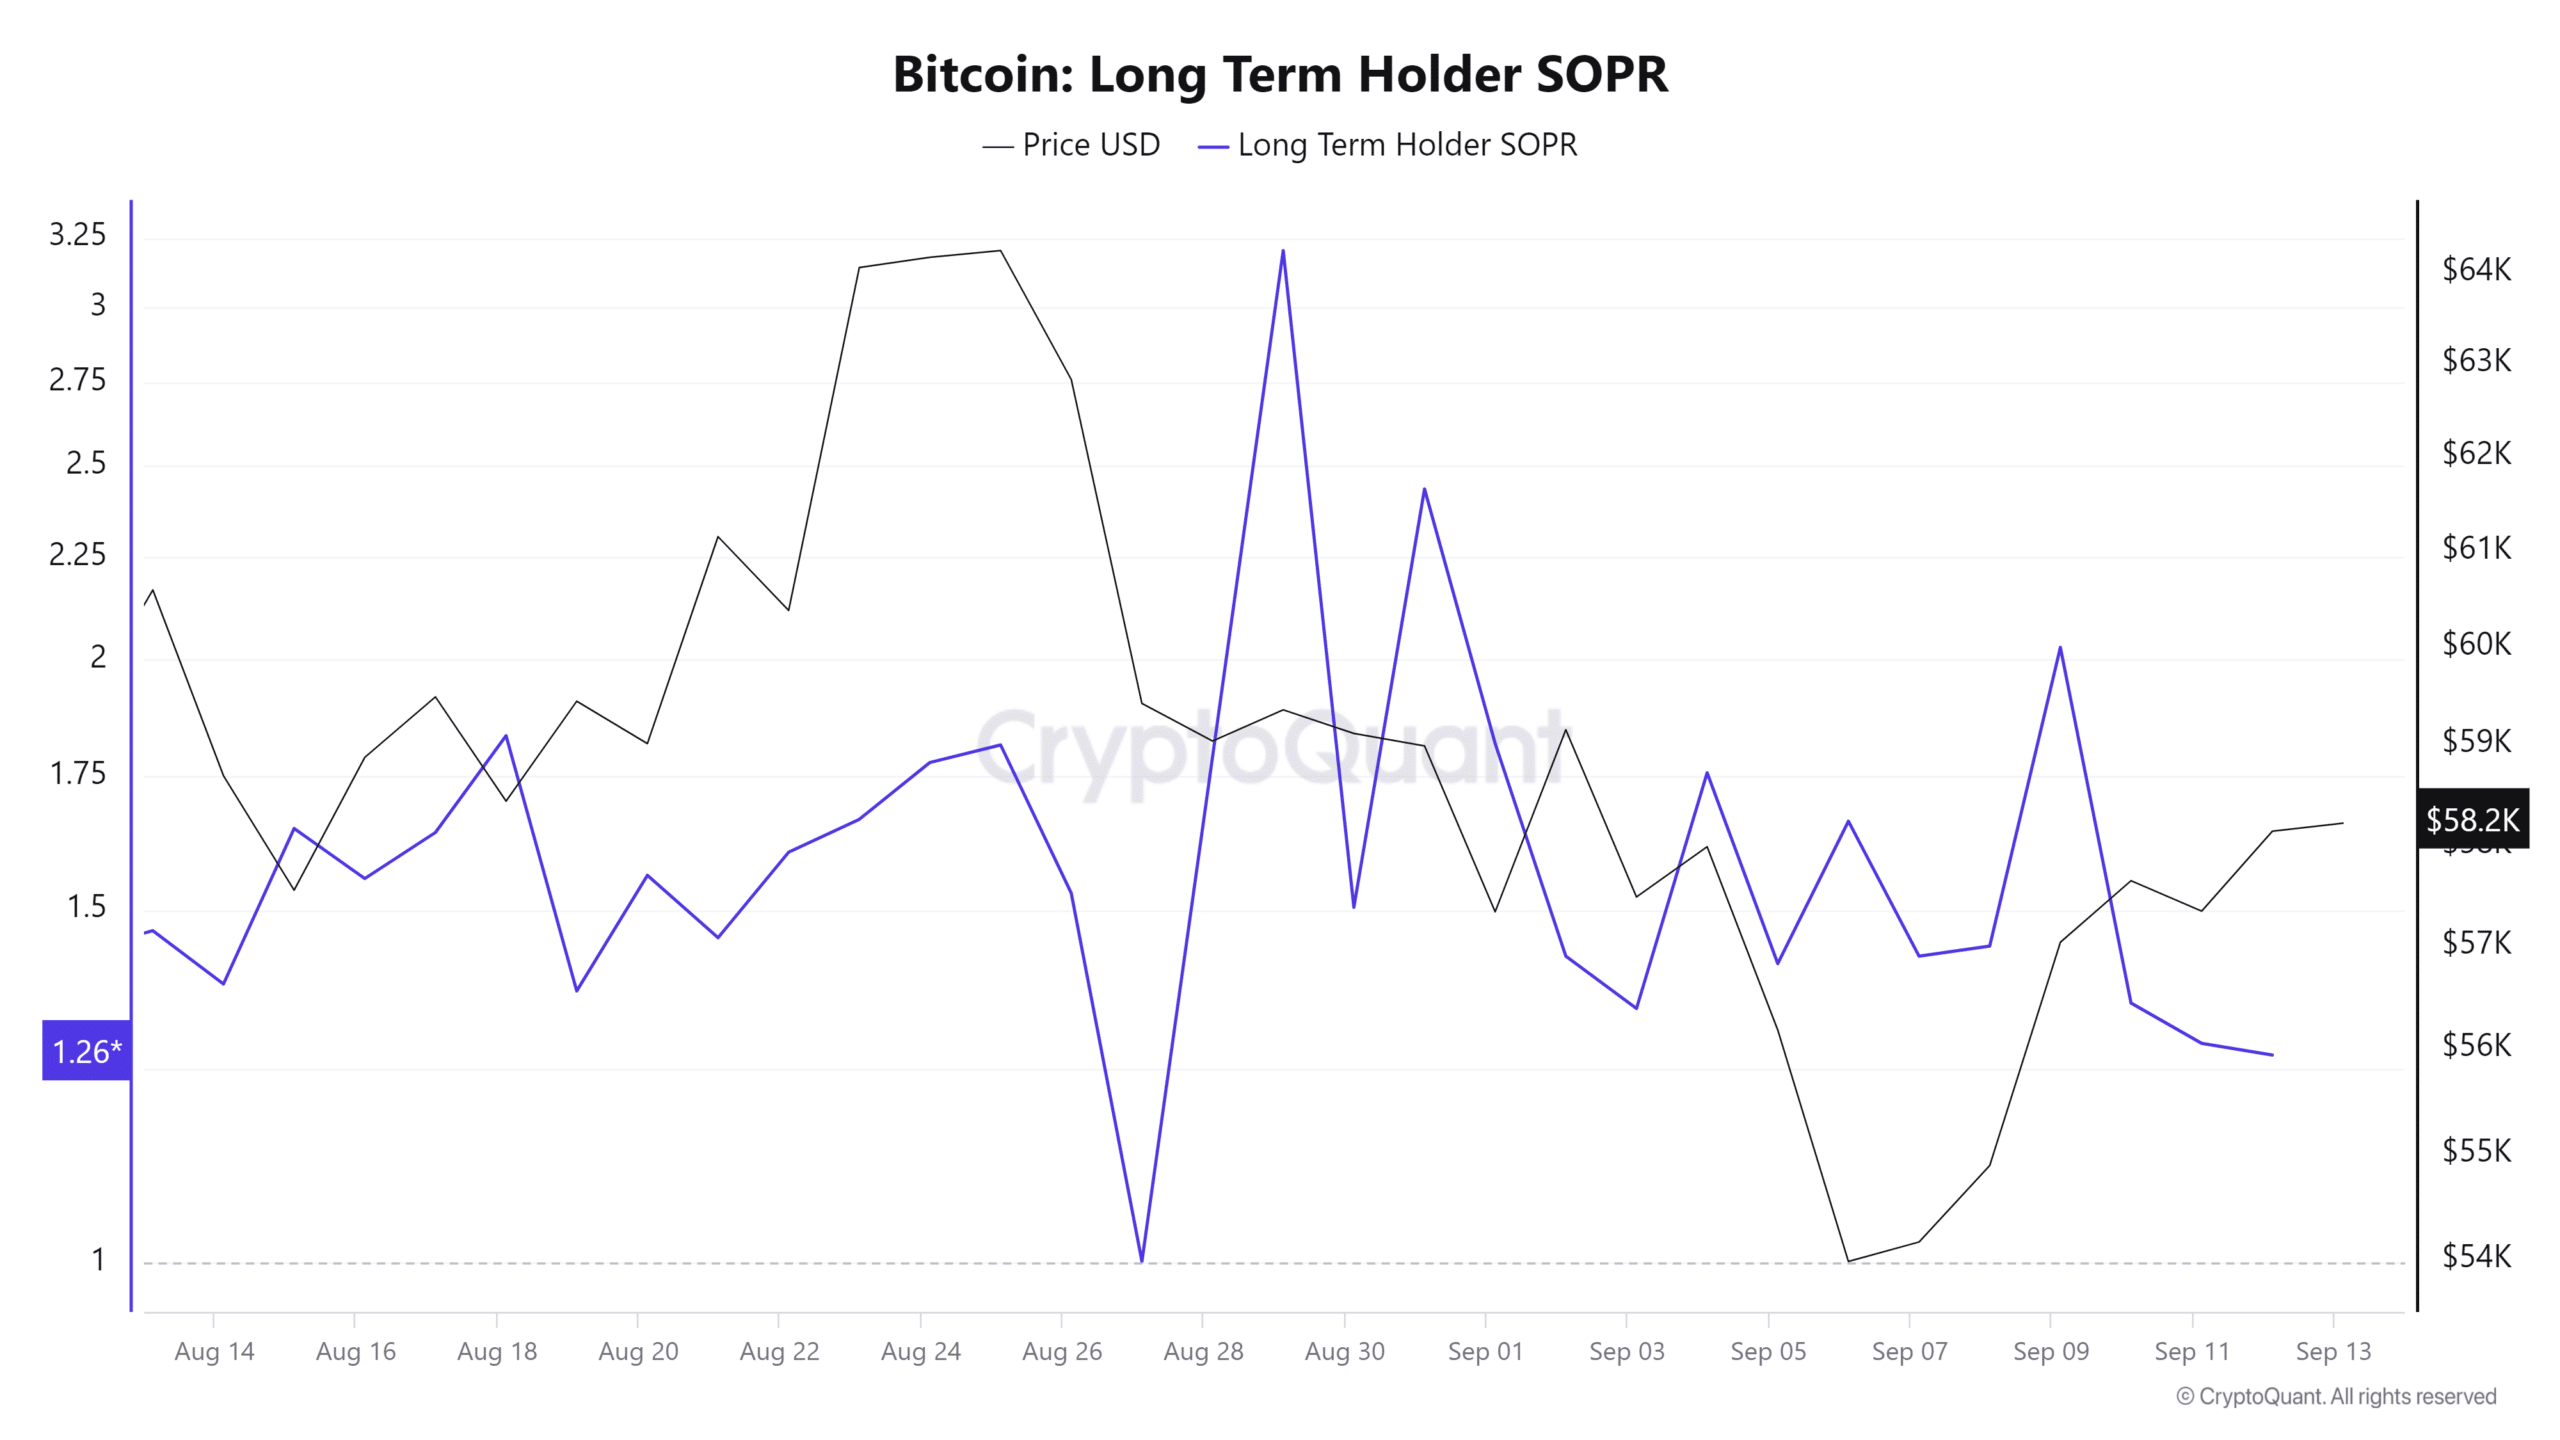
For starters, Bitcoin’s long-term holders SOPR has been on a declining channel since the 29th of August. The LTH SOPR has declined from 3.2 to 1.2, indicating bearish sentiment among long-term investors.
This implied they no longer expected BTC to recover, thus selling to avoid further losses.
Such market behavior results in selling pressure, driving prices down.
Source: CryptoQuant
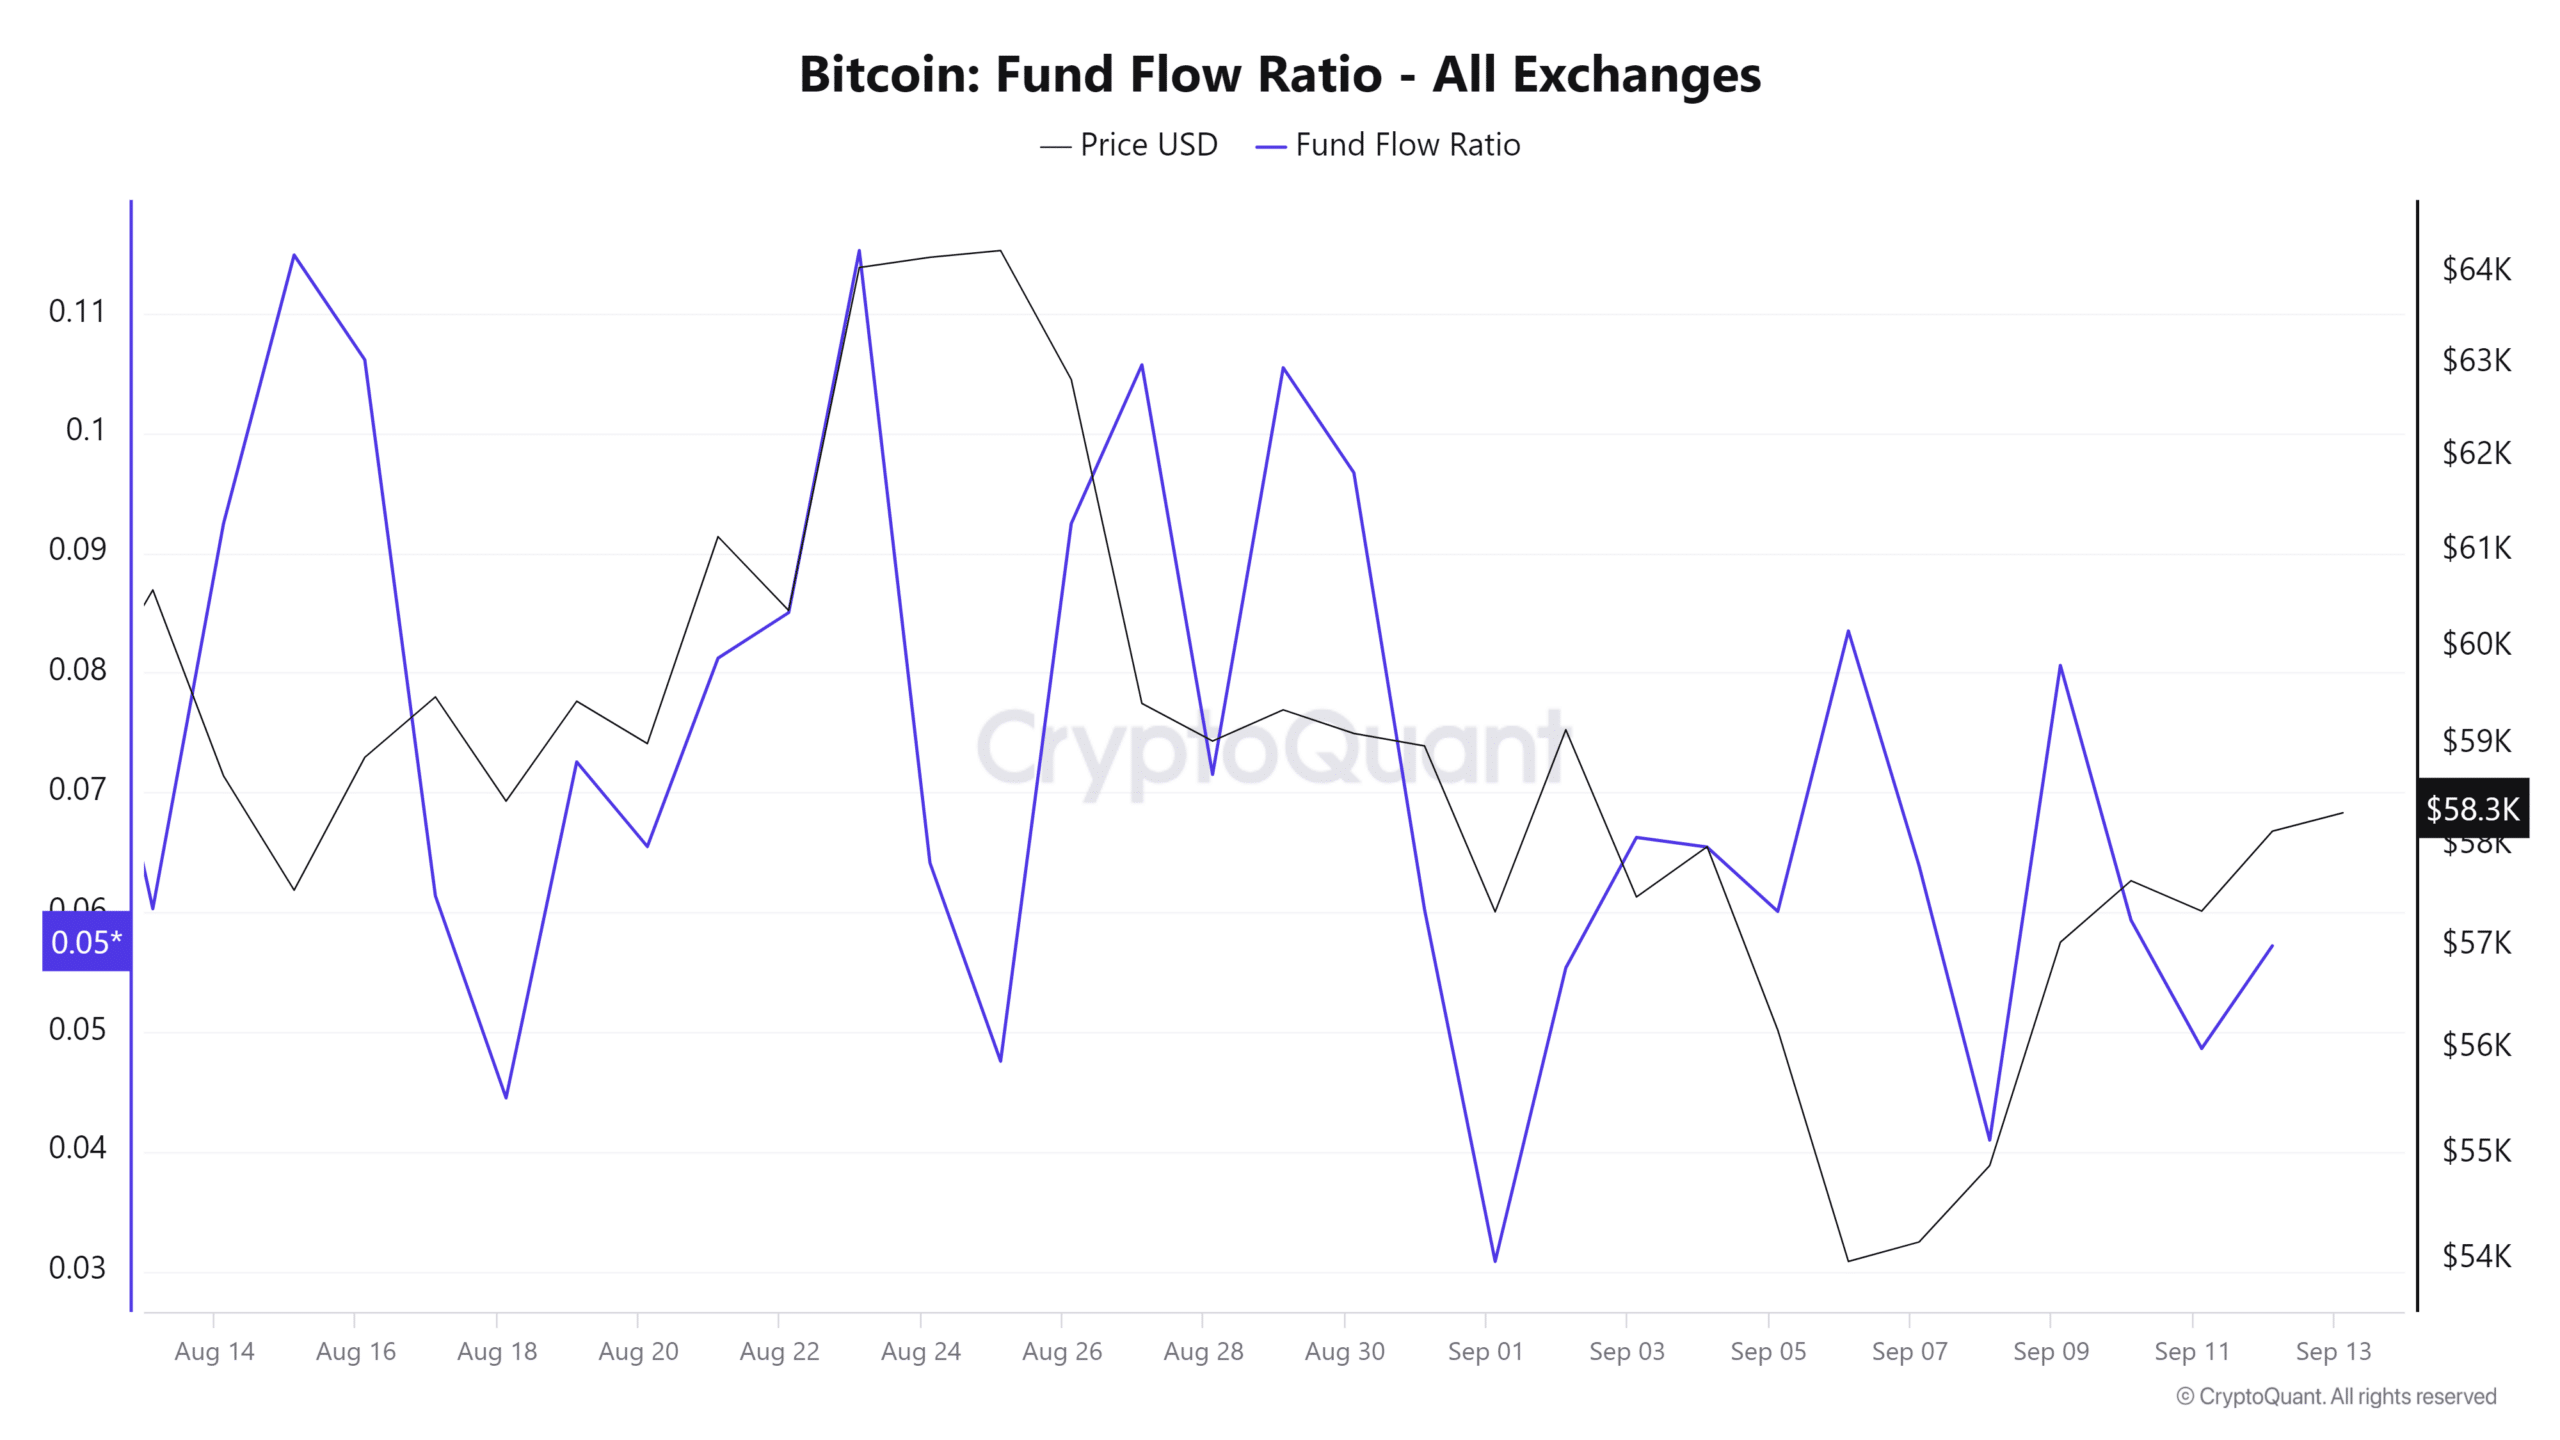
Additionally, Bitcoin’s Fund Flow Ratio has declined over the past month, implying less capital inflow relative to overall trading volume.
This suggested that investors lacked confidence and they were not committing new funds. When investors close their positions, it results in selling pressure, which further pushes prices down.
Read Bitcoin’s [BTC] Price Prediction 2024–2025
Therefore, as Martinez posits, a drop below the 200-day MA implied further decline. Based on current market sentiment, BTC was positioned to decline to $54147 in the short term.
However, a breakout from this trendline will push prices up to $64727.
- BTC has dropped below its 200-day moving average for the second time, the first being July 2024.
- An analyst predicted a drop to BTC’s realized price of $31500.
Bitcoin [BTC], has experienced extreme volatility over the last months. Since hitting a local high of $70016 in July, it has failed to maintain an upward momentum. In fact, over the last month, it has declined by 4.63%.
However, over the past week, BTC has attempted to reverse the trend by increasing by 4.16% weekly. Despite these attempts, it has failed to sustain the momentum.
As of this writing, BTC was trading at $58093. This marked a 0.40% decline over the past day.
Equally, the crypto’s trading volume dropped by 19.90% to $29.7 billion over the past 24 hours.
This market indecision and lack of clear trajectory has left market analysts seeing a further decline before a reversal. Inasmuch, popular Crypto analyst Ali Martinez a drop to its realized price citing its 200-day moving average
Market sentiment
According to his analysis, when Bitcoin trades above its 200-day moving average, it indicated strong returns. However, when it drops below this level, it sets the crypto for a sustained decline.
Source: Ali on X
Therefore, since it has traded below $64000, over the past month, it suggested a potential drop to its realized price of $31500.
In context, when BTC markets trade below the 200-day average, it’s said to be in a downtrend. While, when it trades above the 200-day moving average, it’s considered bullish.
Historically, when BTC falls below its 200-day moving average, prices tend to drop shortly after. First, during the 2016-2017 bull market, BTC fell below the 200-day SMA for three consecutive months.
During the 2018-2019 cycle, it fell below the 200-day MA in mid-2019 before COVID-19 disrupted the pattern. In August 2023, it fell below 200-day MA until October, which was accompanied by a price decline.
Recently, on the 4th of July, BTC dropped by 2% to trade at $57300 thus falling below its 200-day moving average of $58720.
However, when BTC breaks above this trendline prices tend to surge. For instance, in October 2023, when prices broke above the 200-day MA, BTC was trading at $28000.
A breakout from this trendline fueled expectations for ETFs thus paving the way for ATH at $73737. In July when it broke out from the trendline, its prices recovered to $70016.
What Bitcoin charts indicate
Undoubtedly, as Martinez posited, a drop below the 200-day MA indicated a decline, per historical data. But what do other indicators say?
Source: CryptoQuant
For starters, Bitcoin’s long-term holders SOPR has been on a declining channel since the 29th of August. The LTH SOPR has declined from 3.2 to 1.2, indicating bearish sentiment among long-term investors.
This implied they no longer expected BTC to recover, thus selling to avoid further losses.
Such market behavior results in selling pressure, driving prices down.
Source: CryptoQuant
Additionally, Bitcoin’s Fund Flow Ratio has declined over the past month, implying less capital inflow relative to overall trading volume.
This suggested that investors lacked confidence and they were not committing new funds. When investors close their positions, it results in selling pressure, which further pushes prices down.
Read Bitcoin’s [BTC] Price Prediction 2024–2025
Therefore, as Martinez posits, a drop below the 200-day MA implied further decline. Based on current market sentiment, BTC was positioned to decline to $54147 in the short term.
However, a breakout from this trendline will push prices up to $64727.


şişli elektrikçi SEO çalışmaları, web sitemizin performansını iyileştirdi. http://royalelektrik.com/
Simply desire to say your article is as surprising The clearness in your post is simply excellent and i could assume you are an expert on this subject Fine with your permission let me to grab your feed to keep up to date with forthcoming post Thanks a million and please carry on the gratifying work
can you buy generic clomid without rx can you get clomiphene for sale where to buy generic clomid pill where to buy cheap clomiphene no prescription where can i buy clomid pill get clomiphene prices how to buy cheap clomiphene tablets
I couldn’t weather commenting. Adequately written!
This is the make of delivery I unearth helpful.
how to buy azithromycin – purchase tinidazole buy metronidazole 400mg sale
buy generic motilium for sale – tetracycline 500mg usa purchase flexeril without prescription
augmentin 375mg tablet – atbioinfo ampicillin sale
coumadin 5mg over the counter – anticoagulant order hyzaar for sale
meloxicam price – mobo sin cost meloxicam 15mg
prednisone 20mg for sale – https://apreplson.com/ brand prednisone 5mg
cheapest ed pills online – https://fastedtotake.com/ the blue pill ed
how to buy amoxil – https://combamoxi.com/ buy amoxil online
buy diflucan no prescription – https://gpdifluca.com/# buy fluconazole generic
cost of cialis for daily use – ciltad gn generic tadalafil in us
ranitidine 150mg uk – this purchase ranitidine generic
what doe cialis look like – https://strongtadafl.com/# buy cialis online overnight delivery
buy viagra online to canada – https://strongvpls.com/ viagra cialis levitra buy online
Thanks on putting this up. It’s well done. https://ursxdol.com/cialis-tadalafil-20/
More delight pieces like this would insinuate the web better. buy azithromycin 500mg generic
With thanks. Loads of erudition! https://prohnrg.com/product/priligy-dapoxetine-pills/
With thanks. Loads of knowledge! https://ondactone.com/product/domperidone/
With thanks. Loads of erudition!
methotrexate 5mg cheap
More posts like this would prosper the blogosphere more useful. http://www.orlandogamers.org/forum/member.php?action=profile&uid=29108
buy forxiga online cheap – on this site dapagliflozin sale
order xenical online cheap – order orlistat online order orlistat
More posts like this would make the blogosphere more useful. http://www.cs-tygrysek.ugu.pl/member.php?action=profile&uid=98747