- The Delta Gradient revealed that Bitcoin’s potential decline could last one to two months.
- The fall in active addresses raises concerns about demand for BTC.
If Bitcoin’s [BTC] price action rhymes with historical patterns, then it is about to go lower than it has in the last few days. In short, this projected decline could last a month or two.
However, AMBCrypto did not make this conclusion without the necessary data In this article, we will break it down. One of the top metrics that aligns with this prediction is the Delta Gradient.
South is the way
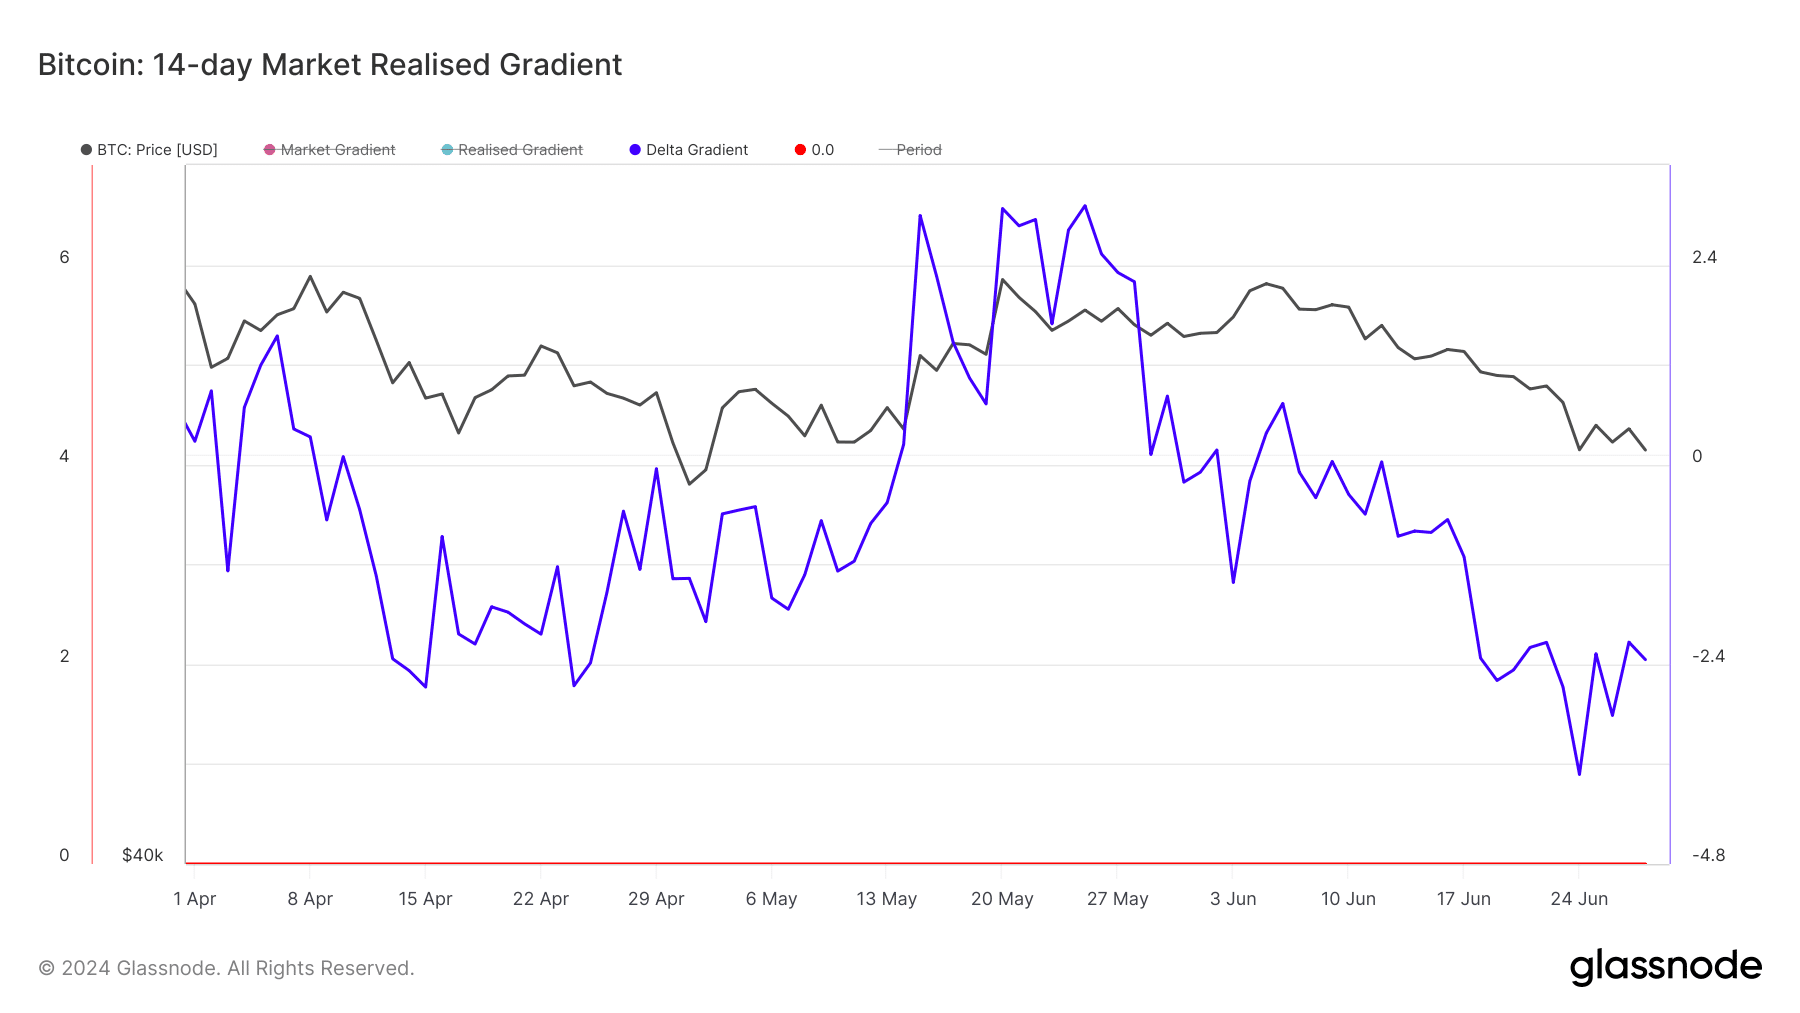
For those unfamiliar, the Delta Gradient measures the relative change in momentum against the true organic capital of a cryptocurrency.
When the gradient is positive, an uptrend appears. Most times, this uptrend lasts 28 to 60 days.
At press time, Bitcoin’s downtrend was -2.34. This negative reading implies that the price might continue to undergo a downtrend. Also, this projected downtrend could last a similar duration.

Source: Glassnode
As of this writing, BTC changed hands at $61,062. This was a 4.96% decrease in the last seven days. Should the Delta Gradient continue to drop, then Bitcoin’s price might fall below $60,000 like it did some days back.
This was also in tune with Bitcoin’s reaction to the period the Realized Price rose above the spot value. Furthermore, we examined the Network Realized Profit/Loss.
Mixed signals appear on the charts
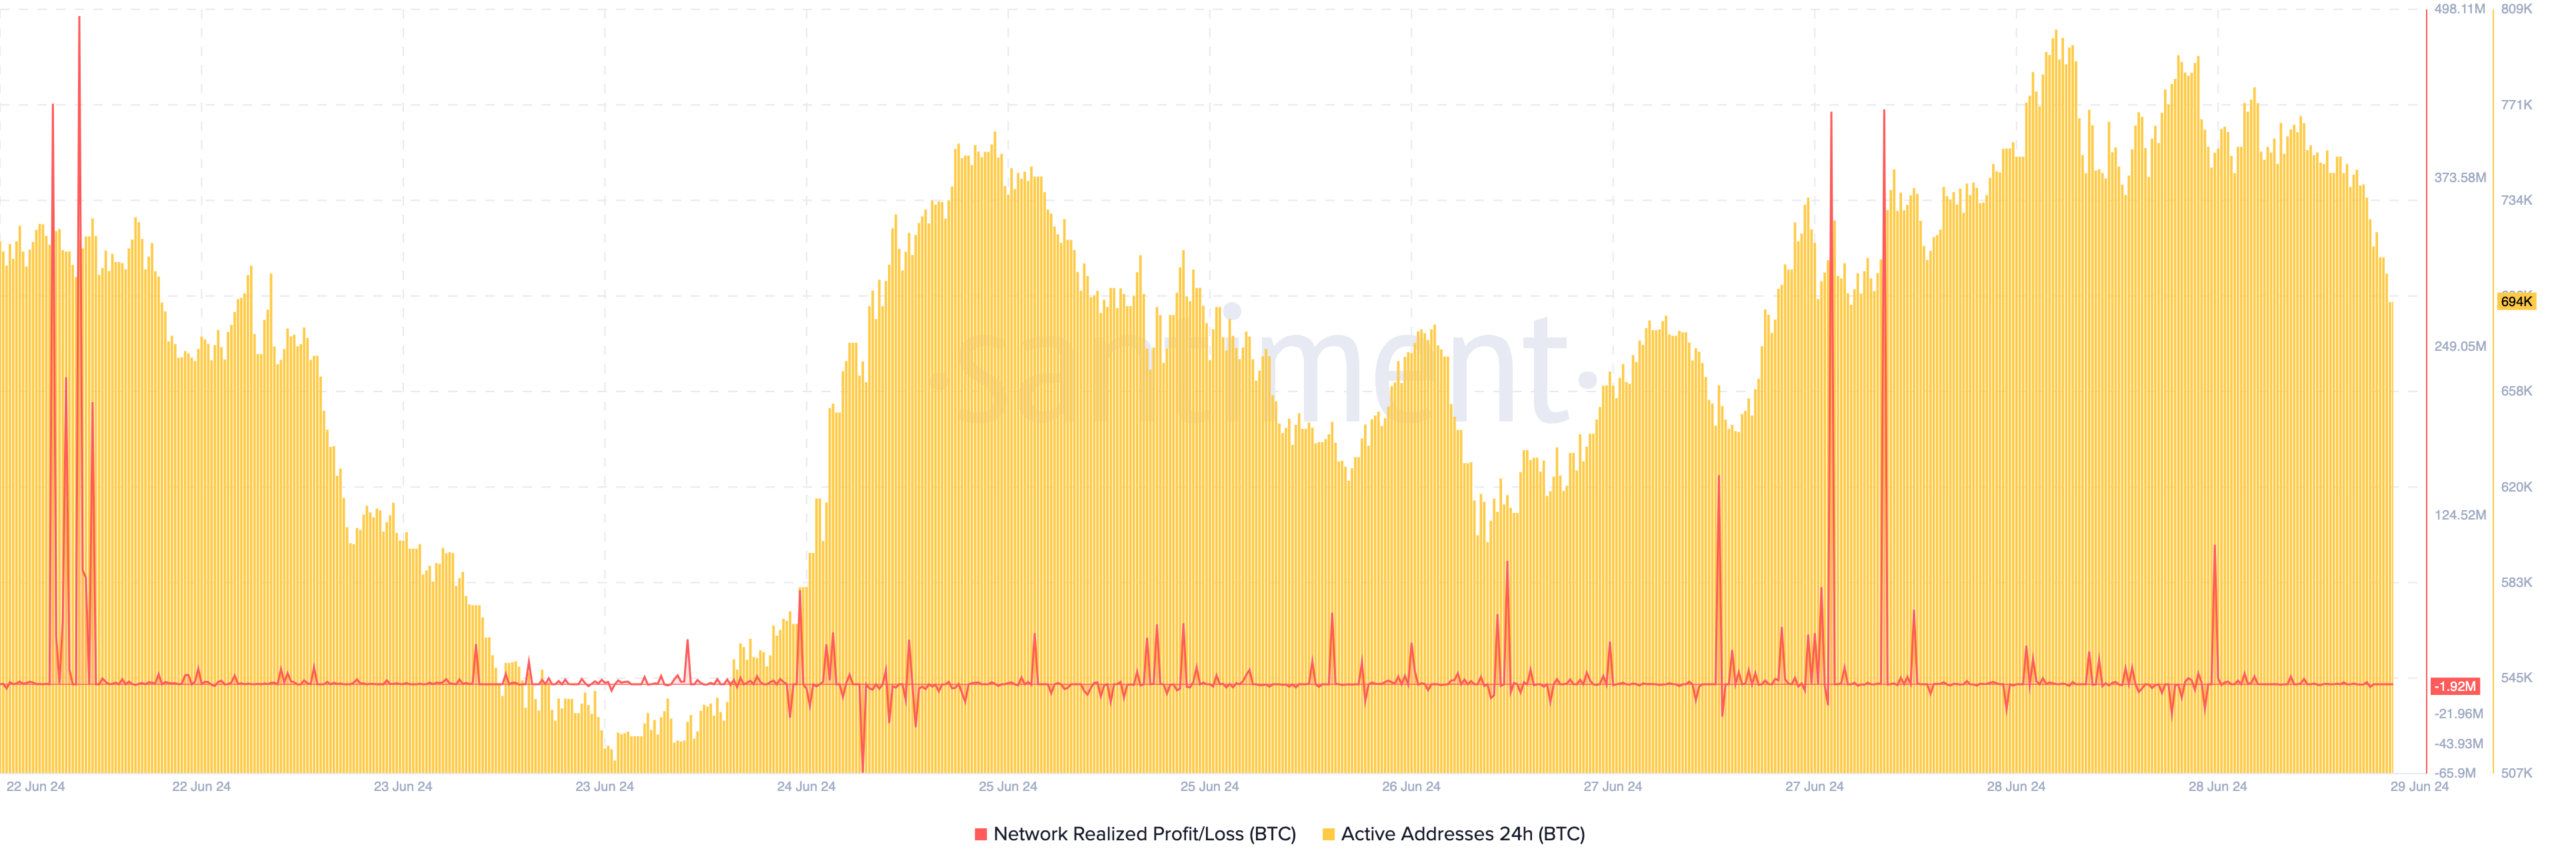
This metric shows the value of transactions that have realized a profit or loss in recent time. A positive reading of the metric implies that profit-taking is high. As such, this could cause prices to fall.
However, if the metric is negative, it implies that there has been a surge in realized losses. If it is intense, price may begin to climb. According to Santiment, Bitcoin’s Network Realized Profit/Loss was -1.92 million.
This implied that a chunk of the transactions on-chain ended in losses.
Typically, this decline is expected to foreshadow a price increase. But that might not be the case due to the dwindling activity on Bitcoin’s network.
At press time, the 24-hour Active Addresses was down to 694,000. A few days ago, it was almost one million. Active addresses is a measure of user activity.

Source: Santiment
Thus, when it decreases as it has done in recent times, it means that market participants are not interacting with BTC at a high level. Consequently, this could lead to a notable decline in demand for the coin
Realistic or not, here’s BTC’s market cap in ETH terms
Should demand continue to decrease, so will the price. However, analyst Michael van de Poppe opined that BTC’s correction might soon be over.
According to him, the recently concluded week was good for the coin. He said,
“A pretty decent weekly candle for Bitcoin is approaching here. I would expect the correction to be relatively over. We didn’t get the most obvious deep corrections in previous cycles either.”
- The Delta Gradient revealed that Bitcoin’s potential decline could last one to two months.
- The fall in active addresses raises concerns about demand for BTC.
If Bitcoin’s [BTC] price action rhymes with historical patterns, then it is about to go lower than it has in the last few days. In short, this projected decline could last a month or two.
However, AMBCrypto did not make this conclusion without the necessary data In this article, we will break it down. One of the top metrics that aligns with this prediction is the Delta Gradient.
South is the way
For those unfamiliar, the Delta Gradient measures the relative change in momentum against the true organic capital of a cryptocurrency.
When the gradient is positive, an uptrend appears. Most times, this uptrend lasts 28 to 60 days.
At press time, Bitcoin’s downtrend was -2.34. This negative reading implies that the price might continue to undergo a downtrend. Also, this projected downtrend could last a similar duration.

Source: Glassnode
As of this writing, BTC changed hands at $61,062. This was a 4.96% decrease in the last seven days. Should the Delta Gradient continue to drop, then Bitcoin’s price might fall below $60,000 like it did some days back.
This was also in tune with Bitcoin’s reaction to the period the Realized Price rose above the spot value. Furthermore, we examined the Network Realized Profit/Loss.
Mixed signals appear on the charts
This metric shows the value of transactions that have realized a profit or loss in recent time. A positive reading of the metric implies that profit-taking is high. As such, this could cause prices to fall.
However, if the metric is negative, it implies that there has been a surge in realized losses. If it is intense, price may begin to climb. According to Santiment, Bitcoin’s Network Realized Profit/Loss was -1.92 million.
This implied that a chunk of the transactions on-chain ended in losses.
Typically, this decline is expected to foreshadow a price increase. But that might not be the case due to the dwindling activity on Bitcoin’s network.
At press time, the 24-hour Active Addresses was down to 694,000. A few days ago, it was almost one million. Active addresses is a measure of user activity.

Source: Santiment
Thus, when it decreases as it has done in recent times, it means that market participants are not interacting with BTC at a high level. Consequently, this could lead to a notable decline in demand for the coin
Realistic or not, here’s BTC’s market cap in ETH terms
Should demand continue to decrease, so will the price. However, analyst Michael van de Poppe opined that BTC’s correction might soon be over.
According to him, the recently concluded week was good for the coin. He said,
“A pretty decent weekly candle for Bitcoin is approaching here. I would expect the correction to be relatively over. We didn’t get the most obvious deep corrections in previous cycles either.”


where to get clomid pill cost cheap clomiphene for sale where can i get cheap clomid pill where can i get generic clomid no prescription can i order cheap clomiphene for sale generic clomid where to get generic clomiphene
With thanks. Loads of knowledge!
More posts like this would persuade the online play more useful.
buy zithromax 500mg online cheap – sumycin pill buy metronidazole 400mg online
purchase semaglutide generic – buy rybelsus pill cyproheptadine 4mg canada
domperidone usa – cheap sumycin 250mg flexeril usa
propranolol drug – methotrexate over the counter order methotrexate online cheap
zithromax 500mg uk – buy tindamax 300mg pills buy nebivolol 20mg pills
buy cheap generic augmentin – atbioinfo.com purchase ampicillin pills
buy generic esomeprazole over the counter – nexium to us buy generic nexium online
order generic coumadin 2mg – https://coumamide.com/ buy cheap cozaar
mobic sale – tenderness buy meloxicam tablets
order deltasone generic – arthritis deltasone 20mg drug
can you buy ed pills online – fast ed to take site cheap ed drugs
buy amoxil pills for sale – https://combamoxi.com/ cheap amoxicillin pill
diflucan 200mg us – on this site diflucan 200mg canada
cialis high blood pressure – https://ciltadgn.com/ what are the side effects of cialis
tadalafil online canadian pharmacy – this where can i buy cialis over the counter
purchase zantac for sale – click order ranitidine pills
herbal viagra sale uk – buy viagra malaysia online viagra pfizer 100 mg online
This is the compassionate of writing I rightly appreciate. comprar fildena 100
I’ll certainly bring back to skim more. https://buyfastonl.com/furosemide.html
More posts like this would prosper the blogosphere more useful. https://ursxdol.com/levitra-vardenafil-online/
This is the make of delivery I find helpful. online
This is the kind of literature I in fact appreciate. https://aranitidine.com/fr/acheter-propecia-en-ligne/
This is the big-hearted of criticism I positively appreciate. https://ondactone.com/simvastatin/