- Bitcoin surged by 7.96% over the past week.
- Market fundamentals suggested that Bitcoin could experience a market correction soon.
As expected, Bitcoin [BTC] has experienced a strong October. While the month started on a low note, the crypto has made significant gains outweighing the previous losses.
Since hitting a low of $58867, BTC has made a strong upswing reaching July levels of $69k.
In fact, as of this writing, Bitcoin was trading at $69028.This marked a 7.96% over the past week, with the crypto gaining 9.52% on monthly charts.
The recent upsurge has left analysts both optimistic and pessimistic in equal measures. For instance, CryptoQuant analyst Burak Kesmeci suggested that Bitcoin might see a market correction, citing the NVT golden cross.
Market sentiment
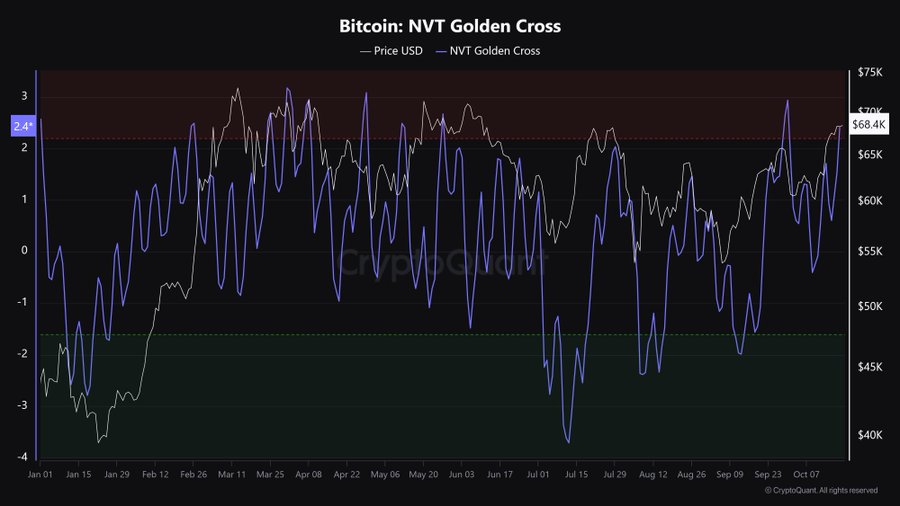
In his analysis, Kesmeci posited that Bitcoin’s NVT Golden Cross has entered a hot zone in the short term.

Source: X
According to him, the market will eventually experience correction before attempting another uptrend.
For the uninitiated, the NVT Golden Cross reaching the hot zone suggests that BTC is currently higher than what its network activity justifies.
Thus, it has become overvalued relative to the amount of value being transferred on the blockchain.
This suggests a potential overbought condition where price growth is not supported by the fundamental usage of the network.
These conditions often precede a price correction, where the market adjusts and brings the price back to align with the network fundamentals.
Based on this analogy, Bitcoin will experience a pullback in the near term.
What BTC’s charts say
As observed by Kesmeci, the current fundamentals don’t support a sustained rally and could drop to meet the demand.
Therefore, the question is, how sustainable is the current rally, and what do market indicators suggest?

Source: CryptoQuant
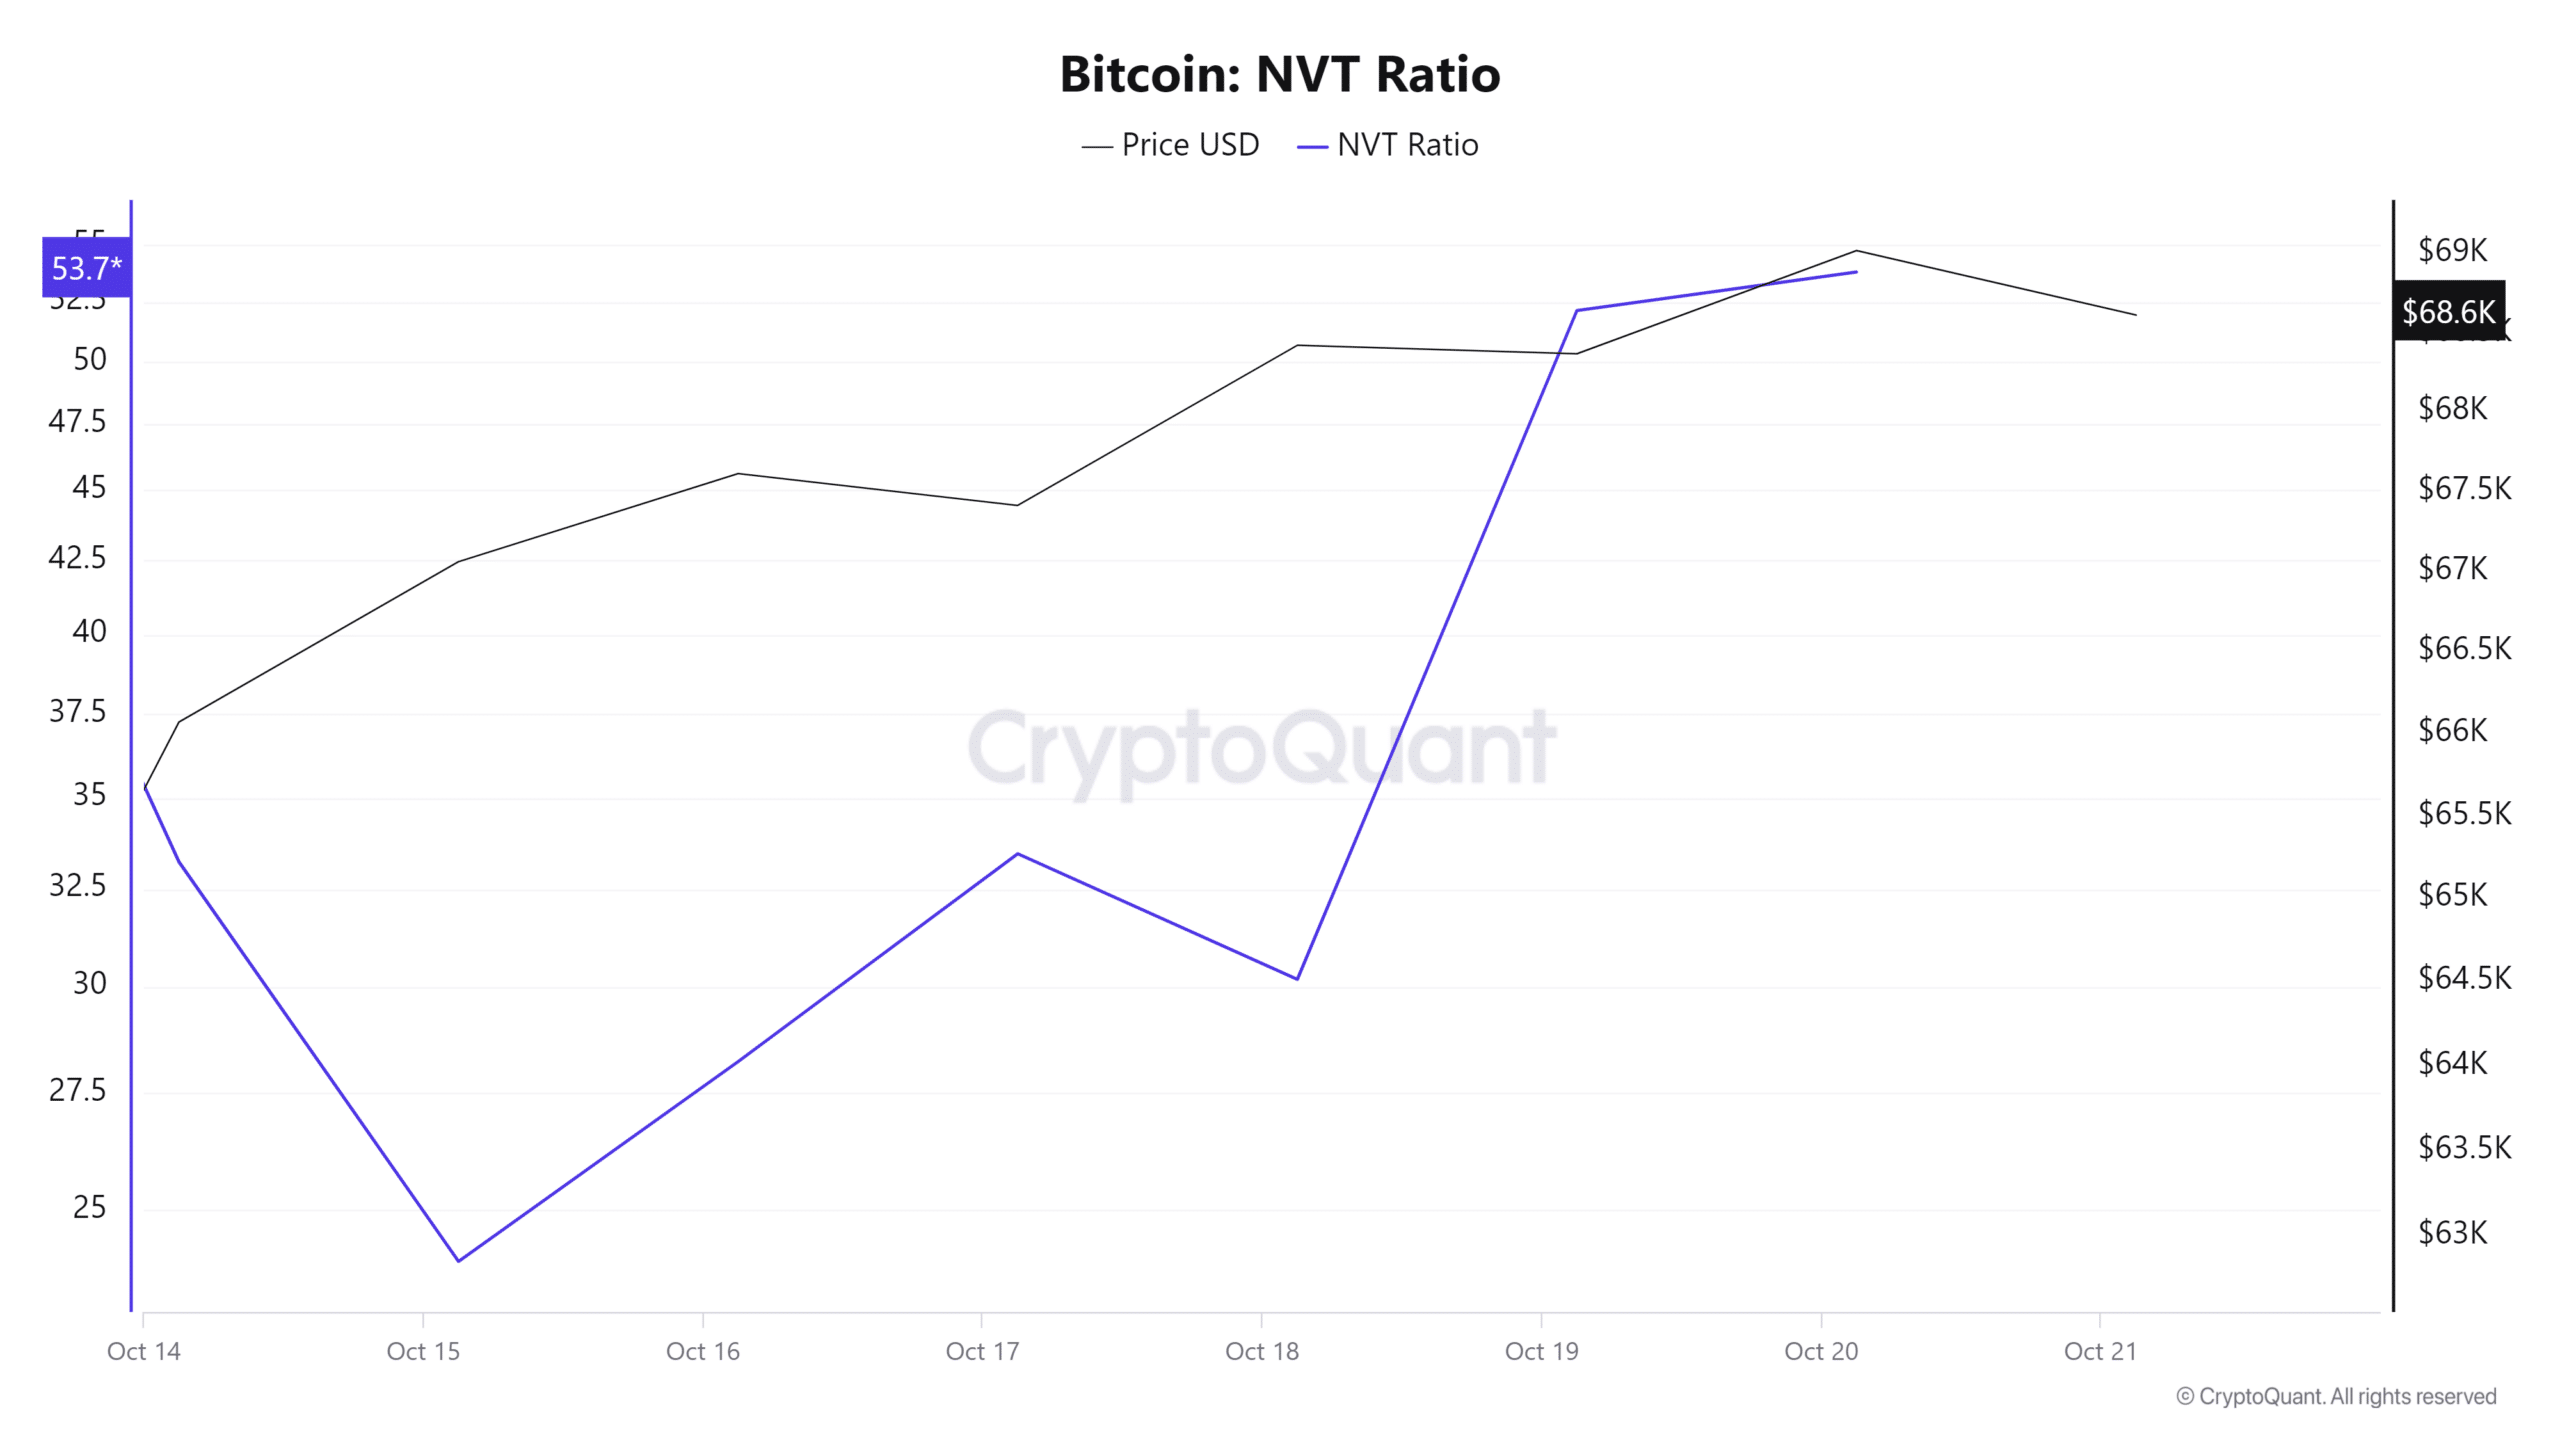
The first indicator to consider is Bitcoin’s NVT Ratio, which measures network value to transaction.
According to CryptoQuant, the NVT ratio has been rising over the past week. This increase implies that BTC is overvalued compared to actual utility and network activity, thus prices are unsustainably high.

Source: CryptoQuant
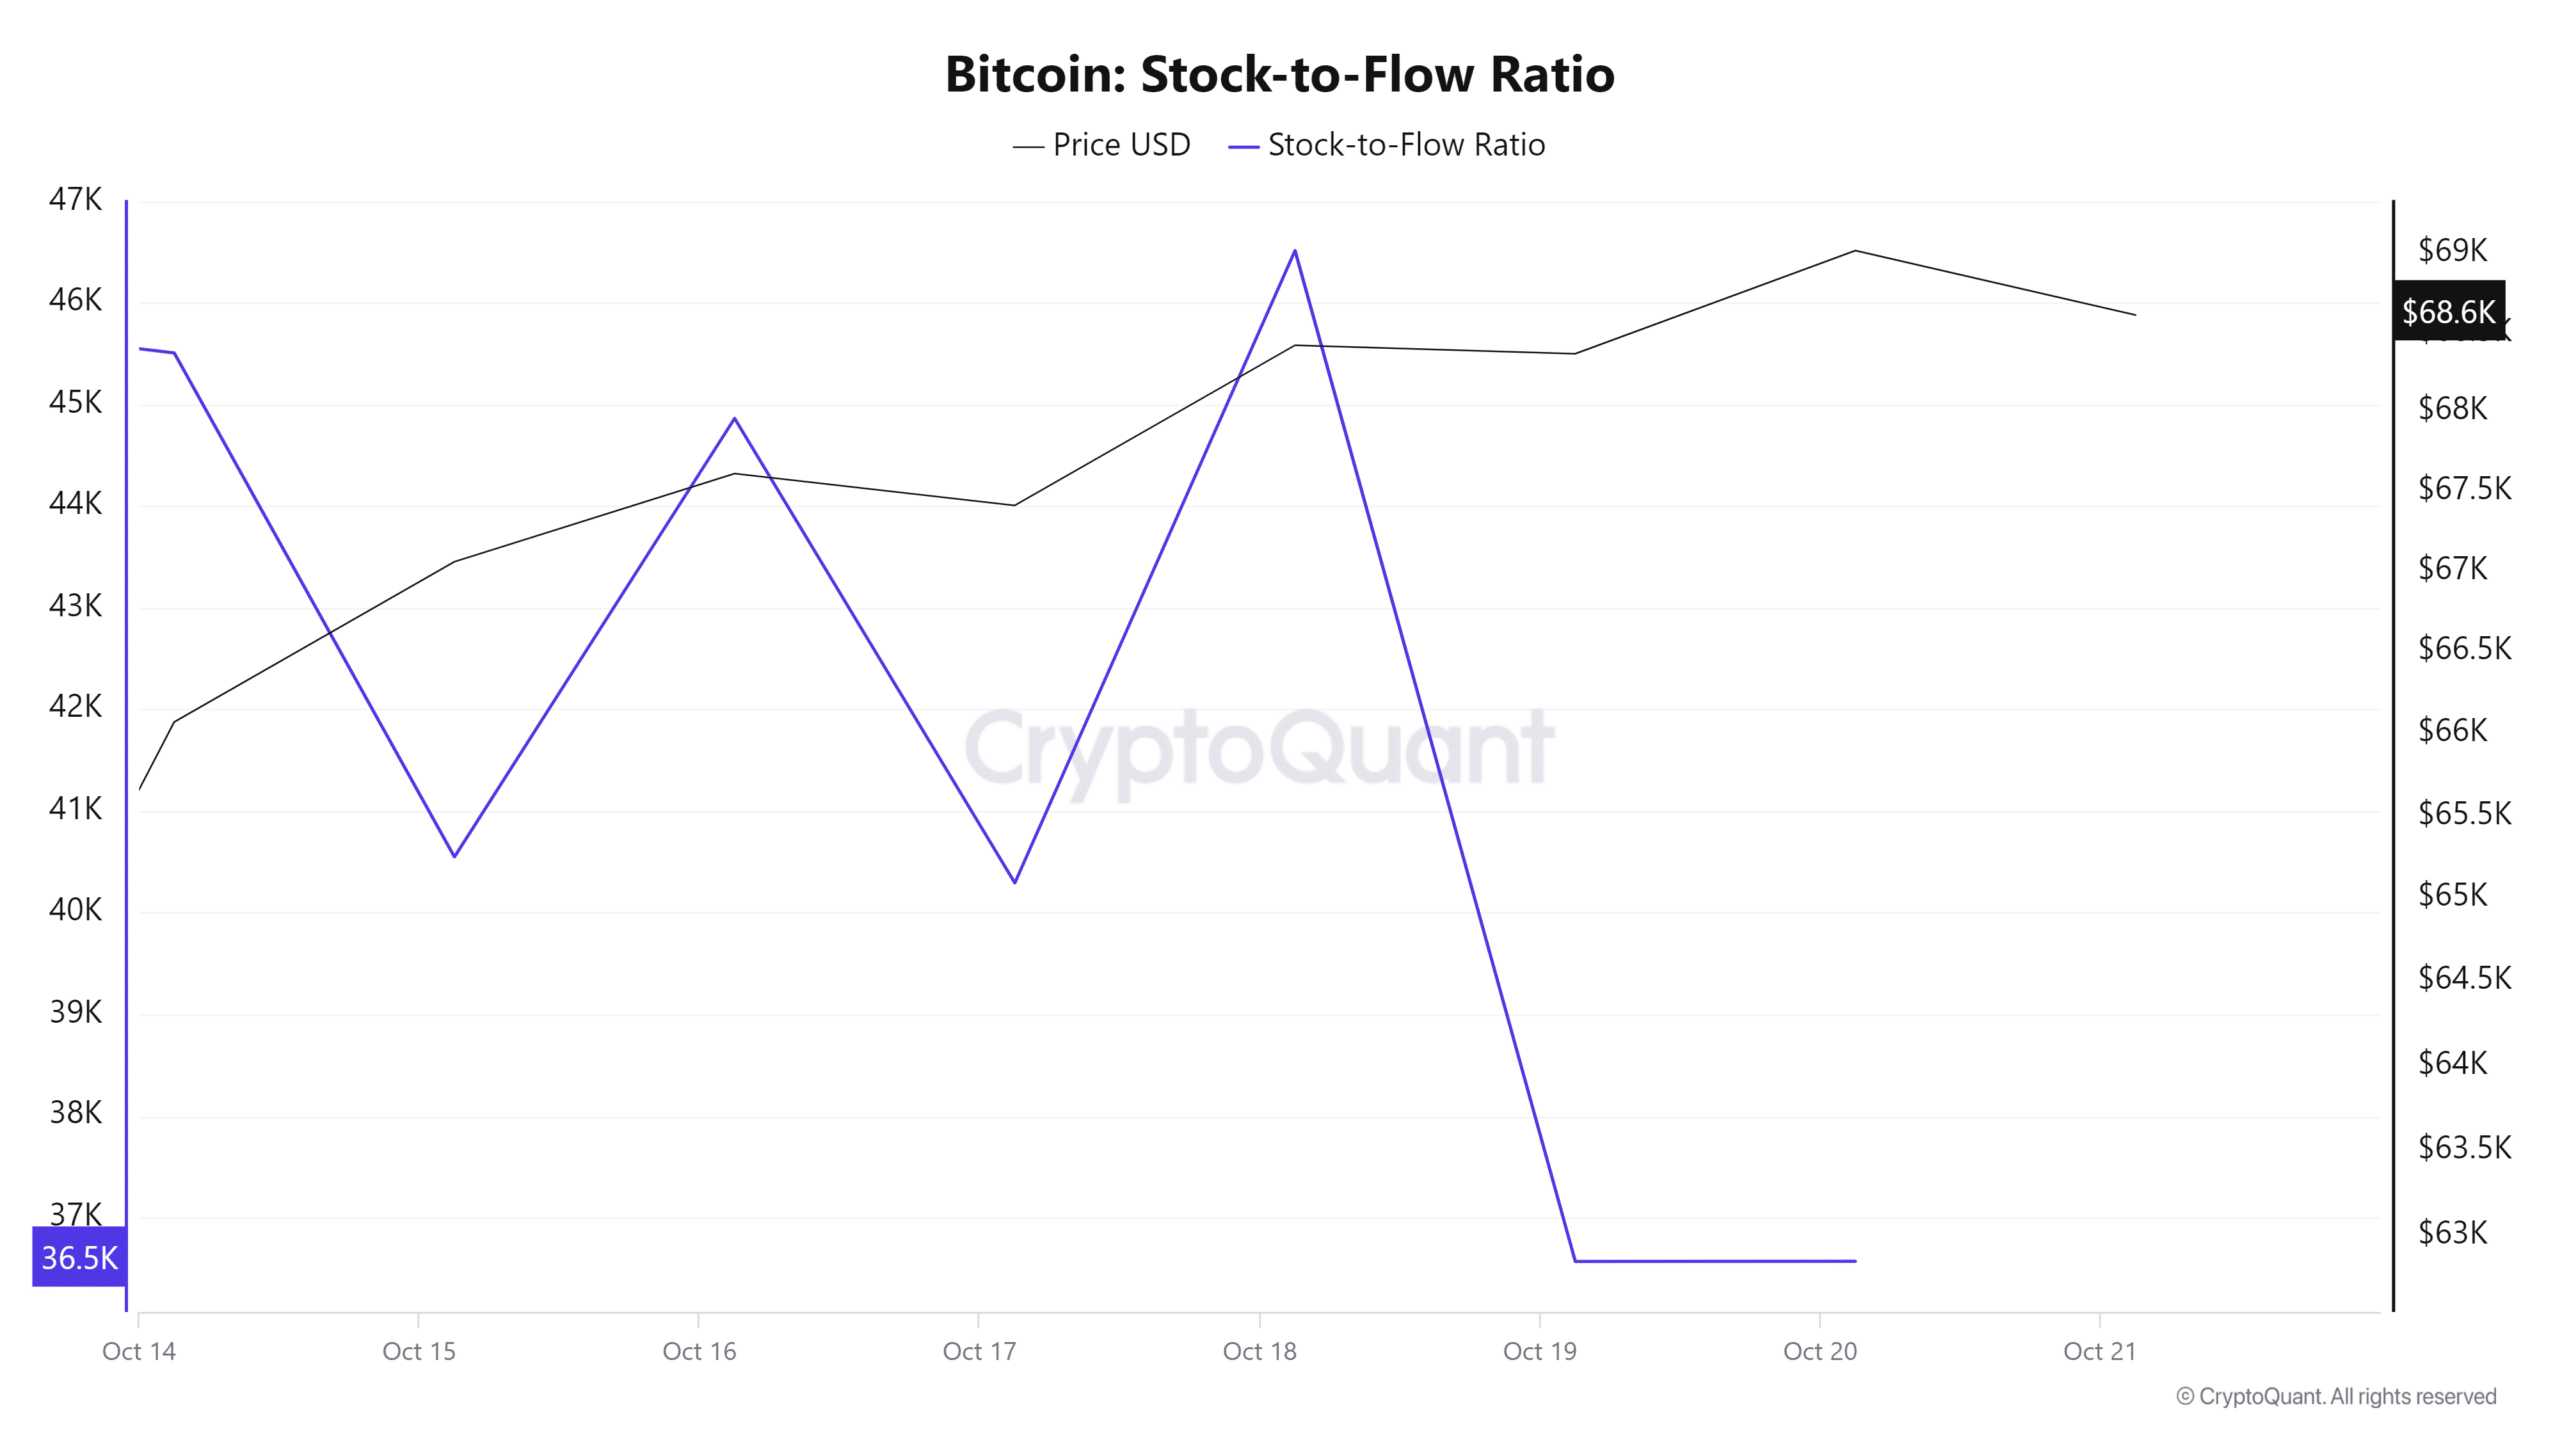
Additionally, Bitcoin’s Stock-to-Flow Ratio has declined over the past week, suggesting a rise in supply. The increased availability of BTC tends to turn the market into bearish, especially if the demand is not growing.

Source: Santiment
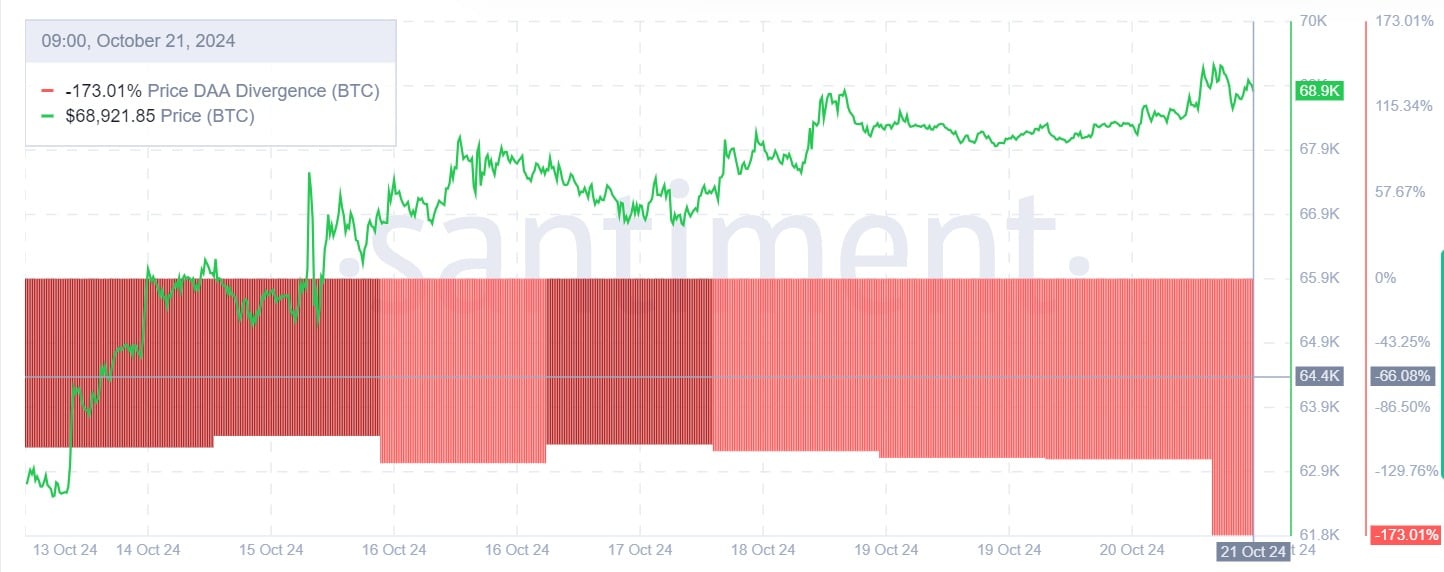
Finally, Bitcoin’s Price DAA divergence has remained negative throughout the past week. This indicates that there’s an unsustainable price increase.
When the Price DAA is negative, it suggests the current rally is driven by speculation or short-term demand.
Read Bitcoin’s [BTC] Price Prediction 2024 – 2025
Simply put, although BTC has surged to a recent high, the market fundamentals suggest a correction is imminent. As such, the current rally is mostly driven by speculation and not supported by demand.
A correction will see Bitcoin drop to the $65872 support level.
- Bitcoin surged by 7.96% over the past week.
- Market fundamentals suggested that Bitcoin could experience a market correction soon.
As expected, Bitcoin [BTC] has experienced a strong October. While the month started on a low note, the crypto has made significant gains outweighing the previous losses.
Since hitting a low of $58867, BTC has made a strong upswing reaching July levels of $69k.
In fact, as of this writing, Bitcoin was trading at $69028.This marked a 7.96% over the past week, with the crypto gaining 9.52% on monthly charts.
The recent upsurge has left analysts both optimistic and pessimistic in equal measures. For instance, CryptoQuant analyst Burak Kesmeci suggested that Bitcoin might see a market correction, citing the NVT golden cross.
Market sentiment
In his analysis, Kesmeci posited that Bitcoin’s NVT Golden Cross has entered a hot zone in the short term.

Source: X
According to him, the market will eventually experience correction before attempting another uptrend.
For the uninitiated, the NVT Golden Cross reaching the hot zone suggests that BTC is currently higher than what its network activity justifies.
Thus, it has become overvalued relative to the amount of value being transferred on the blockchain.
This suggests a potential overbought condition where price growth is not supported by the fundamental usage of the network.
These conditions often precede a price correction, where the market adjusts and brings the price back to align with the network fundamentals.
Based on this analogy, Bitcoin will experience a pullback in the near term.
What BTC’s charts say
As observed by Kesmeci, the current fundamentals don’t support a sustained rally and could drop to meet the demand.
Therefore, the question is, how sustainable is the current rally, and what do market indicators suggest?

Source: CryptoQuant
The first indicator to consider is Bitcoin’s NVT Ratio, which measures network value to transaction.
According to CryptoQuant, the NVT ratio has been rising over the past week. This increase implies that BTC is overvalued compared to actual utility and network activity, thus prices are unsustainably high.

Source: CryptoQuant
Additionally, Bitcoin’s Stock-to-Flow Ratio has declined over the past week, suggesting a rise in supply. The increased availability of BTC tends to turn the market into bearish, especially if the demand is not growing.

Source: Santiment
Finally, Bitcoin’s Price DAA divergence has remained negative throughout the past week. This indicates that there’s an unsustainable price increase.
When the Price DAA is negative, it suggests the current rally is driven by speculation or short-term demand.
Read Bitcoin’s [BTC] Price Prediction 2024 – 2025
Simply put, although BTC has surged to a recent high, the market fundamentals suggest a correction is imminent. As such, the current rally is mostly driven by speculation and not supported by demand.
A correction will see Bitcoin drop to the $65872 support level.


clomid price cvs clomiphene tablets clomiphene other name where buy clomiphene pill cost of clomiphene tablets where to get cheap clomid tablets clomid reddit
I am in fact enchant‚e ‘ to gleam at this blog posts which consists of tons of worthwhile facts, thanks towards providing such data.
I couldn’t resist commenting. Profoundly written!
brand azithromycin 500mg – buy ciprofloxacin 500mg without prescription buy metronidazole 200mg pill
cost rybelsus – order rybelsus 14 mg sale purchase periactin
purchase motilium without prescription – tetracycline pills buy generic cyclobenzaprine
order inderal 10mg online cheap – plavix 75mg oral methotrexate 2.5mg tablet
amoxil oral – cheap amoxicillin sale combivent uk
buy amoxiclav without prescription – atbioinfo.com ampicillin oral
order warfarin 5mg online cheap – https://coumamide.com/ cozaar cost
buy meloxicam pills for sale – https://moboxsin.com/ mobic oral
order deltasone 20mg online cheap – https://apreplson.com/ prednisone 5mg tablet
otc ed pills – https://fastedtotake.com/ cheap erectile dysfunction
amoxicillin tablets – combamoxi.com purchase amoxil pills
diflucan pills – click buy diflucan cheap
buy escitalopram tablets – cost lexapro lexapro over the counter
order cenforce 100mg pill – buy cenforce 50mg for sale cenforce canada
cialis price comparison no prescription – site mint pharmaceuticals tadalafil
cialis canada prices – cialis liquid for sale cialis canada free sample
how to get zantac without a prescription – aranitidine buy generic zantac 300mg
viagra buy online canada – https://strongvpls.com/# sildenafil 50 mg precio
This is a topic which is in to my heart… Diverse thanks! Exactly where can I upon the contact details in the course of questions? this
This is the gentle of criticism I positively appreciate. https://buyfastonl.com/
I’ll certainly bring back to skim more. https://ursxdol.com/furosemide-diuretic/
Thanks on putting this up. It’s understandably done. https://prohnrg.com/product/diltiazem-online/
Thanks on sharing. It’s first quality. https://aranitidine.com/fr/acheter-fildena/
This is the amicable of serenity I have reading. https://ondactone.com/product/domperidone/
I couldn’t resist commenting. Well written!
spironolactone oral
More posts like this would persuade the online time more useful. http://whois.hostsir.com/?domain=https://www.instapaper.com/p/adip&act=refresh
The thoroughness in this section is noteworthy. http://www.underworldralinwood.ca/forums/member.php?action=profile&uid=487598
forxiga 10 mg us – https://janozin.com/ dapagliflozin buy online
buy generic xenical for sale – orlistat drug buy orlistat pills
More articles like this would frame the blogosphere richer. http://zqykj.com/bbs/home.php?mod=space&uid=303470