- Bitcoin’s price remained over $65,000 amid a decline in retail investor activity.
- Current on-chain data suggested a lack of short-term holder activity, indicating potential for future market movements.
Bitcoin [BTC] was currently trading at $65,524, maintaining a position above $65,000. Despite this, the cryptocurrency has seen a consistent downward trend.
According to data from CoinMarketCap, Bitcoin has dropped 7.9% over the past two weeks and continues to decline, slipping an additional 0.1% in the last 24 hours. What other things are behind this price action?
Lack of usual retail boost
An insightful analysis from a CryptoQuant analyst highlighted a significant absence in the Bitcoin market: the retail investors.
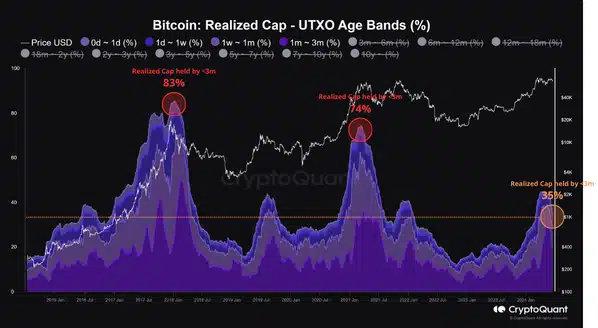
Historically, the presence of new entrants and speculators, typically holding their coins for less than three months, has been a hallmark of Bitcoin’s cycle peaks.
The analyst noted,
“A central characteristic of BTC cycle tops is the dominance of coins with a holding period of less than 3 months. Historically, this indicates that long-term holders (smart money) have already taken their profits, leaving the market under the control of speculators and new entrants, resulting in a more volatile market structure.”
However, the current market cycle deviates from previous ones primarily due to the low participation of these short-term holders.
Data indicated that only about 35% of Bitcoin’s realized cap was currently held by this group, significantly lower than the over 70% seen at peak market times in past cycles.
Source: CryptoQuant
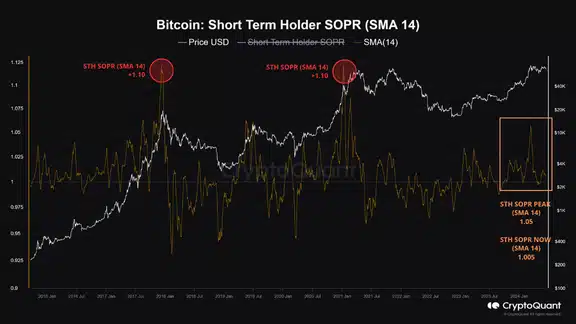
Additionally, the Spent Output Profit Ratio (SOPR) for these holders remained relatively subdued, further indicating that the market was not at a speculative peak.
According to the analyst, this suggested that we were still in the earlier stages of a bull market, not near the “peak euphoria” that typically preceded a major sell-off.
Source: CryptoQuant
The analyst added:
“The predominance of long-term holders in the market forms a more solid price support base. This robust structure and the relative scarcity of short-term holders make an immediate transition to a bear market less likely, indicating that there is still potential for a significant rally before the cycle top formation.”
Bitcoin: Technical perspective
To validate the assertion that the retail crowd is notably absent from the Bitcoin market, an examination of Bitcoin’s on-chain fundamentals was quite revealing.
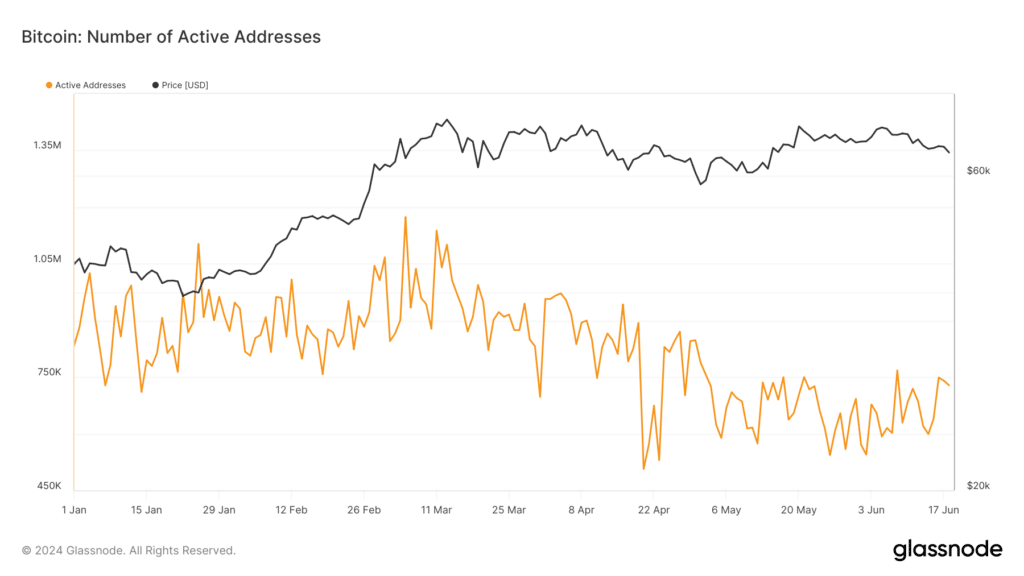
Glassnode’s data showed a decline in the number of active Bitcoin addresses; from a high of over 1 million in March, this number has fallen below 800k and has remained at that for the past month.
Source: Glassnode
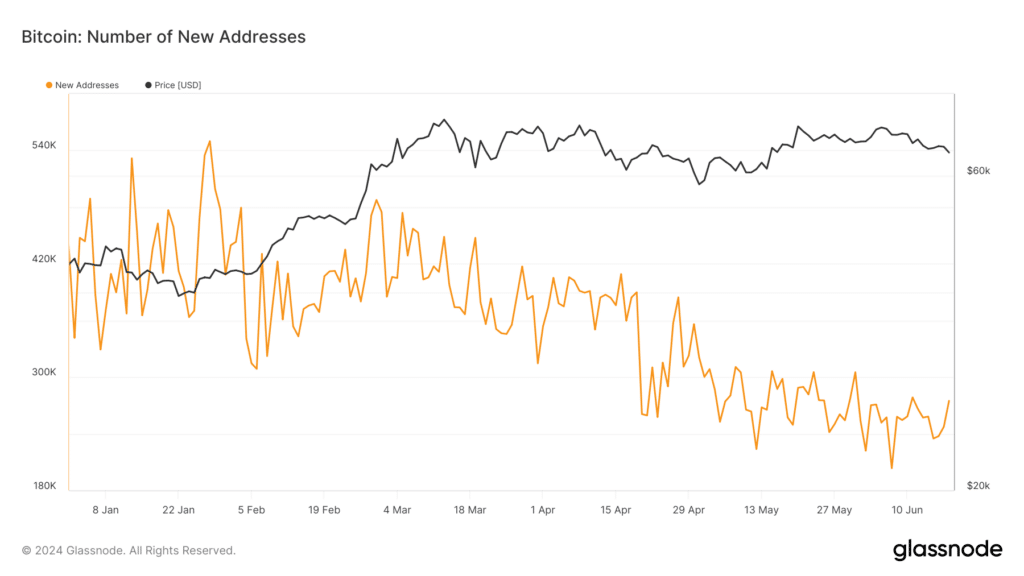
Additionally, the creation of new Bitcoin addresses has also diminished, dropping from over 500,000 in January to under 300,000 at press time.
Source: Glassnode
This reduction in active and new addresses lent support to the notion that retail investors are less engaged, as heightened activity in these metrics typically signifies increased retail participation.
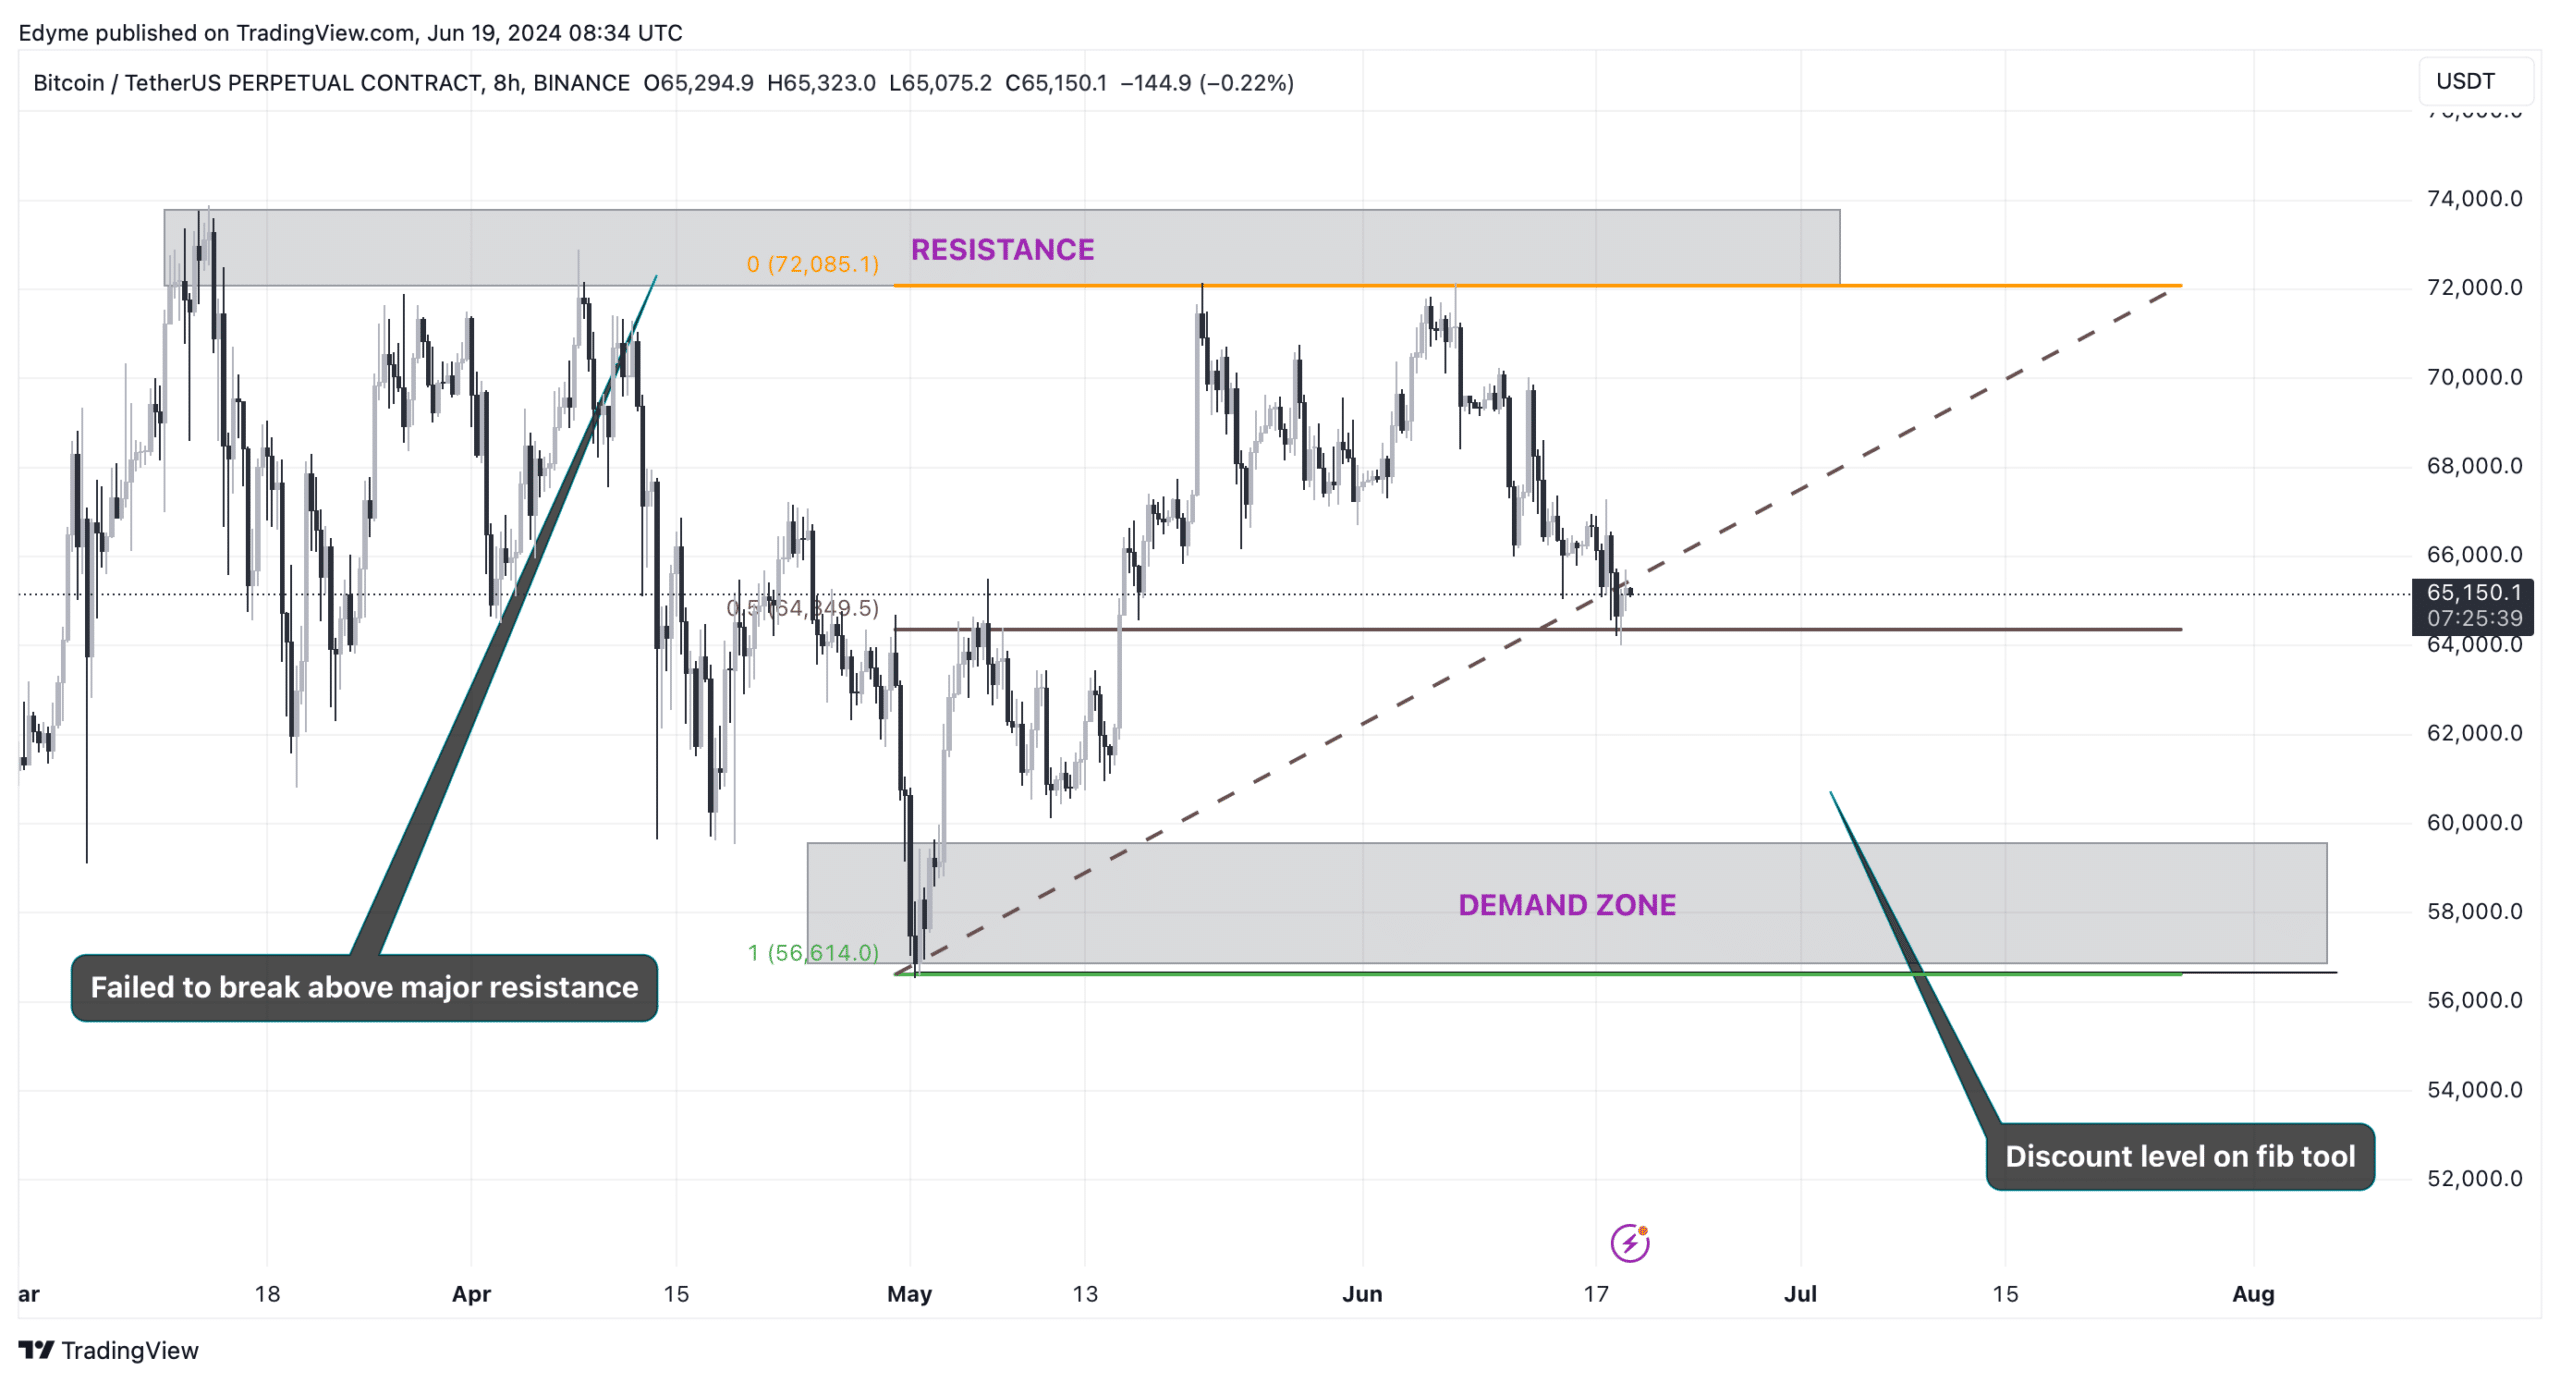
Shifting from fundamentals to technical analysis, Bitcoin was showing signs of a downtrend, having failed to overcome major resistance levels on the daily chart.
The cryptocurrency was expected to continue this downward trajectory until it reaches a key demand zone, potentially driving a price rebound.
Source: TradingView
Upon applying a Fibonacci tool to Bitcoin’s 8-hour chart, this demand zone appeared to reside within the $60,000 to $56,500 price range.
Read Bitcoin’s [BTC] Price Prediction 2024-2025
If technical indicators hold true, Bitcoin could further decline to this discount zone, setting the stage for a possible recovery as demand intensifies at these lower price levels.
This analysis coincides with AMBCrypto’s recent report Bitcoin price is expected to be punished by the miners until the hashrate improves.
- Bitcoin’s price remained over $65,000 amid a decline in retail investor activity.
- Current on-chain data suggested a lack of short-term holder activity, indicating potential for future market movements.
Bitcoin [BTC] was currently trading at $65,524, maintaining a position above $65,000. Despite this, the cryptocurrency has seen a consistent downward trend.
According to data from CoinMarketCap, Bitcoin has dropped 7.9% over the past two weeks and continues to decline, slipping an additional 0.1% in the last 24 hours. What other things are behind this price action?
Lack of usual retail boost
An insightful analysis from a CryptoQuant analyst highlighted a significant absence in the Bitcoin market: the retail investors.
Historically, the presence of new entrants and speculators, typically holding their coins for less than three months, has been a hallmark of Bitcoin’s cycle peaks.
The analyst noted,
“A central characteristic of BTC cycle tops is the dominance of coins with a holding period of less than 3 months. Historically, this indicates that long-term holders (smart money) have already taken their profits, leaving the market under the control of speculators and new entrants, resulting in a more volatile market structure.”
However, the current market cycle deviates from previous ones primarily due to the low participation of these short-term holders.
Data indicated that only about 35% of Bitcoin’s realized cap was currently held by this group, significantly lower than the over 70% seen at peak market times in past cycles.

Source: CryptoQuant
Additionally, the Spent Output Profit Ratio (SOPR) for these holders remained relatively subdued, further indicating that the market was not at a speculative peak.
According to the analyst, this suggested that we were still in the earlier stages of a bull market, not near the “peak euphoria” that typically preceded a major sell-off.

Source: CryptoQuant
The analyst added:
“The predominance of long-term holders in the market forms a more solid price support base. This robust structure and the relative scarcity of short-term holders make an immediate transition to a bear market less likely, indicating that there is still potential for a significant rally before the cycle top formation.”
Bitcoin: Technical perspective
To validate the assertion that the retail crowd is notably absent from the Bitcoin market, an examination of Bitcoin’s on-chain fundamentals was quite revealing.
Glassnode’s data showed a decline in the number of active Bitcoin addresses; from a high of over 1 million in March, this number has fallen below 800k and has remained at that for the past month.

Source: Glassnode
Additionally, the creation of new Bitcoin addresses has also diminished, dropping from over 500,000 in January to under 300,000 at press time.

Source: Glassnode
This reduction in active and new addresses lent support to the notion that retail investors are less engaged, as heightened activity in these metrics typically signifies increased retail participation.
Shifting from fundamentals to technical analysis, Bitcoin was showing signs of a downtrend, having failed to overcome major resistance levels on the daily chart.
The cryptocurrency was expected to continue this downward trajectory until it reaches a key demand zone, potentially driving a price rebound.

Source: TradingView
Upon applying a Fibonacci tool to Bitcoin’s 8-hour chart, this demand zone appeared to reside within the $60,000 to $56,500 price range.
Read Bitcoin’s [BTC] Price Prediction 2024-2025
If technical indicators hold true, Bitcoin could further decline to this discount zone, setting the stage for a possible recovery as demand intensifies at these lower price levels.
This analysis coincides with AMBCrypto’s recent report Bitcoin price is expected to be punished by the miners until the hashrate improves.


buy generic clomiphene without dr prescription clomid contraindications where can i buy generic clomiphene pill buying cheap clomiphene without prescription cost of cheap clomid prices can i purchase cheap clomid for sale can i get cheap clomiphene tablets
More articles like this would pretence of the blogosphere richer.
azithromycin 250mg drug – ciprofloxacin uk order flagyl pill
buy domperidone without a prescription – flexeril 15mg tablet cyclobenzaprine medication
inderal 20mg pills – purchase clopidogrel for sale order methotrexate 2.5mg generic
purchase augmentin pill – atbioinfo buy ampicillin paypal
esomeprazole 40mg usa – https://anexamate.com/ order esomeprazole 20mg without prescription
buy warfarin tablets – coumamide cost cozaar
mobic 7.5mg oral – tenderness buy mobic 7.5mg
deltasone sale – https://apreplson.com/ generic deltasone 10mg
best erection pills – fastedtotake.com buy ed pills cheap
buy amoxil generic – combamoxi.com buy amoxil online
fluconazole order – buy generic forcan online forcan ca
buy lexapro pill – https://escitapro.com/ buy escitalopram 10mg pill
order cenforce 100mg online cheap – cenforce 100mg oral cenforce us
generic cialis – https://ciltadgn.com/# tamsulosin vs. tadalafil
cialis manufacturer coupon free trial – strongtadafl cialis erection
buy zantac 300mg pill – this zantac 300mg cheap
order genuine viagra – https://strongvpls.com/# 100 milligram viagra
I am in fact happy to coup d’oeil at this blog posts which consists of tons of of use facts, thanks object of providing such data. on this site
The depth in this ruined is exceptional. https://buyfastonl.com/isotretinoin.html
This is a theme which is forthcoming to my fundamentals… Numberless thanks! Unerringly where can I notice the acquaintance details due to the fact that questions? https://ursxdol.com/azithromycin-pill-online/
The sagacity in this serving is exceptional. https://prohnrg.com/product/get-allopurinol-pills/
More articles like this would remedy the blogosphere richer. stromectol sans ordonnance
With thanks. Loads of expertise! https://ondactone.com/product/domperidone/
I couldn’t hold back commenting. Well written!
clopidogrel over the counter
buy forxiga 10mg without prescription – https://janozin.com/# buy forxiga no prescription
purchase orlistat generic – click order orlistat 60mg online cheap