- Investors were showing confidence in BTC as they continued to buy.
- Ethereum ETFs also witnessed major netflows on the 7th of November.
The United States election result stirred up several economic sectors across the globe, and crypto was not left out. The entire crypto market witnessed price upticks, including the king of cryptos, Bitcoin [BTC]. Not only did BTC’s price increase, it also registered record buying in ETFs.
Bitcoin ETFs hit new record
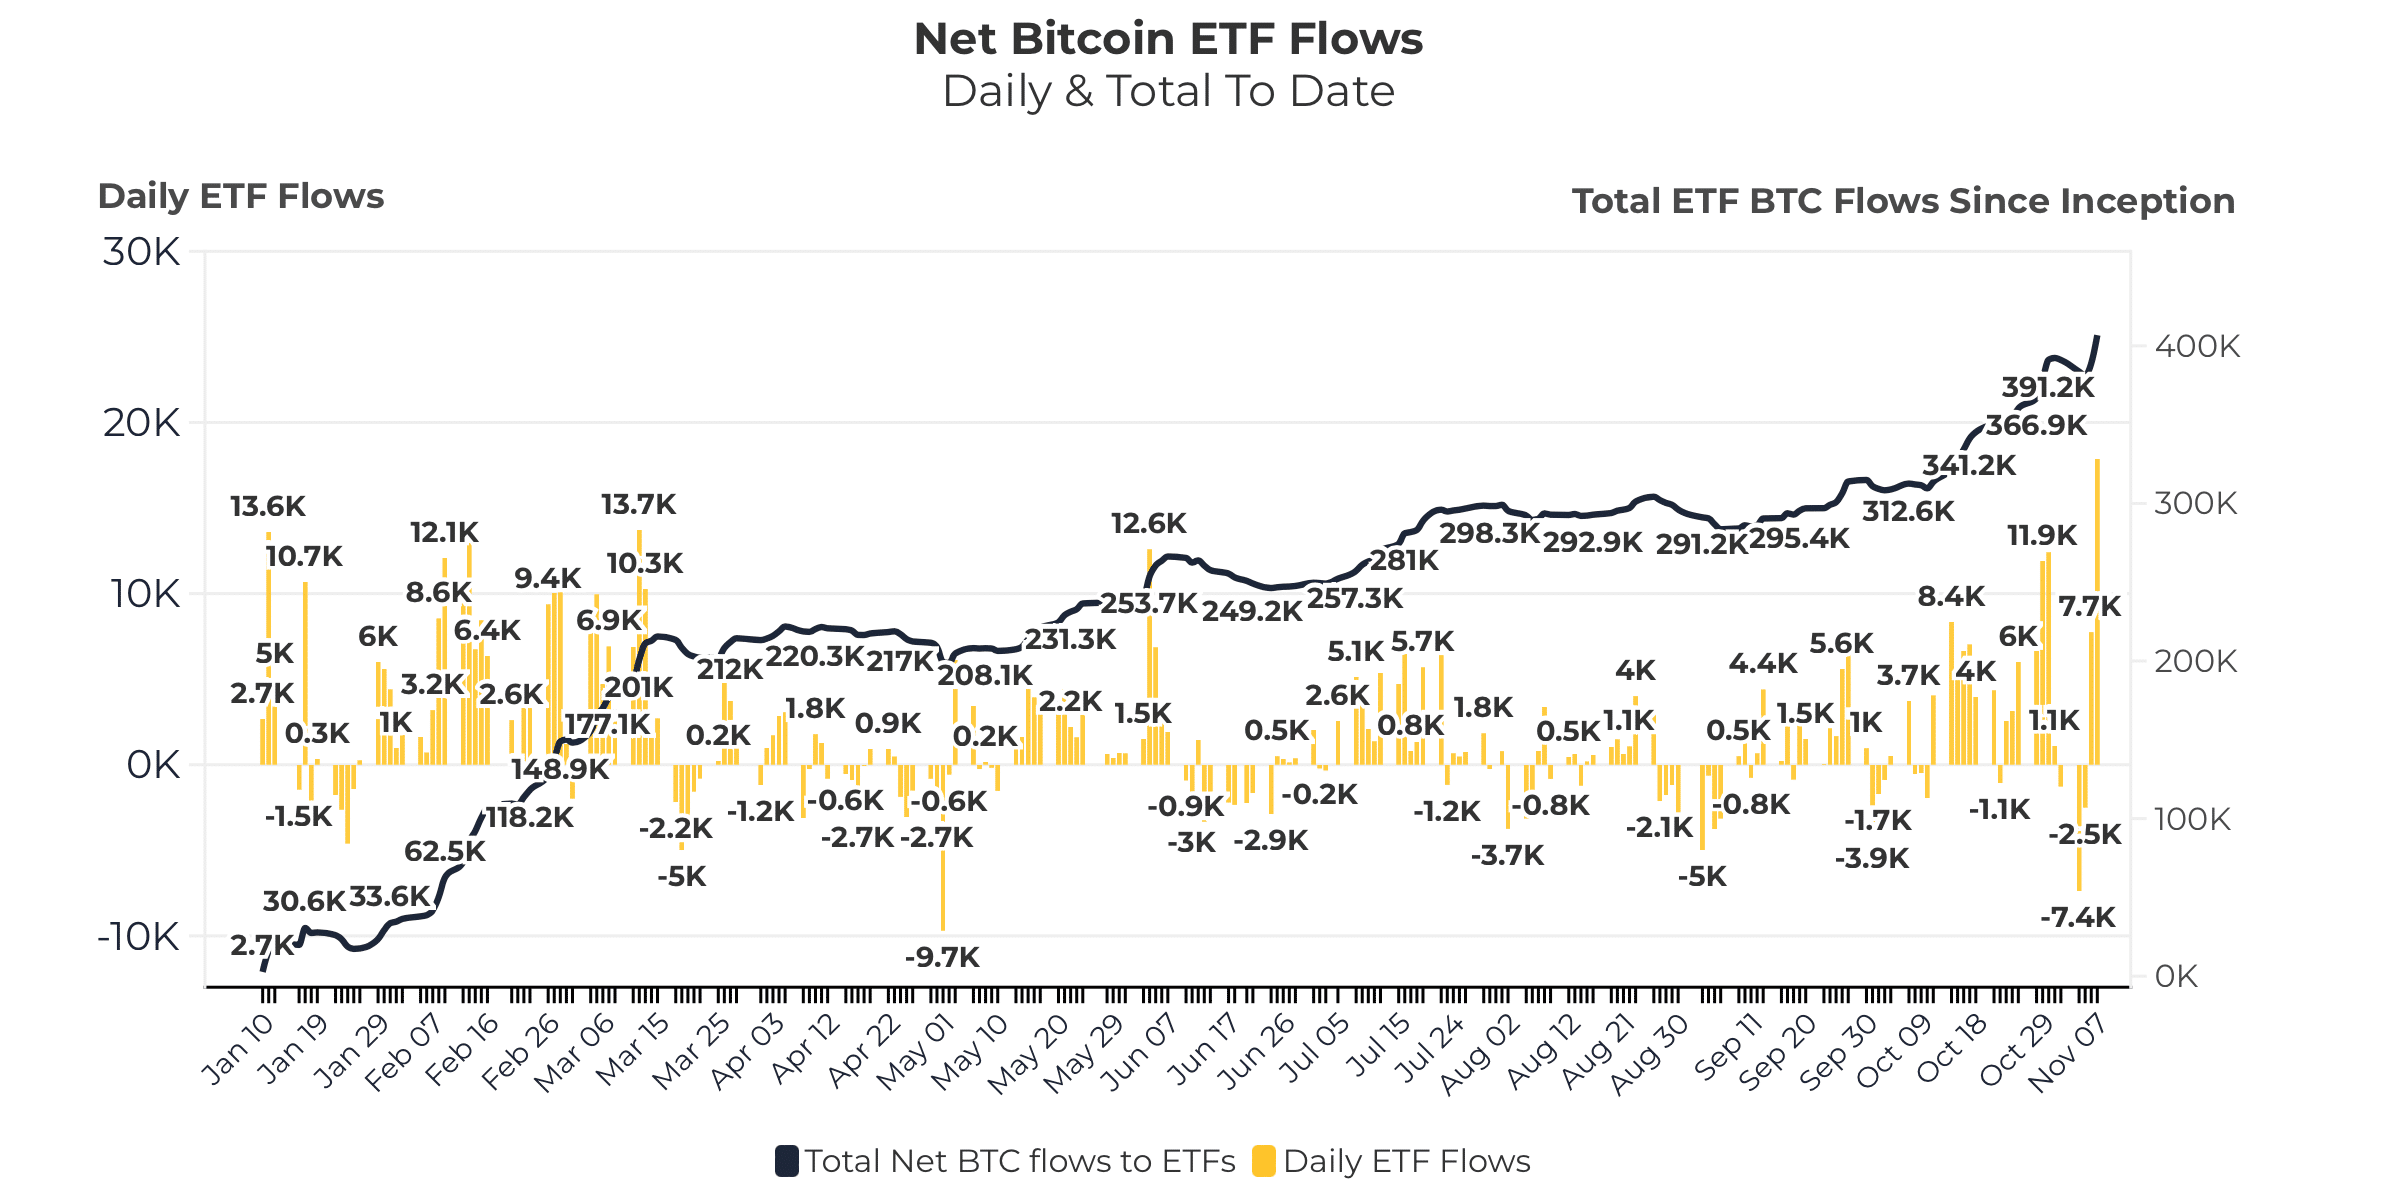
CRYPTOBIRD, a popular crypto analyst, recently posted a tweet revealing a major development related to BTC ETFs. As per the tweet, a record of over 17k BTC was bought in the recent past. To be precise, a total of 406k BTC netflows have been registered till the 7th of November.
On the same day alone, ETFs witnessed over 17.9k in netflows, which was the highest. Notable, this came days after the U.S. presidential elections.
Source: Heyapollo
This massive rise in ETF netflows clearly suggested that the overall market was confident in the king coin. If this trend is to be believed, BTC’s upcoming days could be even better in terms of its price action.
At press time, BTC’s price had risen by nearly 10% in the past seven days and was trading at $75.89k, near its all-time high.
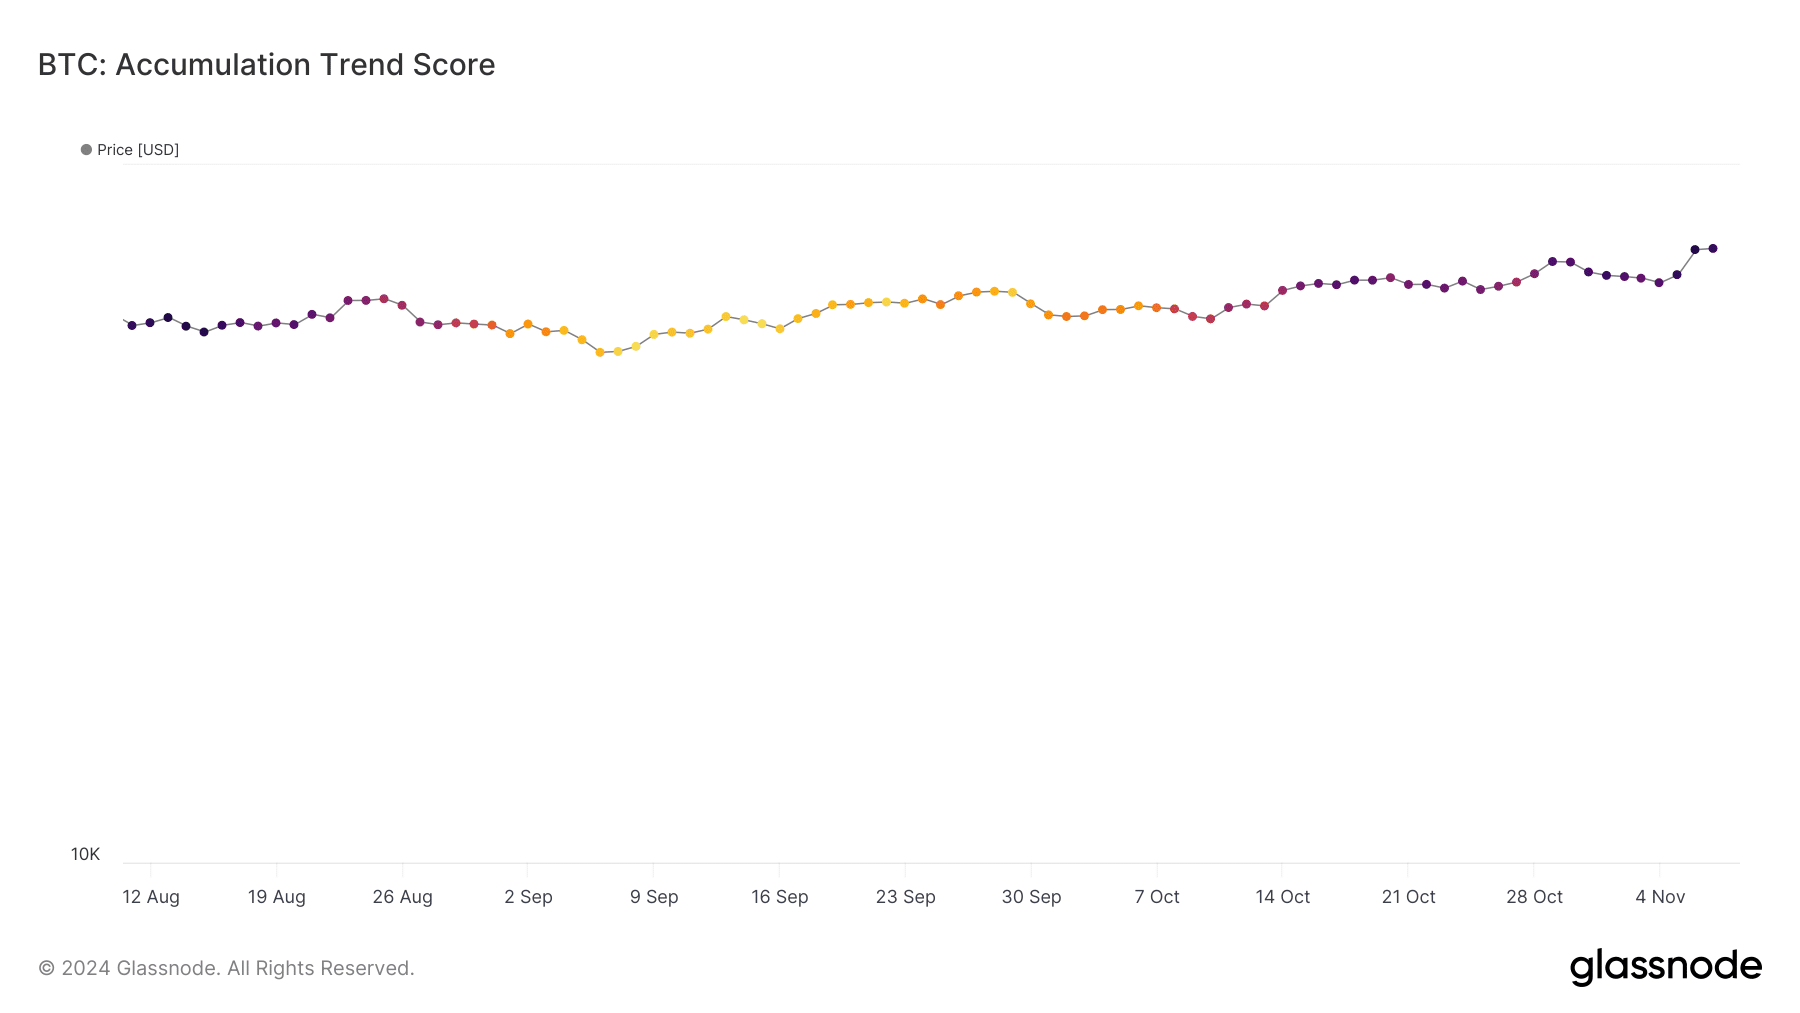
We then checked other datasets to find out whether buying pressure was high in the overall market. Our analysis of Glassnode’s data revealed that BTC’s accumulation trend score jumped from 0.04 to 0.8 within a month.
For starters, the indicator reflects the relative size of entities that are actively accumulating coins on-chain in terms of their BTC holdings. A number closer to 1 indicates more buying pressure, which can be inferred as a bullish signal.
Source: Glassnode
How is Ethereum coping?
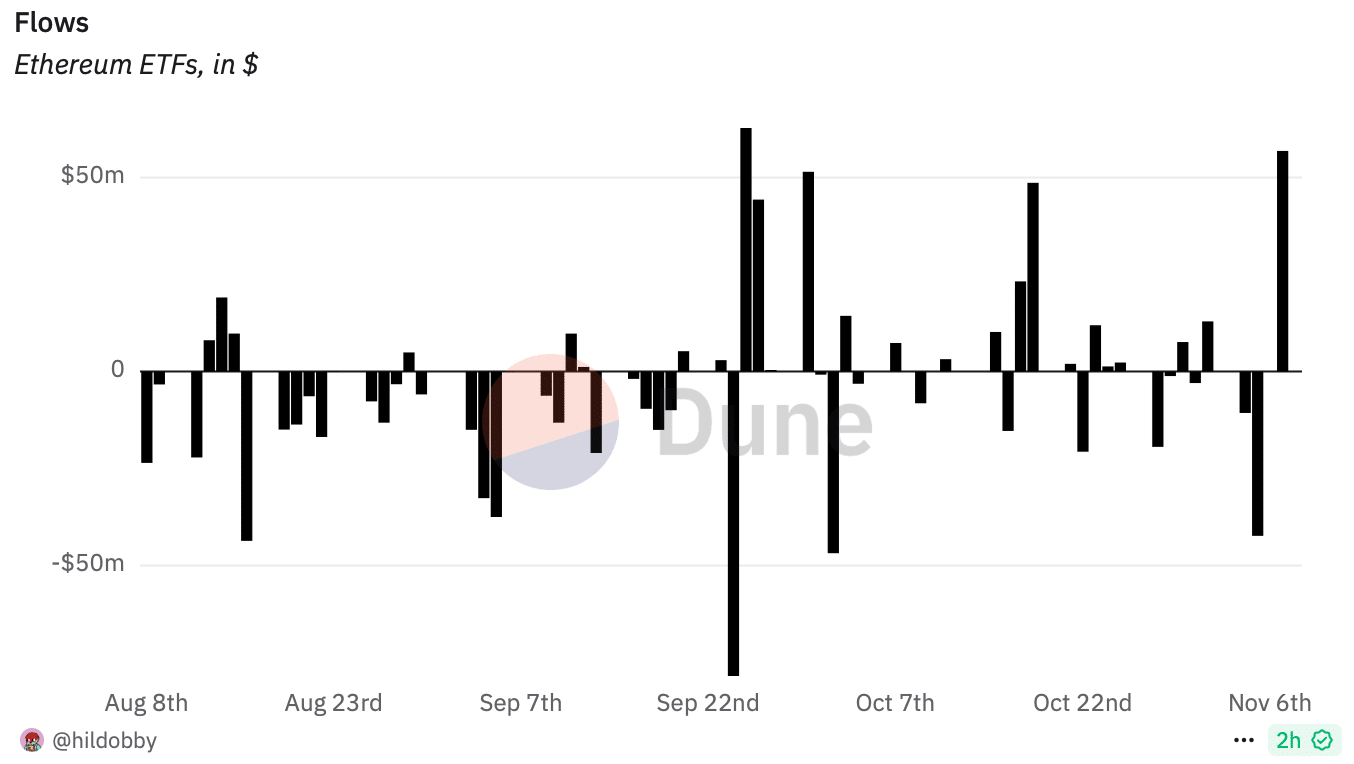
Since Bitcoin ETF netflows reached record highs, AMBCrypto then took a look at Ethereum [ETH] ETFs’ state. Our analysis of Dune’s data pointed out that ETH ETF netflows exceeded $56 million on the 7th of November.
This was one of the largest inflows since the inception of ETH ETFs, which was commendable.
Source: Dune
Therefore, we checked both BTC and ETH’s daily charts to see whether this newfound interest will translate into continued price hikes.
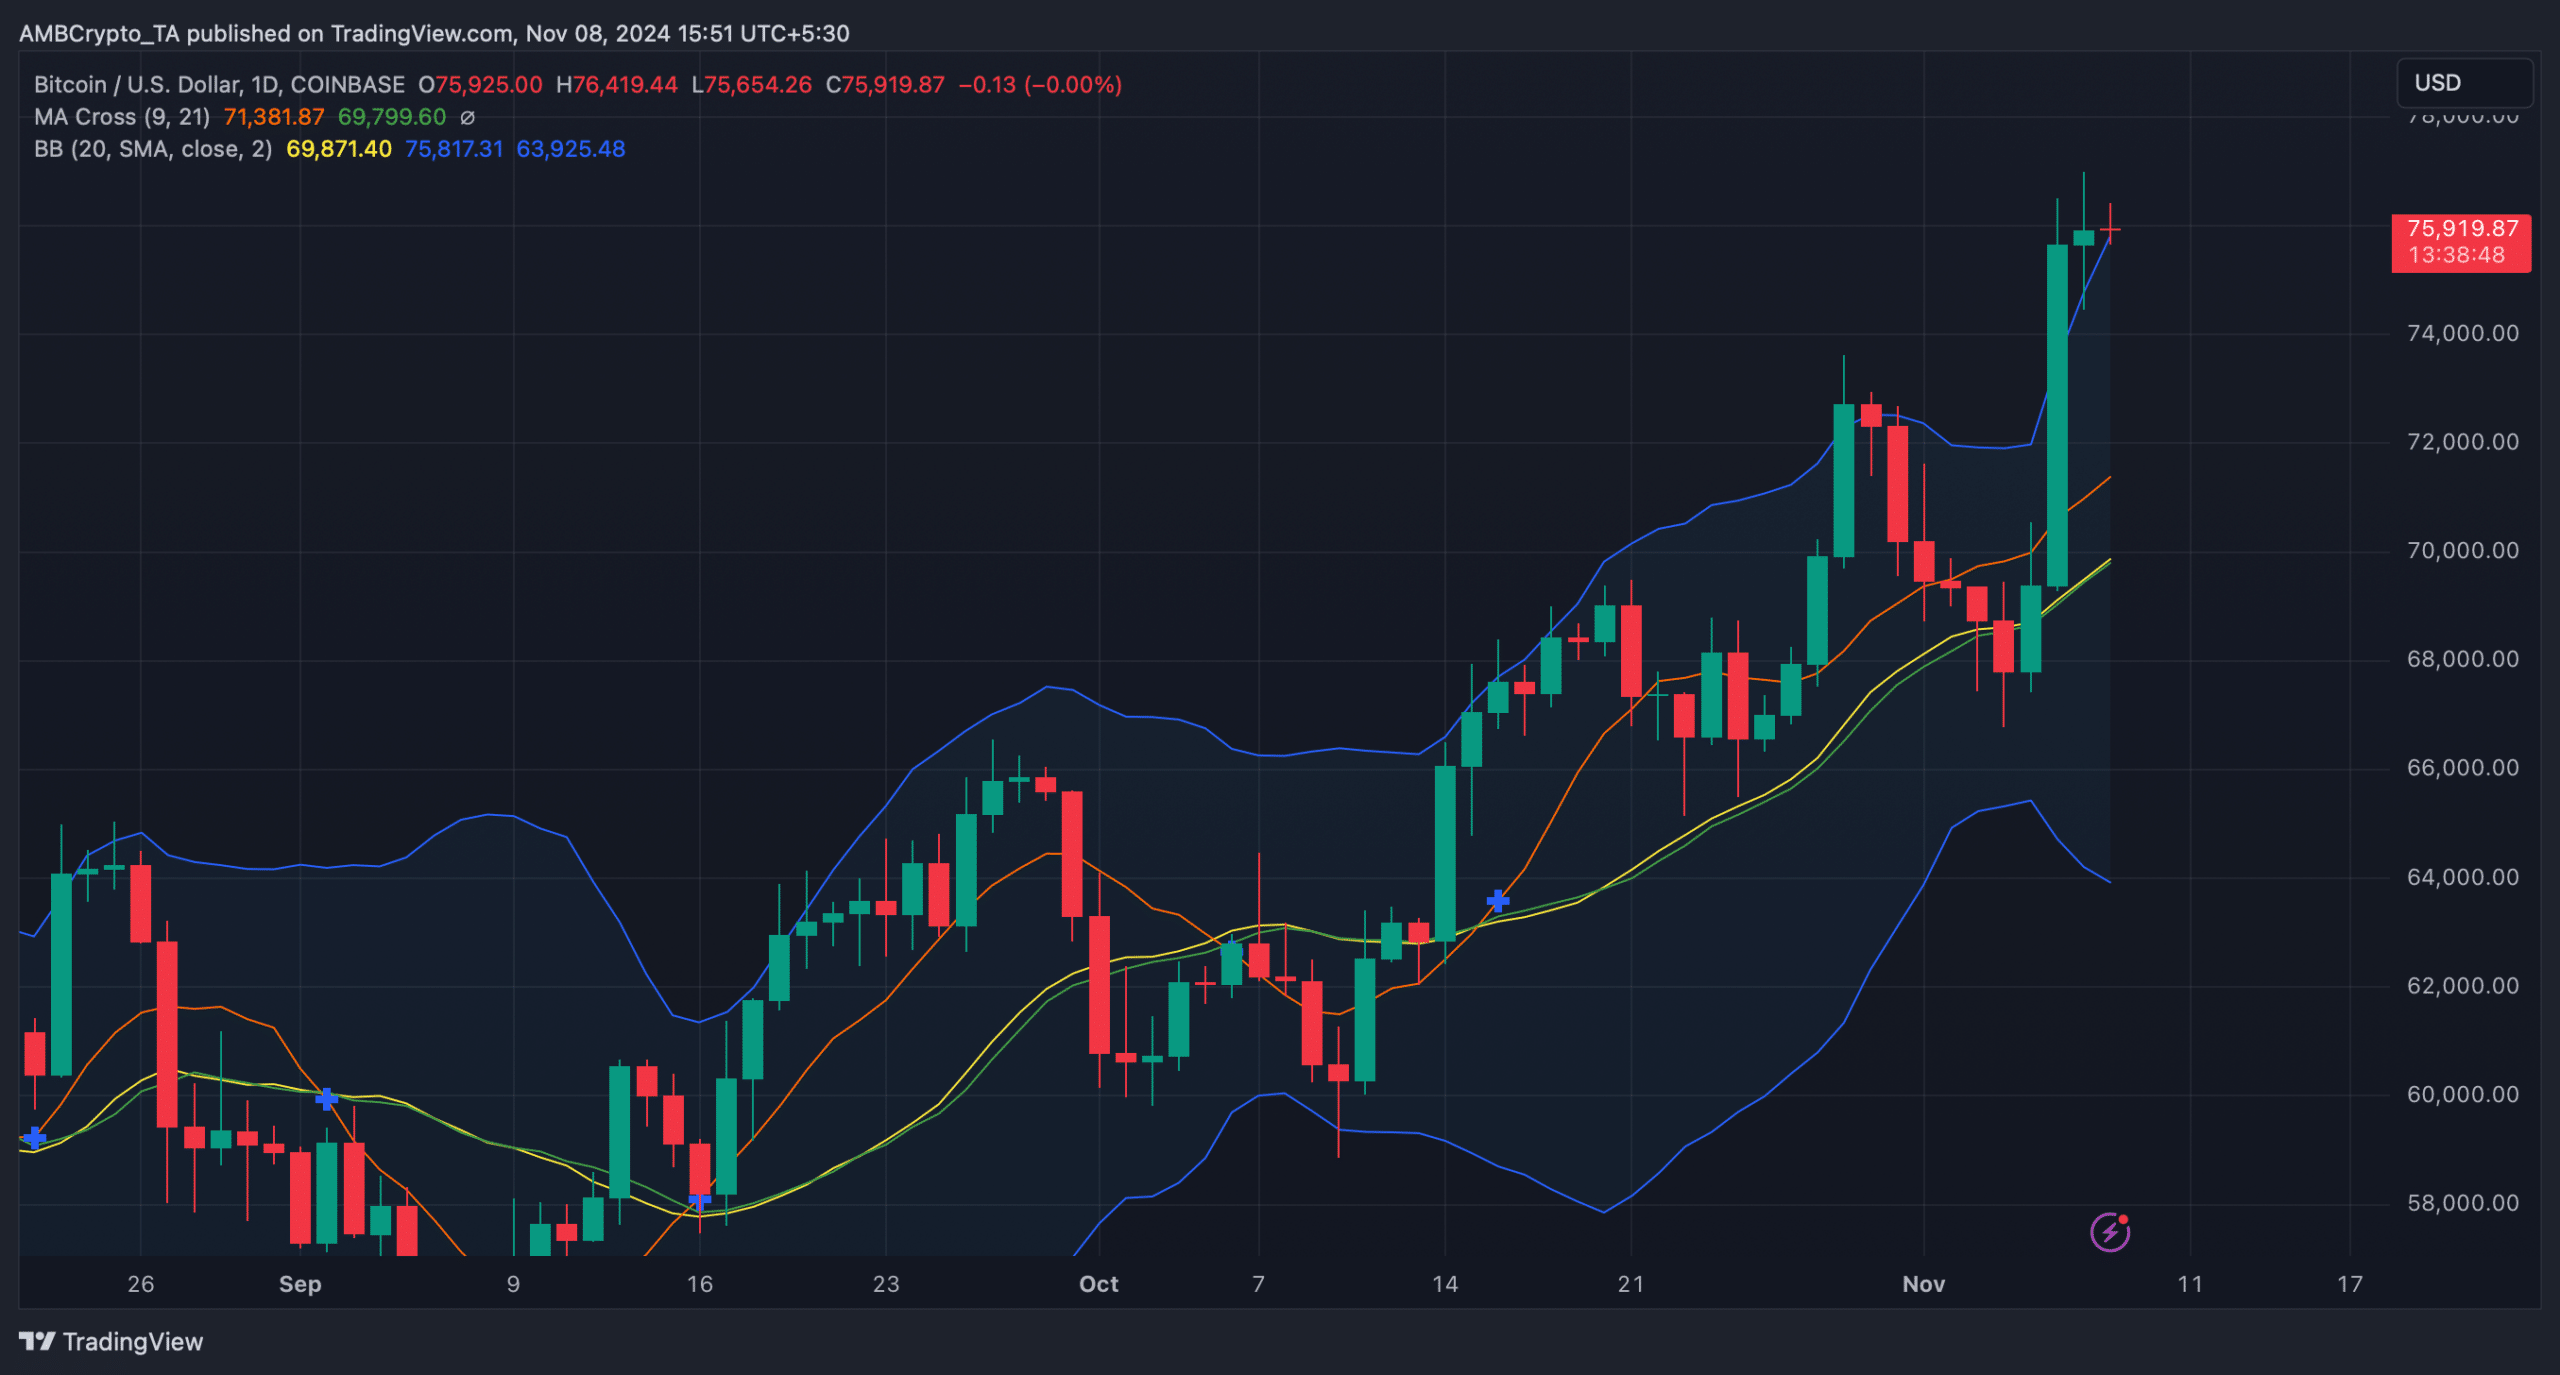
Beginning with Bitcoin, its MA cross indicator suggested a clear bullish advantage in the market. But the king coin might witness a short pullback in the coming days as its price touched the upper limit of the bollinger bands.
Source: TradingView
Read Bitcoin’s [BTC] Price Prediction 2024–2025
Mentioning Ethereum, the MA cross indicator revealed that a golden cross was happening, which, if happens, could propel further growth for ETH. At the time of writing, ETH was trading at $2.9k as its value surged by over 15% last week.
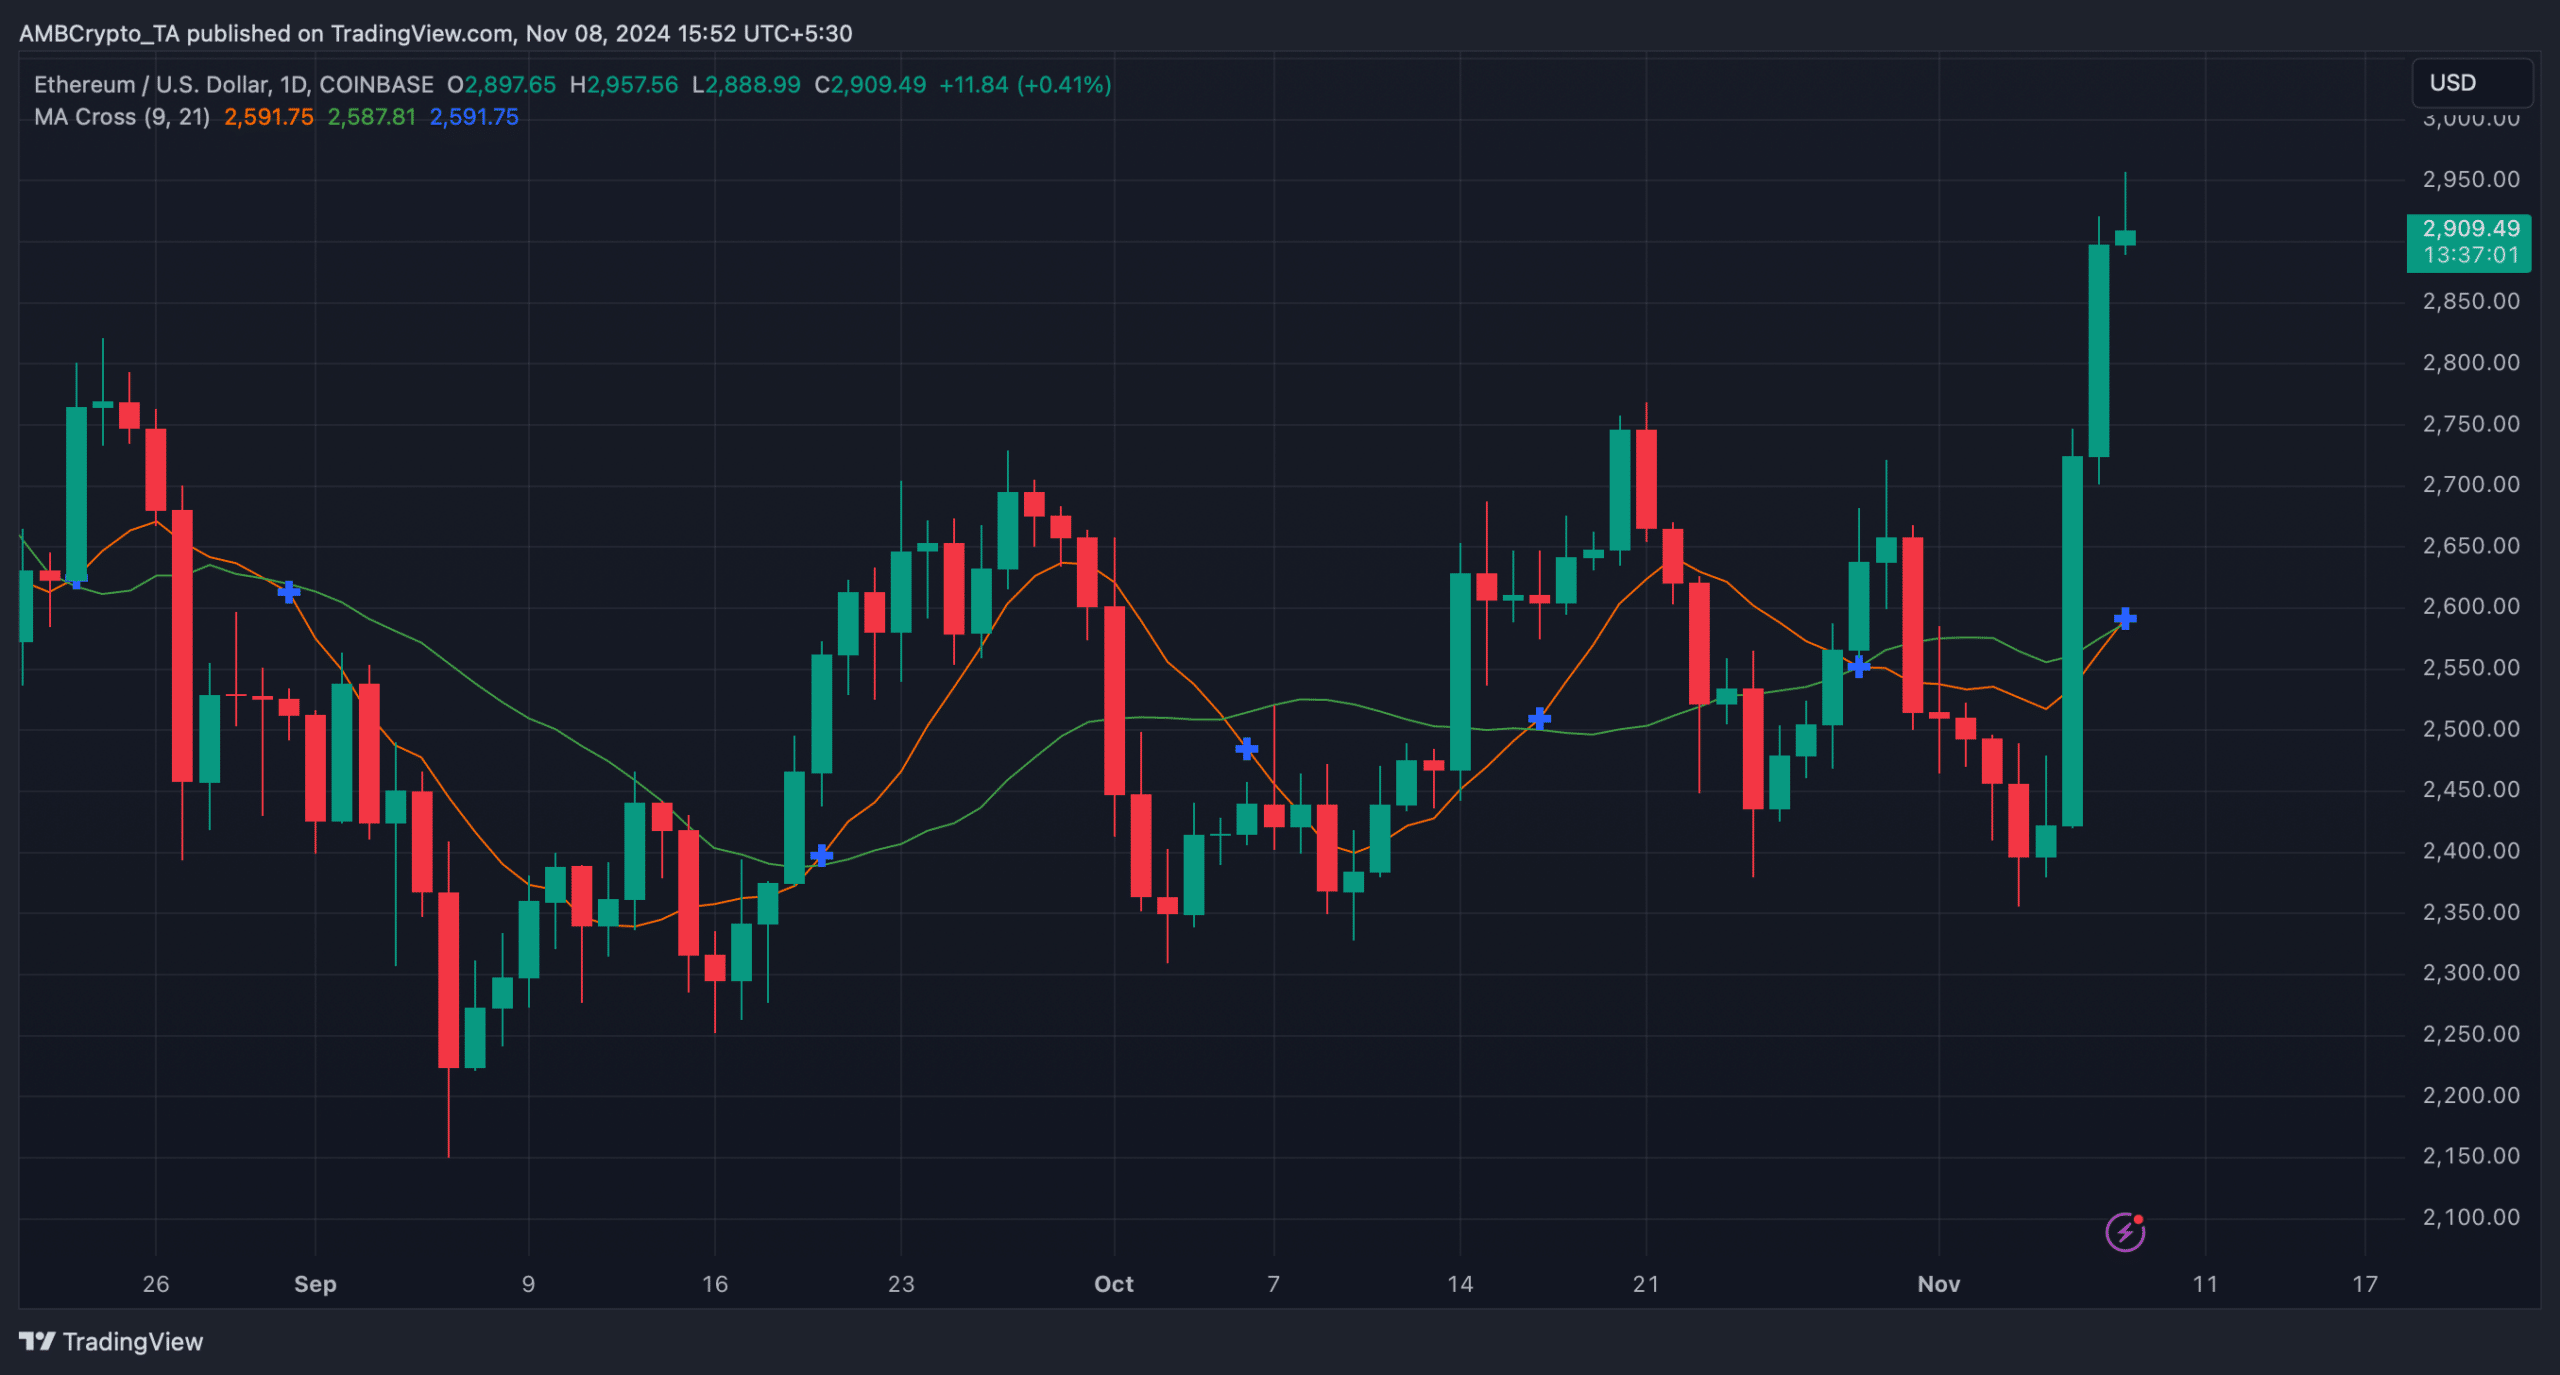
Source: TradingView
- Investors were showing confidence in BTC as they continued to buy.
- Ethereum ETFs also witnessed major netflows on the 7th of November.
The United States election result stirred up several economic sectors across the globe, and crypto was not left out. The entire crypto market witnessed price upticks, including the king of cryptos, Bitcoin [BTC]. Not only did BTC’s price increase, it also registered record buying in ETFs.
Bitcoin ETFs hit new record
CRYPTOBIRD, a popular crypto analyst, recently posted a tweet revealing a major development related to BTC ETFs. As per the tweet, a record of over 17k BTC was bought in the recent past. To be precise, a total of 406k BTC netflows have been registered till the 7th of November.
On the same day alone, ETFs witnessed over 17.9k in netflows, which was the highest. Notable, this came days after the U.S. presidential elections.

Source: Heyapollo
This massive rise in ETF netflows clearly suggested that the overall market was confident in the king coin. If this trend is to be believed, BTC’s upcoming days could be even better in terms of its price action.
At press time, BTC’s price had risen by nearly 10% in the past seven days and was trading at $75.89k, near its all-time high.
We then checked other datasets to find out whether buying pressure was high in the overall market. Our analysis of Glassnode’s data revealed that BTC’s accumulation trend score jumped from 0.04 to 0.8 within a month.
For starters, the indicator reflects the relative size of entities that are actively accumulating coins on-chain in terms of their BTC holdings. A number closer to 1 indicates more buying pressure, which can be inferred as a bullish signal.

Source: Glassnode
How is Ethereum coping?
Since Bitcoin ETF netflows reached record highs, AMBCrypto then took a look at Ethereum [ETH] ETFs’ state. Our analysis of Dune’s data pointed out that ETH ETF netflows exceeded $56 million on the 7th of November.
This was one of the largest inflows since the inception of ETH ETFs, which was commendable.

Source: Dune
Therefore, we checked both BTC and ETH’s daily charts to see whether this newfound interest will translate into continued price hikes.
Beginning with Bitcoin, its MA cross indicator suggested a clear bullish advantage in the market. But the king coin might witness a short pullback in the coming days as its price touched the upper limit of the bollinger bands.

Source: TradingView
Read Bitcoin’s [BTC] Price Prediction 2024–2025
Mentioning Ethereum, the MA cross indicator revealed that a golden cross was happening, which, if happens, could propel further growth for ETH. At the time of writing, ETH was trading at $2.9k as its value surged by over 15% last week.

Source: TradingView


can you buy clomiphene prices clomiphene pregnancy clomid tablet price cost of cheap clomiphene for sale can i get clomiphene without a prescription clomid sleep apnea can you get cheap clomiphene without rx
Greetings! Extremely productive suggestion within this article! It’s the scarcely changes which choice make the largest changes. Thanks a lot towards sharing!
More posts like this would bring about the blogosphere more useful.
azithromycin where to buy – cost metronidazole metronidazole 400mg drug
order rybelsus 14mg generic – order semaglutide 14 mg online cheap periactin 4 mg generic
order domperidone 10mg generic – cost flexeril 15mg flexeril online order
augmentin price – atbioinfo.com order ampicillin for sale
esomeprazole 20mg pills – anexamate.com buy nexium online cheap
generic warfarin 2mg – https://coumamide.com/ losartan 50mg canada
order deltasone 40mg generic – https://apreplson.com/ buy deltasone for sale
buy ed pills paypal – site best natural ed pills
cheap amoxil tablets – amoxicillin buy online purchase amoxicillin generic
buy cheap forcan – order diflucan 200mg without prescription buy generic diflucan over the counter
buy cenforce 100mg pill – https://cenforcers.com/ order cenforce 100mg online
maximpeptide tadalafil review – https://ciltadgn.com/ what are the side effect of cialis
buy zantac 300mg – this buy generic ranitidine
I’ll certainly bring to read more. https://gnolvade.com/
discount viagra for sale – https://strongvpls.com/# buy viagra cialis levitra
I couldn’t weather commenting. Well written! prednisone pill
Thanks recompense sharing. It’s outstrip quality. https://ursxdol.com/furosemide-diuretic/
With thanks. Loads of erudition! https://prohnrg.com/
The reconditeness in this piece is exceptional. Г©quivalent viagra professional