


- Tron’s TVL now sits at a new all-time high.
- Daily fees and revenue on the network recently climbed to a multi-year high.
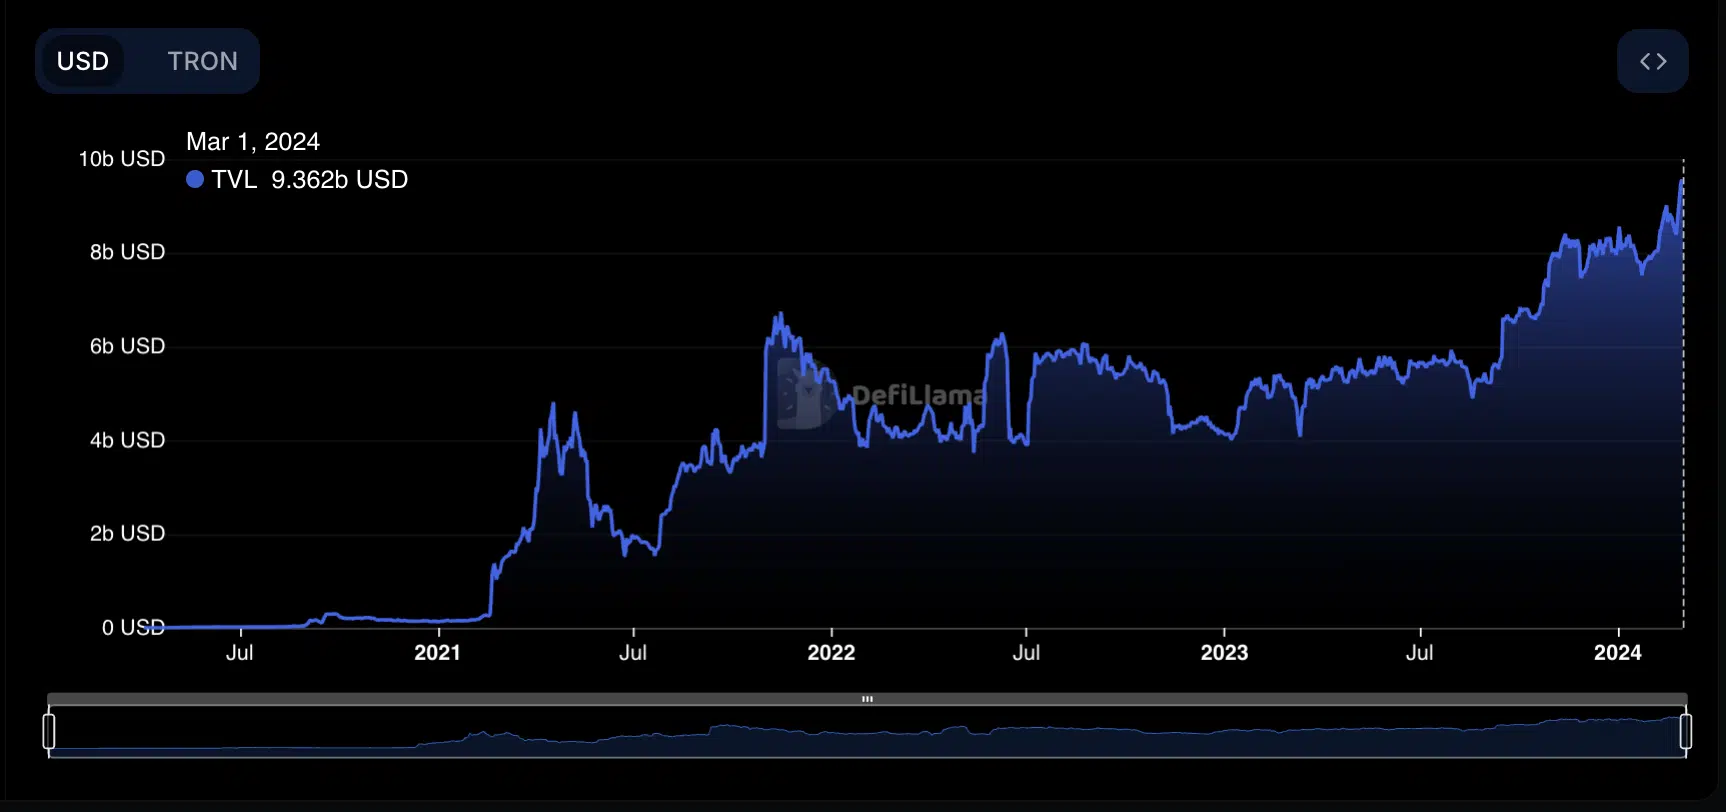
The total value locked (TVL) across the decentralized finance (DeFi) protocols housed within the Tron network [TRX] has reached a new all-time high, according to data from DefiLlama.
In the last month, Tron’s TVL grew by 19% and by 16% on a year-to-date (YTD). The TVL growth on the blockchain comes amid a recent surge in new demand for the network. At press time, the chain’s TVL was $9.36 billion.

Source: DefiLlama
AMBCrypto reported earlier that the hike in the new adoption ratio on Tron since the year began caused the count of its non-zero balance address to rally above 95 million, towering above other Layer 1 (L1) networks such as Cardano [ADA] and Avalanche [AVAX].
The surge in network activity was reflected in the growth in TVL across 19 protocols out of the 20 housed within the Tron network in the last month, per DefiLlama data.
With the last month marked by significant user activity on Tron, daily transaction fees and revenue also climbed to their highest level in three years on 28th February.
Data tracked by Artemis showed that fees paid by Tron users to process their transactions on that day and the revenue derived from the same totaled $2 million. Tron’s fees and revenue have climbed by 119% on a YTD basis.
TRX remains untethered to swings
At press time, the coin’s native coin TRX traded at $0.14. While leading coins Bitcoin [BTC] and Ethereum [ETH] have seen significant upticks in their values in the last week, TRX’s price has only increased by 1% during that period, according to CoinMarketCap.
However, the sharp rise in the values of these assets came with a risk of severe price swings. TRX, on the other hand, appeared not to be prone to that, as an assessment of its price movement on a 12-hour chart revealed.
AMBCrypto observed TRX’s Bollinger Bands (BB), a key market volatility indicator, and found that the gap between the upper and lower bands of the indicator remained narrow.
A narrow gap between the upper and lower bands suggests a period of low volatility in the price of the asset.
Realistic or not, here’s TRX’s market cap in BTC terms
This was confirmed by its Average True Range (ATR) indicator, which measures market volatility by calculating the average range between high and low prices over a specified number of periods.
It has trended downward since 18th February, suggesting a decline in market volatility. At press time, TRX’s ATR was 0.00197.

Source: TradingView
- Tron’s TVL now sits at a new all-time high.
- Daily fees and revenue on the network recently climbed to a multi-year high.
The total value locked (TVL) across the decentralized finance (DeFi) protocols housed within the Tron network [TRX] has reached a new all-time high, according to data from DefiLlama.
In the last month, Tron’s TVL grew by 19% and by 16% on a year-to-date (YTD). The TVL growth on the blockchain comes amid a recent surge in new demand for the network. At press time, the chain’s TVL was $9.36 billion.
Source: DefiLlama
AMBCrypto reported earlier that the hike in the new adoption ratio on Tron since the year began caused the count of its non-zero balance address to rally above 95 million, towering above other Layer 1 (L1) networks such as Cardano [ADA] and Avalanche [AVAX].
The surge in network activity was reflected in the growth in TVL across 19 protocols out of the 20 housed within the Tron network in the last month, per DefiLlama data.
With the last month marked by significant user activity on Tron, daily transaction fees and revenue also climbed to their highest level in three years on 28th February.
Data tracked by Artemis showed that fees paid by Tron users to process their transactions on that day and the revenue derived from the same totaled $2 million. Tron’s fees and revenue have climbed by 119% on a YTD basis.
TRX remains untethered to swings
At press time, the coin’s native coin TRX traded at $0.14. While leading coins Bitcoin [BTC] and Ethereum [ETH] have seen significant upticks in their values in the last week, TRX’s price has only increased by 1% during that period, according to CoinMarketCap.
However, the sharp rise in the values of these assets came with a risk of severe price swings. TRX, on the other hand, appeared not to be prone to that, as an assessment of its price movement on a 12-hour chart revealed.
AMBCrypto observed TRX’s Bollinger Bands (BB), a key market volatility indicator, and found that the gap between the upper and lower bands of the indicator remained narrow.
A narrow gap between the upper and lower bands suggests a period of low volatility in the price of the asset.
Realistic or not, here’s TRX’s market cap in BTC terms
This was confirmed by its Average True Range (ATR) indicator, which measures market volatility by calculating the average range between high and low prices over a specified number of periods.
It has trended downward since 18th February, suggesting a decline in market volatility. At press time, TRX’s ATR was 0.00197.
Source: TradingView


Your article helped me a lot, is there any more related content? Thanks!
Thanks for sharing. I read many of your blog posts, cool, your blog is very good.
Can you be more specific about the content of your article? After reading it, I still have some doubts. Hope you can help me.
cost of generic clomid pills get clomiphene for sale cost of clomiphene for men buy clomid pill clomid pct buying cheap clomid without dr prescription generic clomiphene for sale
This website really has all of the bumf and facts I needed there this thesis and didn’t positive who to ask.
I’ll certainly return to skim more.
where can i buy zithromax – order flagyl online metronidazole cheap
rybelsus 14 mg tablet – cheap cyproheptadine order periactin 4mg generic
buy generic motilium – sumycin 250mg sale cyclobenzaprine 15mg usa
augmentin 625mg us – https://atbioinfo.com/ buy ampicillin sale
buy nexium pills – https://anexamate.com/ buy esomeprazole 40mg pill
buy ed pills no prescription – https://fastedtotake.com/ best over the counter ed pills
forcan order – buy cheap fluconazole order fluconazole 200mg
order cenforce online – https://cenforcers.com/ order cenforce online
sanofi cialis – https://ciltadgn.com/# cialis for daily use reviews
benefits of tadalafil over sidenafil – https://strongtadafl.com/# cialis generic overnite
order generic zantac 300mg – https://aranitidine.com/# brand zantac 150mg
This is the kind of writing I truly appreciate. https://buyfastonl.com/furosemide.html
This is the compassionate of criticism I in fact appreciate. https://ursxdol.com/prednisone-5mg-tablets/
I am in point of fact enchant‚e ‘ to gleam at this blog posts which consists of tons of of use facts, thanks towards providing such data. https://prohnrg.com/
Thanks on putting this up. It’s well done. propecia prix france