


Reason to trust
![]()
Strict editorial policy that focuses on accuracy, relevance, and impartiality
Created by industry experts and meticulously reviewed
The highest standards in reporting and publishing
Strict editorial policy that focuses on accuracy, relevance, and impartiality
Morbi pretium leo et nisl aliquam mollis. Quisque arcu lorem, ultricies quis pellentesque nec, ullamcorper eu odio.
Este artículo también está disponible en español.
Ethereum’s price has been facing significant downward pressure in recent days, with the cryptocurrency even dipping below the $2,000 mark for the first time since December 2023. The crash below $2,000 has done more harm to the already declining bullish sentiment, and the next outlook is whether there will be more incoming declines or whether the leading altcoin is already nearing a bottom.
Notably, an interesting signal of a probable outcome has been revealed through the Ethereum CME Futures chart, where the monthly Relative Strength Index (RSI) just reached its lowest level on record, surpassing the readings from the 2022 bear market.
Ethereum’s Monthly RSI Drops Below 2022 Levels
Crypto analyst Tony “The Bull” Severino has highlighted a significant development in Ethereum’s technical indicators, pointing out that the cryptocurrency’s monthly Relative Strength Index (RSI) on the CME Futures chart has now fallen to its lowest level on record.
Related Reading
This decline has pushed the RSI below the 2022 bear market bottom, a period that saw Ethereum reach multi-year lows before eventually staging a recovery. Severino shared this observation in a detailed technical analysis post on social media platform X, using Ethereum’s Futures monthly candlestick timeframe chart.
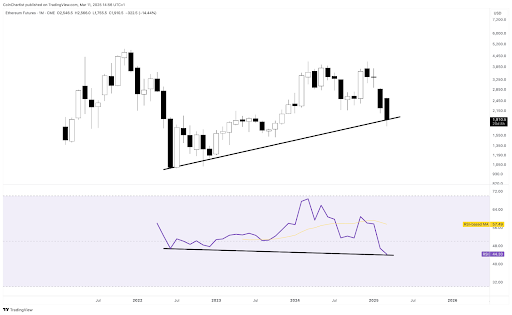
The analyst noted that although this drop suggests strong selling momentum, it could also be forming a hidden bullish divergence. This is because the last time Ethereum’s RSI dropped to such extreme lows, it eventually found its footing around $900 and embarked on a price uptrend in the months that followed. This previous performance raises the possibility of Ethereum approaching a bottom, despite its current downward momentum. It is possible that Ethereum has now found a footing around $1,900 and is now gearing up for another uprend in the coming months.
However, Severino remained cautious about the situation, stating that the reading could also mean that the selling pressure is at its strongest and could continue driving Ethereum lower into oversold conditions. Interestingly, he also made it clear that despite the potential for a reversal, he is currently leaning more toward a bearish outlook on Ethereum.
Stochastic Indicator Points To A Deeper Bearish Phase
Beyond the RSI levels, another key indicator that Severino highlighted is Ethereum’s one-month Stochastic oscillator, which has now dropped below the 50 mark. In a previous analysis, he noted that Ethereum’s drop below the 50 mark is characteristic of a bear maket territory. However, it typically does not find a bottom until the Stochastic indicator reaches below 20 and is in extreme oversold conditions.
Related Reading
As shown by the chart below, past trends indicate that when Ethereum’s Stochastic oscillator enters bear market territory, it often takes months before the asset stabilizes and begins a strong recovery.
At the time of writing, Ethereum is trading at $1,920, having recently reached a low of $1,851 in the past 24 hours.
Featured image from Unsplash, chart from Tradingview.com
Reason to trust
![]()
Strict editorial policy that focuses on accuracy, relevance, and impartiality
Created by industry experts and meticulously reviewed
The highest standards in reporting and publishing
Strict editorial policy that focuses on accuracy, relevance, and impartiality
Morbi pretium leo et nisl aliquam mollis. Quisque arcu lorem, ultricies quis pellentesque nec, ullamcorper eu odio.
Este artículo también está disponible en español.
Ethereum’s price has been facing significant downward pressure in recent days, with the cryptocurrency even dipping below the $2,000 mark for the first time since December 2023. The crash below $2,000 has done more harm to the already declining bullish sentiment, and the next outlook is whether there will be more incoming declines or whether the leading altcoin is already nearing a bottom.
Notably, an interesting signal of a probable outcome has been revealed through the Ethereum CME Futures chart, where the monthly Relative Strength Index (RSI) just reached its lowest level on record, surpassing the readings from the 2022 bear market.
Ethereum’s Monthly RSI Drops Below 2022 Levels
Crypto analyst Tony “The Bull” Severino has highlighted a significant development in Ethereum’s technical indicators, pointing out that the cryptocurrency’s monthly Relative Strength Index (RSI) on the CME Futures chart has now fallen to its lowest level on record.
Related Reading
This decline has pushed the RSI below the 2022 bear market bottom, a period that saw Ethereum reach multi-year lows before eventually staging a recovery. Severino shared this observation in a detailed technical analysis post on social media platform X, using Ethereum’s Futures monthly candlestick timeframe chart.
The analyst noted that although this drop suggests strong selling momentum, it could also be forming a hidden bullish divergence. This is because the last time Ethereum’s RSI dropped to such extreme lows, it eventually found its footing around $900 and embarked on a price uptrend in the months that followed. This previous performance raises the possibility of Ethereum approaching a bottom, despite its current downward momentum. It is possible that Ethereum has now found a footing around $1,900 and is now gearing up for another uprend in the coming months.
However, Severino remained cautious about the situation, stating that the reading could also mean that the selling pressure is at its strongest and could continue driving Ethereum lower into oversold conditions. Interestingly, he also made it clear that despite the potential for a reversal, he is currently leaning more toward a bearish outlook on Ethereum.
Stochastic Indicator Points To A Deeper Bearish Phase
Beyond the RSI levels, another key indicator that Severino highlighted is Ethereum’s one-month Stochastic oscillator, which has now dropped below the 50 mark. In a previous analysis, he noted that Ethereum’s drop below the 50 mark is characteristic of a bear maket territory. However, it typically does not find a bottom until the Stochastic indicator reaches below 20 and is in extreme oversold conditions.
Related Reading
As shown by the chart below, past trends indicate that when Ethereum’s Stochastic oscillator enters bear market territory, it often takes months before the asset stabilizes and begins a strong recovery.
At the time of writing, Ethereum is trading at $1,920, having recently reached a low of $1,851 in the past 24 hours.
Featured image from Unsplash, chart from Tradingview.com


can i purchase clomid for sale get generic clomid without rx can you get cheap clomid prices clomiphene for sale australia clomiphene chance of twins how to buy cheap clomid price how to buy generic clomid price
This website exceedingly has all of the tidings and facts I needed about this case and didn’t comprehend who to ask.
I’ll certainly bring back to be familiar with more.
azithromycin for sale online – flagyl us order flagyl 400mg generic
buy semaglutide 14 mg sale – buy cyproheptadine 4mg generic periactin pills
buy motilium 10mg without prescription – order tetracycline 250mg online flexeril 15mg tablet
order generic inderal 10mg – methotrexate us buy methotrexate 10mg
amoxicillin us – buy diovan generic combivent cost
zithromax 250mg canada – order generic azithromycin order nebivolol generic
augmentin 1000mg uk – atbioinfo buy cheap ampicillin
buy esomeprazole 40mg pills – https://anexamate.com/ order nexium 40mg online cheap
buy coumadin generic – https://coumamide.com/ losartan 25mg pills
mobic 15mg brand – https://moboxsin.com/ meloxicam pills
deltasone canada – https://apreplson.com/ prednisone 10mg without prescription
ed pills gnc – fastedtotake best ed pills
amoxil pills – combamoxi.com purchase amoxicillin without prescription
cenforce 50mg price – cenforce rs cenforce ca
when does cialis go generic – click can you drink wine or liquor if you took in tadalafil
generic ranitidine – buy zantac 300mg pill generic zantac 300mg
viagra 50 mg pill – viagra pill 50mg viagra sale online pharmacy
I couldn’t turn down commenting. Profoundly written! https://buyfastonl.com/furosemide.html
Proof blog you be undergoing here.. It’s intricate to espy great status article like yours these days. I justifiably recognize individuals like you! Go through care!! https://ursxdol.com/get-metformin-pills/
This is the kind of enter I find helpful. https://prohnrg.com/
More posts like this would make the online elbow-room more useful. https://aranitidine.com/fr/ciagra-professional-20-mg/
This website really has all of the information and facts I needed adjacent to this case and didn’t identify who to ask. https://ondactone.com/spironolactone/
Palatable blog you have here.. It’s obdurate to assign great calibre writing like yours these days. I justifiably respect individuals like you! Withstand guardianship!!
https://doxycyclinege.com/pro/sumatriptan/
This is the gentle of scribble literary works I positively appreciate. http://mi.minfish.com/home.php?mod=space&uid=1412614
dapagliflozin 10mg us – https://janozin.com/# dapagliflozin cost