Data shows that Bitcoin sentiment has cooled off to neutral from greed following the asset’s latest plunge to the $57,000 level.
Bitcoin Fear & Greed Index Has Returned To Neutral Levels
The “Fear & Greed Index” is an indicator created by Alternative that shows the average sentiment among investors in the Bitcoin and wider cryptocurrency market.
This index estimates sentiment by considering five factors: volatility, trading volume, social media data, market cap dominance, and Google Trends.
The metric uses a scale that runs from zero to 100 to represent this average sentiment. All values under 46 suggest that investors are fearful, while those above 54 imply a greedy market. The zone between these two cutoffs naturally corresponds to the territory of neutral mentality.
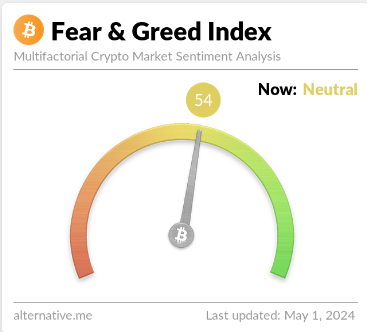
Now, here is what the Bitcoin sentiment looks like right now, according to the Fear & Greed Index:

The value of the metric appears to be 54 at the moment | Source: Alternative
As displayed above, the Bitcoin Fear & Greed Index is at a value of 54, implying that investors share a neutral sentiment currently. However, the neutrality is only just, as the metric is right at the boundary of the greed region.
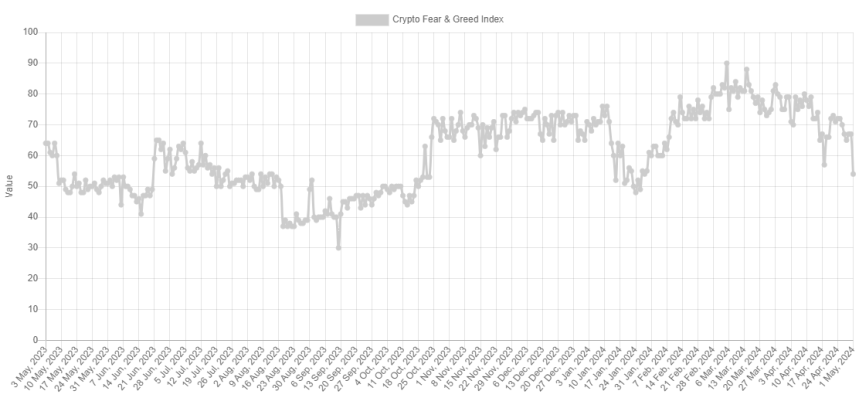
This is a significant departure from yesterday’s sentiment: 67. The chart below shows how the indicator’s value has changed recently.

The trend in the Fear & Greed Index over the past year | Source: Alternative
As the graph shows, the Bitcoin Fear & Greed Index has been declining recently. For most of February and March, as well as the first half of April, the indicator was in or near a special zone called extreme greed.
The market assumes this sentiment at values above 75. As the asset price struggled recently, the mentality cooled off from this extreme zone and entered the normal greed region. With the latest crash in BTC, the index has seen a sharp plunge, now exiting out of greed altogether.
Historically, cryptocurrency has tended to move against the majority’s expectations. The stronger this expectation, the higher the probability of such a contrary move.
This expectation is considered the strongest in extreme sentiment zones, as well as extreme fear and greed. As such, major bottoms and tops have often occurred in these territories.
The all-time high (ATH) price last month, which continues to be the top of the rally so far, also occurred alongside extreme values of the Bitcoin Fear & Greed Index.
With the sentiment now cooled to neutral, some investors may be watching for a fall into fear. This is natural because a rebound would become more probable the worse the sentiment gets now.
BTC Price
During Bitcoin’s latest plunge, its price briefly slipped below $57,000 before surging back to $57,300.
Looks like the price of the asset has registered a sharp drop over the past two days | Source: BTCUSD on TradingView
Featured image from Kanchanara on Unsplash.com, Alternative.me, chart from TradingView.com
Disclaimer: The article is provided for educational purposes only. It does not represent the opinions of NewsBTC on whether to buy, sell or hold any investments and naturally investing carries risks. You are advised to conduct your own research before making any investment decisions. Use information provided on this website entirely at your own risk.
Data shows that Bitcoin sentiment has cooled off to neutral from greed following the asset’s latest plunge to the $57,000 level.
Bitcoin Fear & Greed Index Has Returned To Neutral Levels
The “Fear & Greed Index” is an indicator created by Alternative that shows the average sentiment among investors in the Bitcoin and wider cryptocurrency market.
This index estimates sentiment by considering five factors: volatility, trading volume, social media data, market cap dominance, and Google Trends.
The metric uses a scale that runs from zero to 100 to represent this average sentiment. All values under 46 suggest that investors are fearful, while those above 54 imply a greedy market. The zone between these two cutoffs naturally corresponds to the territory of neutral mentality.
Now, here is what the Bitcoin sentiment looks like right now, according to the Fear & Greed Index:

The value of the metric appears to be 54 at the moment | Source: Alternative
As displayed above, the Bitcoin Fear & Greed Index is at a value of 54, implying that investors share a neutral sentiment currently. However, the neutrality is only just, as the metric is right at the boundary of the greed region.
This is a significant departure from yesterday’s sentiment: 67. The chart below shows how the indicator’s value has changed recently.

The trend in the Fear & Greed Index over the past year | Source: Alternative
As the graph shows, the Bitcoin Fear & Greed Index has been declining recently. For most of February and March, as well as the first half of April, the indicator was in or near a special zone called extreme greed.
The market assumes this sentiment at values above 75. As the asset price struggled recently, the mentality cooled off from this extreme zone and entered the normal greed region. With the latest crash in BTC, the index has seen a sharp plunge, now exiting out of greed altogether.
Historically, cryptocurrency has tended to move against the majority’s expectations. The stronger this expectation, the higher the probability of such a contrary move.
This expectation is considered the strongest in extreme sentiment zones, as well as extreme fear and greed. As such, major bottoms and tops have often occurred in these territories.
The all-time high (ATH) price last month, which continues to be the top of the rally so far, also occurred alongside extreme values of the Bitcoin Fear & Greed Index.
With the sentiment now cooled to neutral, some investors may be watching for a fall into fear. This is natural because a rebound would become more probable the worse the sentiment gets now.
BTC Price
During Bitcoin’s latest plunge, its price briefly slipped below $57,000 before surging back to $57,300.
Looks like the price of the asset has registered a sharp drop over the past two days | Source: BTCUSD on TradingView
Featured image from Kanchanara on Unsplash.com, Alternative.me, chart from TradingView.com
Disclaimer: The article is provided for educational purposes only. It does not represent the opinions of NewsBTC on whether to buy, sell or hold any investments and naturally investing carries risks. You are advised to conduct your own research before making any investment decisions. Use information provided on this website entirely at your own risk.


can you buy generic clomid online can i order cheap clomid pills buy generic clomiphene without dr prescription can i purchase cheap clomid without a prescription where can i get generic clomid tablets order clomid online can i buy generic clomiphene without dr prescription
I’ll certainly carry back to be familiar with more.
order azithromycin 250mg pill – buy tindamax medication flagyl drug
rybelsus 14 mg drug – order cyproheptadine 4mg cyproheptadine cost
generic domperidone – order motilium 10mg for sale flexeril online
buy augmentin tablets – atbioinfo.com acillin pills
esomeprazole 40mg uk – anexamate.com buy nexium 40mg online cheap
warfarin order – cou mamide order cozaar 50mg sale
cheap mobic 15mg – mobo sin buy mobic for sale
order prednisone 10mg generic – https://apreplson.com/ buy deltasone 10mg for sale
best ed medications – non prescription erection pills new ed pills
purchase amoxil without prescription – amoxicillin generic cheap amoxicillin online
fluconazole for sale – https://gpdifluca.com/ buy forcan cheap
buy generic lexapro – https://escitapro.com/ escitalopram 10mg cheap
cenforce online buy – this cenforce 50mg ca
cialis maximum dose – order cialis from canada cialis black in australia
cialis side effects – cialis 5mg best price cialis 5mg cost per pill
buy zantac 150mg generic – site buy zantac 300mg online cheap
sildenafil 50mg tablets – https://strongvpls.com/ cheap viagra and cialis
With thanks. Loads of conception! furosemide generic
I’ll certainly bring to read more. https://ursxdol.com/amoxicillin-antibiotic/
This is the amicable of content I take advantage of reading. https://prohnrg.com/product/atenolol-50-mg-online/
More articles like this would remedy the blogosphere richer. https://aranitidine.com/fr/acheter-fildena/
I couldn’t resist commenting. Warmly written! https://ondactone.com/spironolactone/
More posts like this would add up to the online space more useful.
https://proisotrepl.com/product/methotrexate/
More posts like this would make the online time more useful. https://experthax.com/forum/member.php?action=profile&uid=124575
forxiga pills – site forxiga 10mg pills