- PEPE and WIF noted some bearish sentiment over the previous day
- Their market structure was firmly bullish
Pepe [PEPE] reached a new local high at $0.0000108, as did dogwifhat [WIF] which touched the $3.56 mark. However, the higher timeframes showed that the trend remained bullish.
Yet, with Bitcoin [BTC] down 7% from $73.7k to $68.4k at press time, fears of a market correction had some grounds. Here’s what technical analysis of the meme coin revealed.
The lower timeframe momentum is bullish for both coins

Source: PEPE/USDT on TradingView
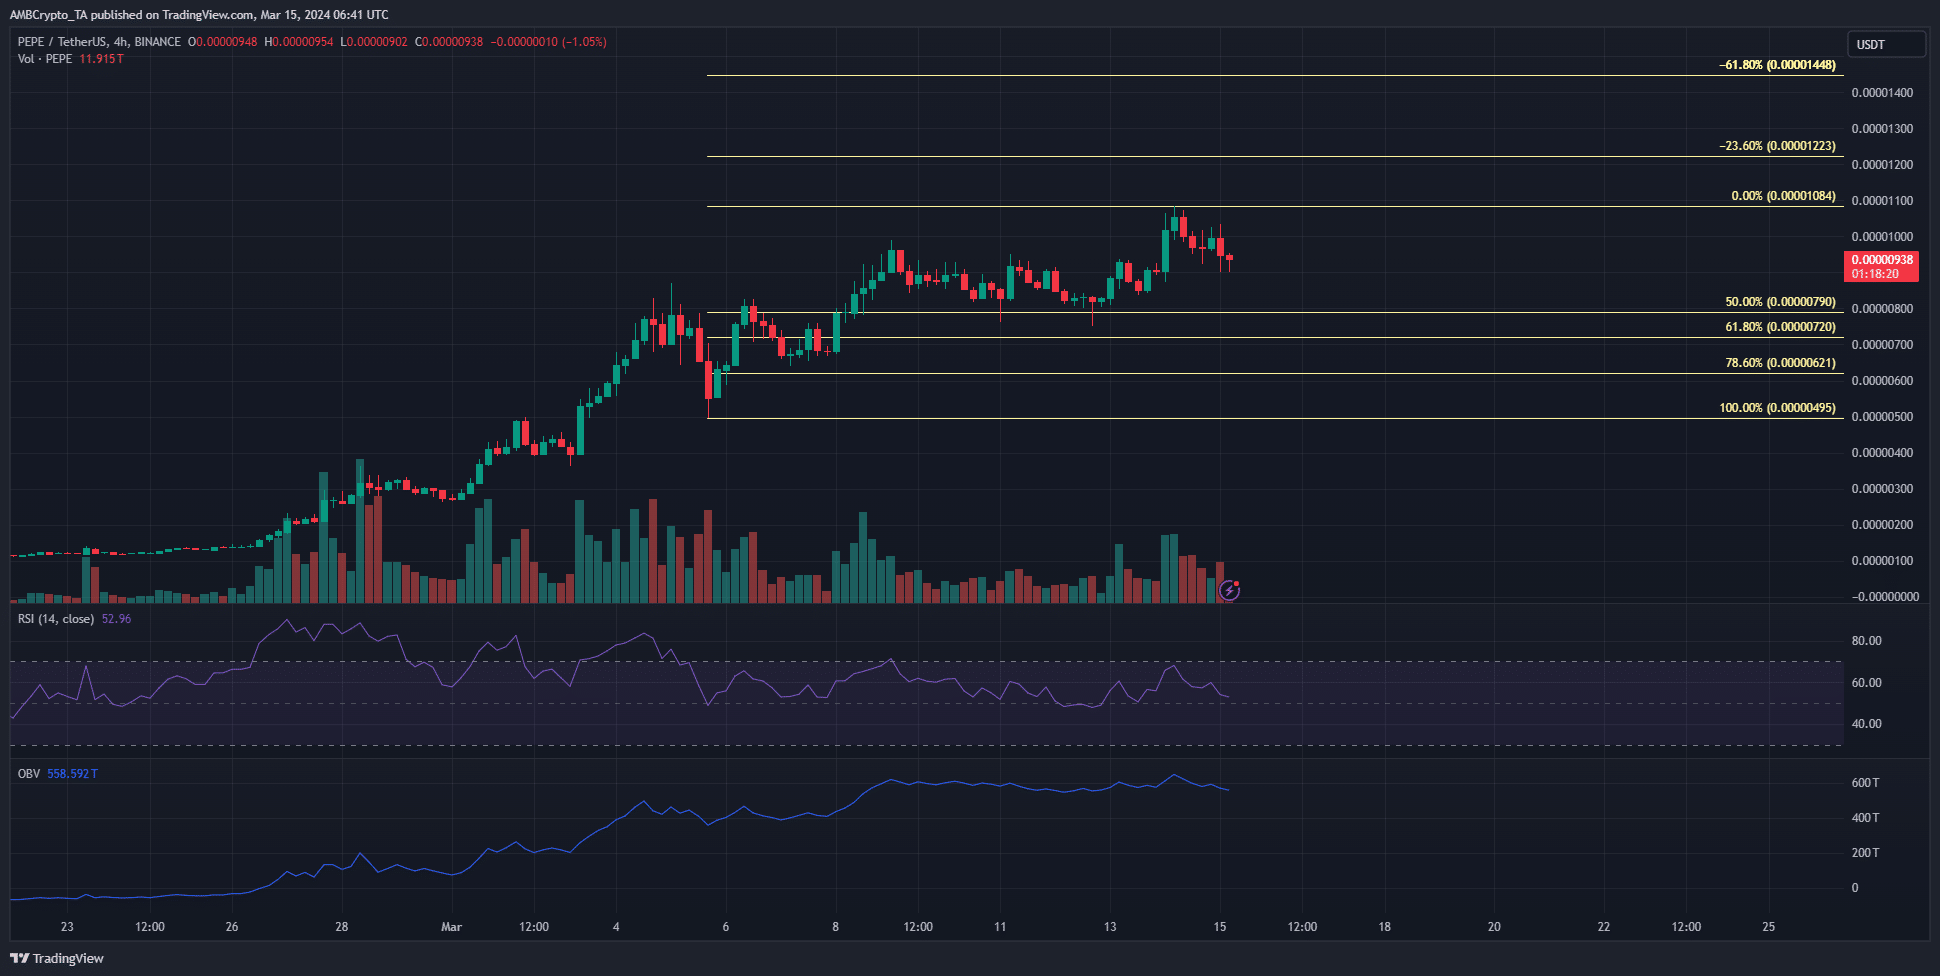
The RSI of PEPE on the 4-hour chart remained above the neutral 50 mark throughout March. This showed that the momentum continued to favor the bulls. The market structure was also bullish.
The Fibonacci retracement levels showed that a move to the 61.8%-78.6% region was possible. The OBV has remained flat over the past week to indicate a lack of buying volume. Hence, neither side had control over the market in recent days.
If PEPE begins to drop below the $0.0000079 support zone, buyers could look to re-enter the aforementioned demand zone based on the Fibonacci retracement levels.

Source: WIF/USDT on TradingView
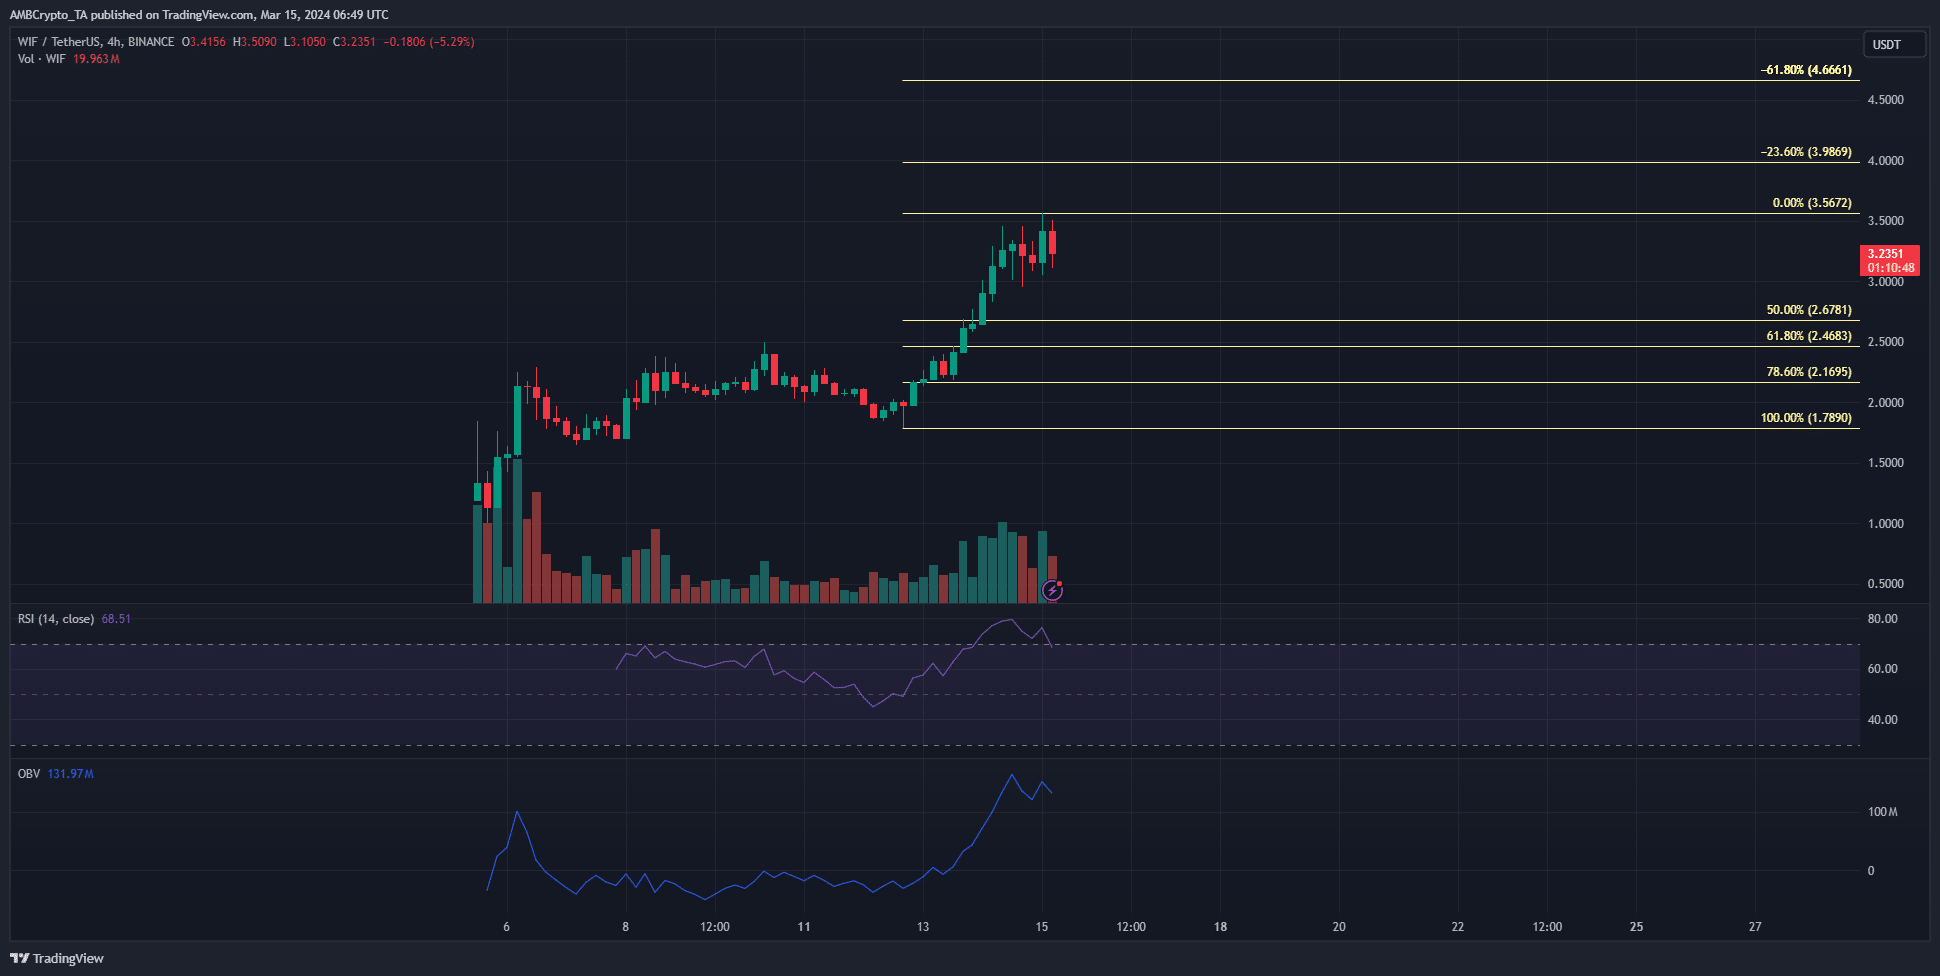
The chart of WIF showed that the memecoin has a bullish trajectory. The trading volume has been high over the past couple of days and the OBV soared upward. This indicated that demand far outweighed the selling pressure.
The RSI was falling below the overbought territory. The momentum has slowed down but was still strongly bullish. The Fibonacci levels plotted were tentative, as the move upward has not yet finished.
The $3 psychological support zone has held firm thus far, but a drop below this level could see the $2.17-$2.46 area retested. This would likely provide a bullish reaction.
Speculative bullish conviction for WIF stood firm, but not PEPE
Combining the price action with the Open Interest charts of the meme coins gives insights into what the speculators feel. While WIF showed bullishness, PEPE traders were not as optimistic.

Source: Coinglass
Since the 14th of March, the OI has begun to decline. During that time the price of PEPE declined by more than 10%. The drop in prices and OI highlighted a shift in short-term conviction.

Source: Coinglass
On the other hand, the WIF OI did not drop as sharply. Alongside it, the prices have also trended higher, but OI has not kept pace. Once again, this outlined a weak bearish outlook in the near term.
Realistic or not, here’s PEPE’s market cap in BTC’s terms
Together with Bitcoin’s drop in prices, the possibility of a continued slump if prices were present for both meme coins. Yet, their higher timeframe charts were strongly bullish.
Therefore, buyers could look to add more of these tokens if they revisit key support levels.
Disclaimer: The information presented does not constitute financial, investment, trading, or other types of advice and is solely the writer’s opinion.
- PEPE and WIF noted some bearish sentiment over the previous day
- Their market structure was firmly bullish
Pepe [PEPE] reached a new local high at $0.0000108, as did dogwifhat [WIF] which touched the $3.56 mark. However, the higher timeframes showed that the trend remained bullish.
Yet, with Bitcoin [BTC] down 7% from $73.7k to $68.4k at press time, fears of a market correction had some grounds. Here’s what technical analysis of the meme coin revealed.
The lower timeframe momentum is bullish for both coins

Source: PEPE/USDT on TradingView
The RSI of PEPE on the 4-hour chart remained above the neutral 50 mark throughout March. This showed that the momentum continued to favor the bulls. The market structure was also bullish.
The Fibonacci retracement levels showed that a move to the 61.8%-78.6% region was possible. The OBV has remained flat over the past week to indicate a lack of buying volume. Hence, neither side had control over the market in recent days.
If PEPE begins to drop below the $0.0000079 support zone, buyers could look to re-enter the aforementioned demand zone based on the Fibonacci retracement levels.

Source: WIF/USDT on TradingView
The chart of WIF showed that the memecoin has a bullish trajectory. The trading volume has been high over the past couple of days and the OBV soared upward. This indicated that demand far outweighed the selling pressure.
The RSI was falling below the overbought territory. The momentum has slowed down but was still strongly bullish. The Fibonacci levels plotted were tentative, as the move upward has not yet finished.
The $3 psychological support zone has held firm thus far, but a drop below this level could see the $2.17-$2.46 area retested. This would likely provide a bullish reaction.
Speculative bullish conviction for WIF stood firm, but not PEPE
Combining the price action with the Open Interest charts of the meme coins gives insights into what the speculators feel. While WIF showed bullishness, PEPE traders were not as optimistic.

Source: Coinglass
Since the 14th of March, the OI has begun to decline. During that time the price of PEPE declined by more than 10%. The drop in prices and OI highlighted a shift in short-term conviction.

Source: Coinglass
On the other hand, the WIF OI did not drop as sharply. Alongside it, the prices have also trended higher, but OI has not kept pace. Once again, this outlined a weak bearish outlook in the near term.
Realistic or not, here’s PEPE’s market cap in BTC’s terms
Together with Bitcoin’s drop in prices, the possibility of a continued slump if prices were present for both meme coins. Yet, their higher timeframe charts were strongly bullish.
Therefore, buyers could look to add more of these tokens if they revisit key support levels.
Disclaimer: The information presented does not constitute financial, investment, trading, or other types of advice and is solely the writer’s opinion.


order generic clomiphene without insurance can you get clomid pills where buy generic clomid without prescription can i order clomid without a prescription how much does clomid cost without insurance how to get cheap clomiphene without dr prescription cost of cheap clomiphene without a prescription
With thanks. Loads of knowledge!
More posts like this would create the online play more useful.
buy generic azithromycin online – buy tinidazole paypal buy flagyl online cheap
order motilium 10mg pill – buy generic tetracycline over the counter brand cyclobenzaprine 15mg
buy propranolol generic – oral inderal 20mg cheap methotrexate 2.5mg
augmentin 625mg pill – atbioinfo purchase ampicillin generic
brand nexium 20mg – nexiumtous order esomeprazole 20mg capsules
order coumadin pill – cou mamide cozaar tablet
order mobic 7.5mg – tenderness mobic 15mg pills
prednisone 10mg ca – https://apreplson.com/ buy prednisone tablets
buy erectile dysfunction drugs – https://fastedtotake.com/ buy ed pills for sale
buy generic amoxicillin for sale – generic amoxil buy amoxicillin pill
buy lexapro generic – buy escitalopram generic lexapro 10mg drug
cenforce 100mg ca – this order cenforce 100mg pill
buy cialis canada – site is generic cialis available in canada
uses for cialis – https://strongtadafl.com/ maxim peptide tadalafil citrate
order ranitidine 150mg pills – on this site buy zantac 150mg generic
This is a topic which is forthcoming to my callousness… Numberless thanks! Faithfully where can I find the contact details in the course of questions? tamoxifen where to buy
cheap viagra mexico – https://strongvpls.com/ cheap viagra no prescription online
More articles like this would remedy the blogosphere richer. https://buyfastonl.com/gabapentin.html
This is the type of enter I turn up helpful. https://ursxdol.com/get-cialis-professional/
This is the make of advise I turn up helpful. https://prohnrg.com/product/rosuvastatin-for-sale/
More articles like this would pretence of the blogosphere richer. cenforce 150 posologie
The thoroughness in this section is noteworthy.
https://doxycyclinege.com/pro/dutasteride/
The thoroughness in this break down is noteworthy. http://seafishzone.com/home.php?mod=space&uid=2291209
purchase forxiga generic – forxiga 10 mg canada dapagliflozin 10mg pills
xenical over the counter – this orlistat order