- The prices of NOT and WIF have declined in the last week.
- This has been due to a surge in profit-taking activity.
Notcoin [NOT] and dogwifhat [WIF] have shed their most recent gains. The two altcoins have witnessed double-digit price declines in the past seven days.
According to CoinMarketCap, NOT’s value dropped by 35%, while WIF’s price dipped by 21%. At press time, NOT exchanged hands at $0.016, and the memecoin WIF traded at $2.62.
NOT braces for more dip
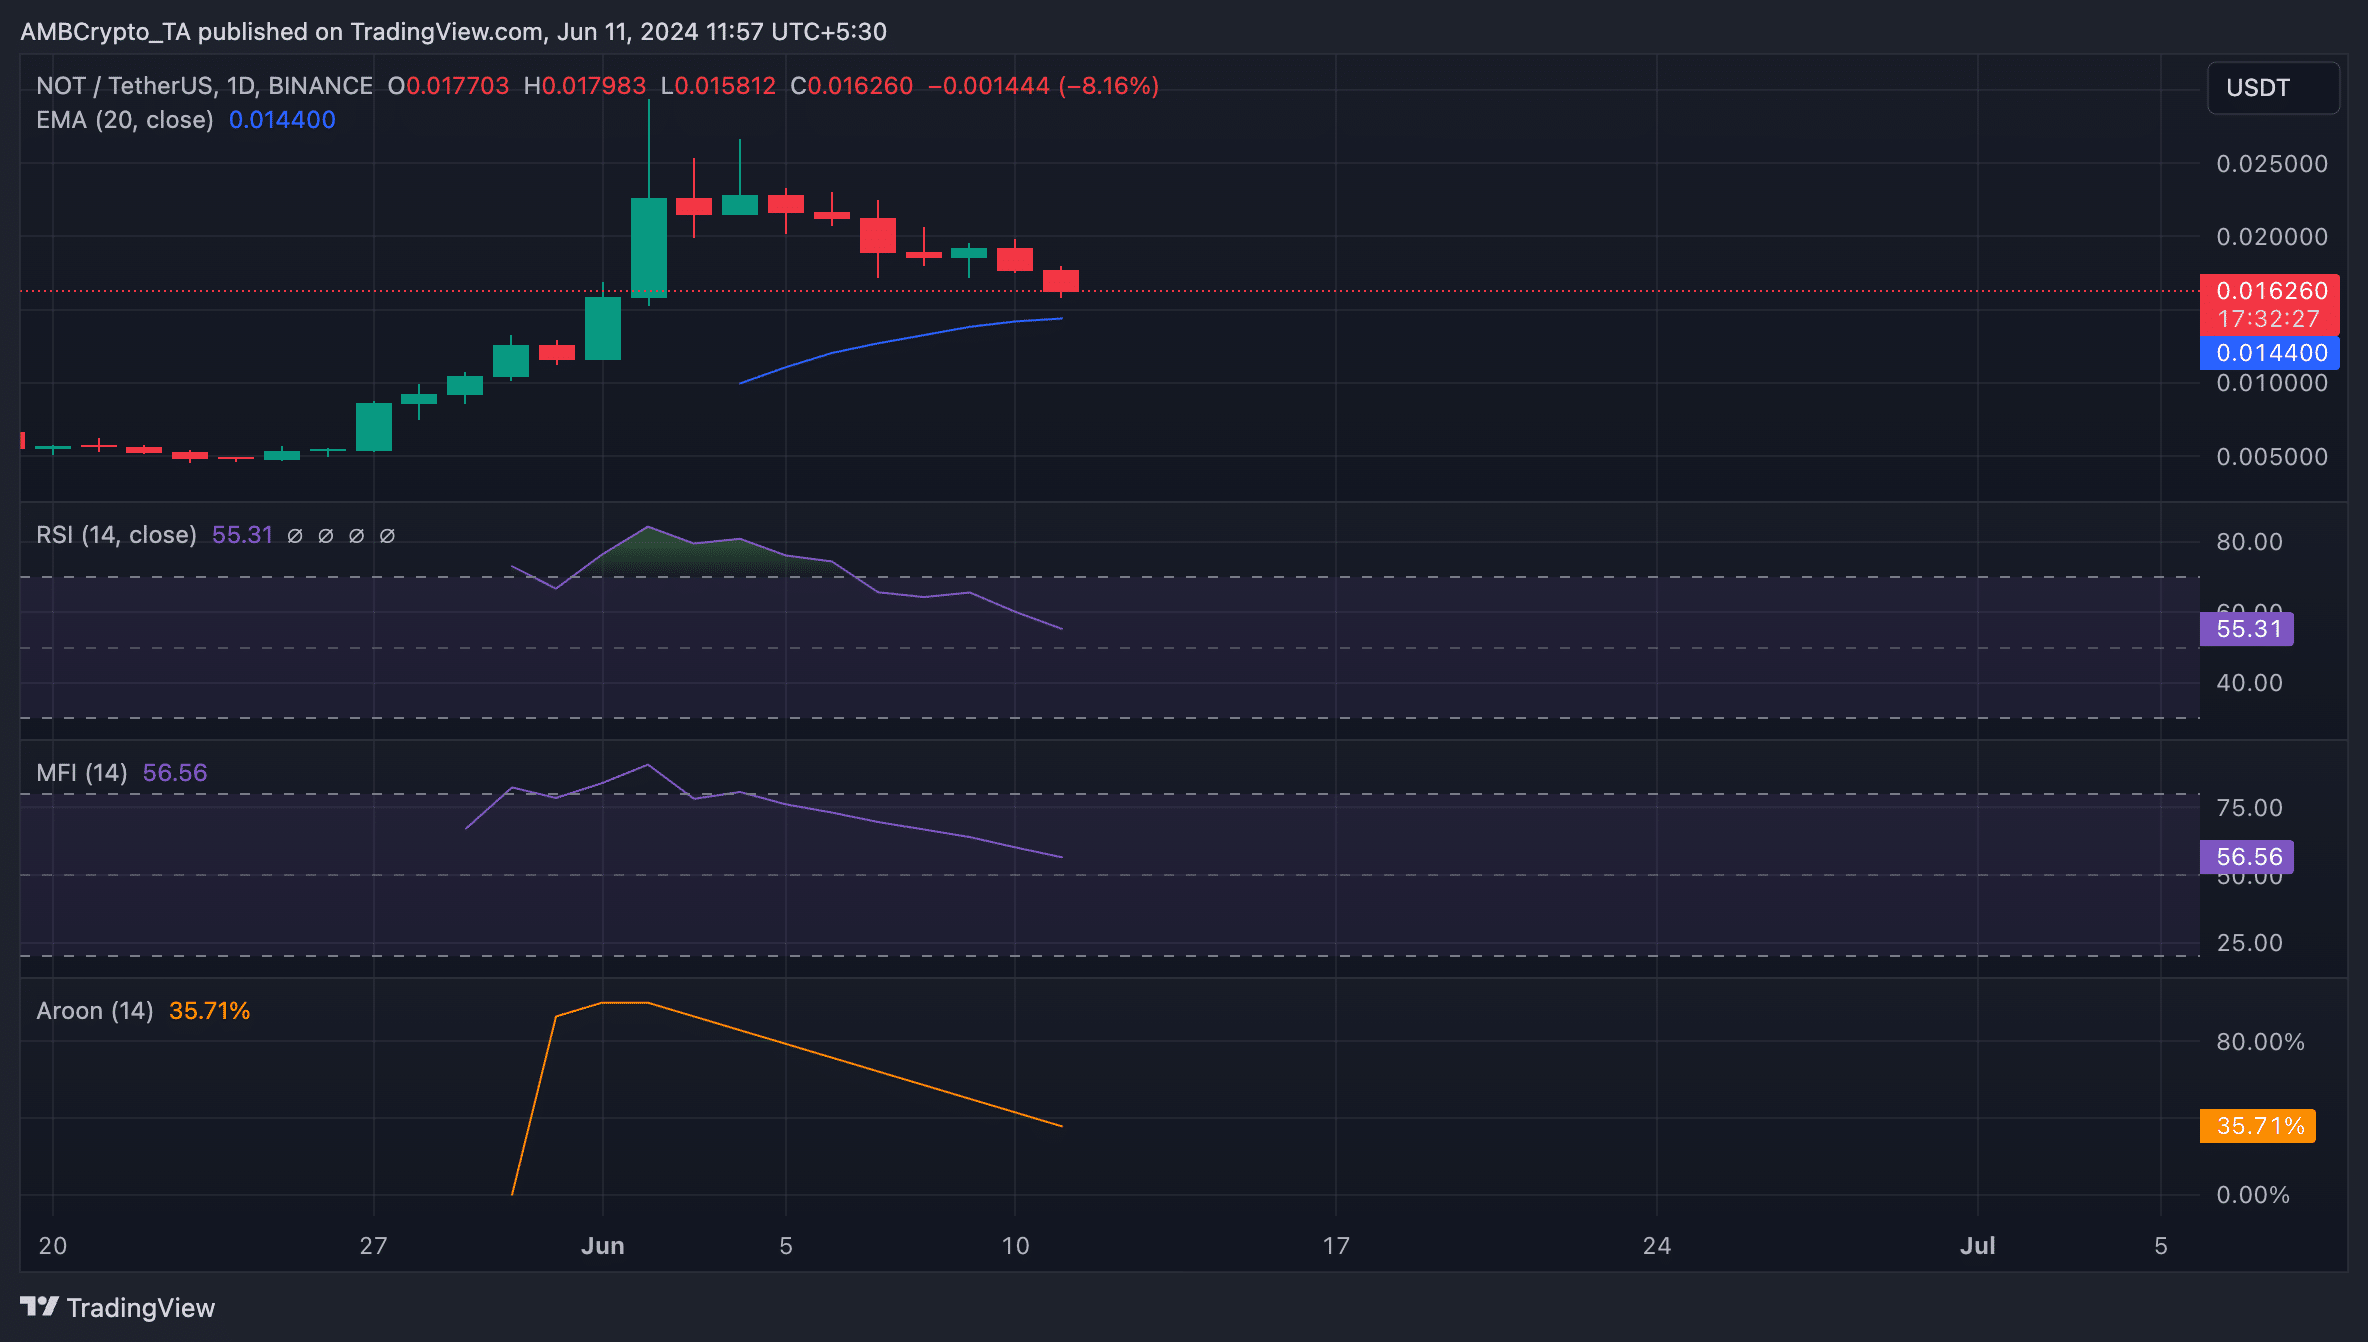
Following its launch on the Toncoin network on 16th May, NOT’s value climbed to a peak of $0.02 on 2nd June.
However, as profit-taking activity gained momentum, NOT bulls could not defend that price level, hence the price decline. At its current value, the altcoin’s price has dropped by 20% from its high.
An assessment of key momentum indicators confirmed the surge in NOT sell-offs in the past few days.
For example, its Relative Strength Index (RSI) and Money Flow Index (MFI) trended toward their respective center lines. At press time, the token’s RSI and MFI were 55.31 and 56.56, confirming the decline in buying pressure.
Further, the value of NOT’s Aroon Up Line (orange) was 35% at the time of writing. This indicator identifies the strength of an asset’s price trends and potential reversal points.
When an asset’s Aroon Up line is close to zero, the uptrend is weak, and the most recent high was reached a long time ago.
At its current price, NOT traded close to its 20-day exponential moving average (EMA), which tracks the token’s average price in the past 20 days.
When an asset trades close to this key moving average, it signals a decline in buying momentum and an indication that the bears might soon regain market control.

Source: TradingView
WIF sellers take charge
Regarding WIF, its performance has not been any different, as the bearish bias toward the leading meme coin remains significant.
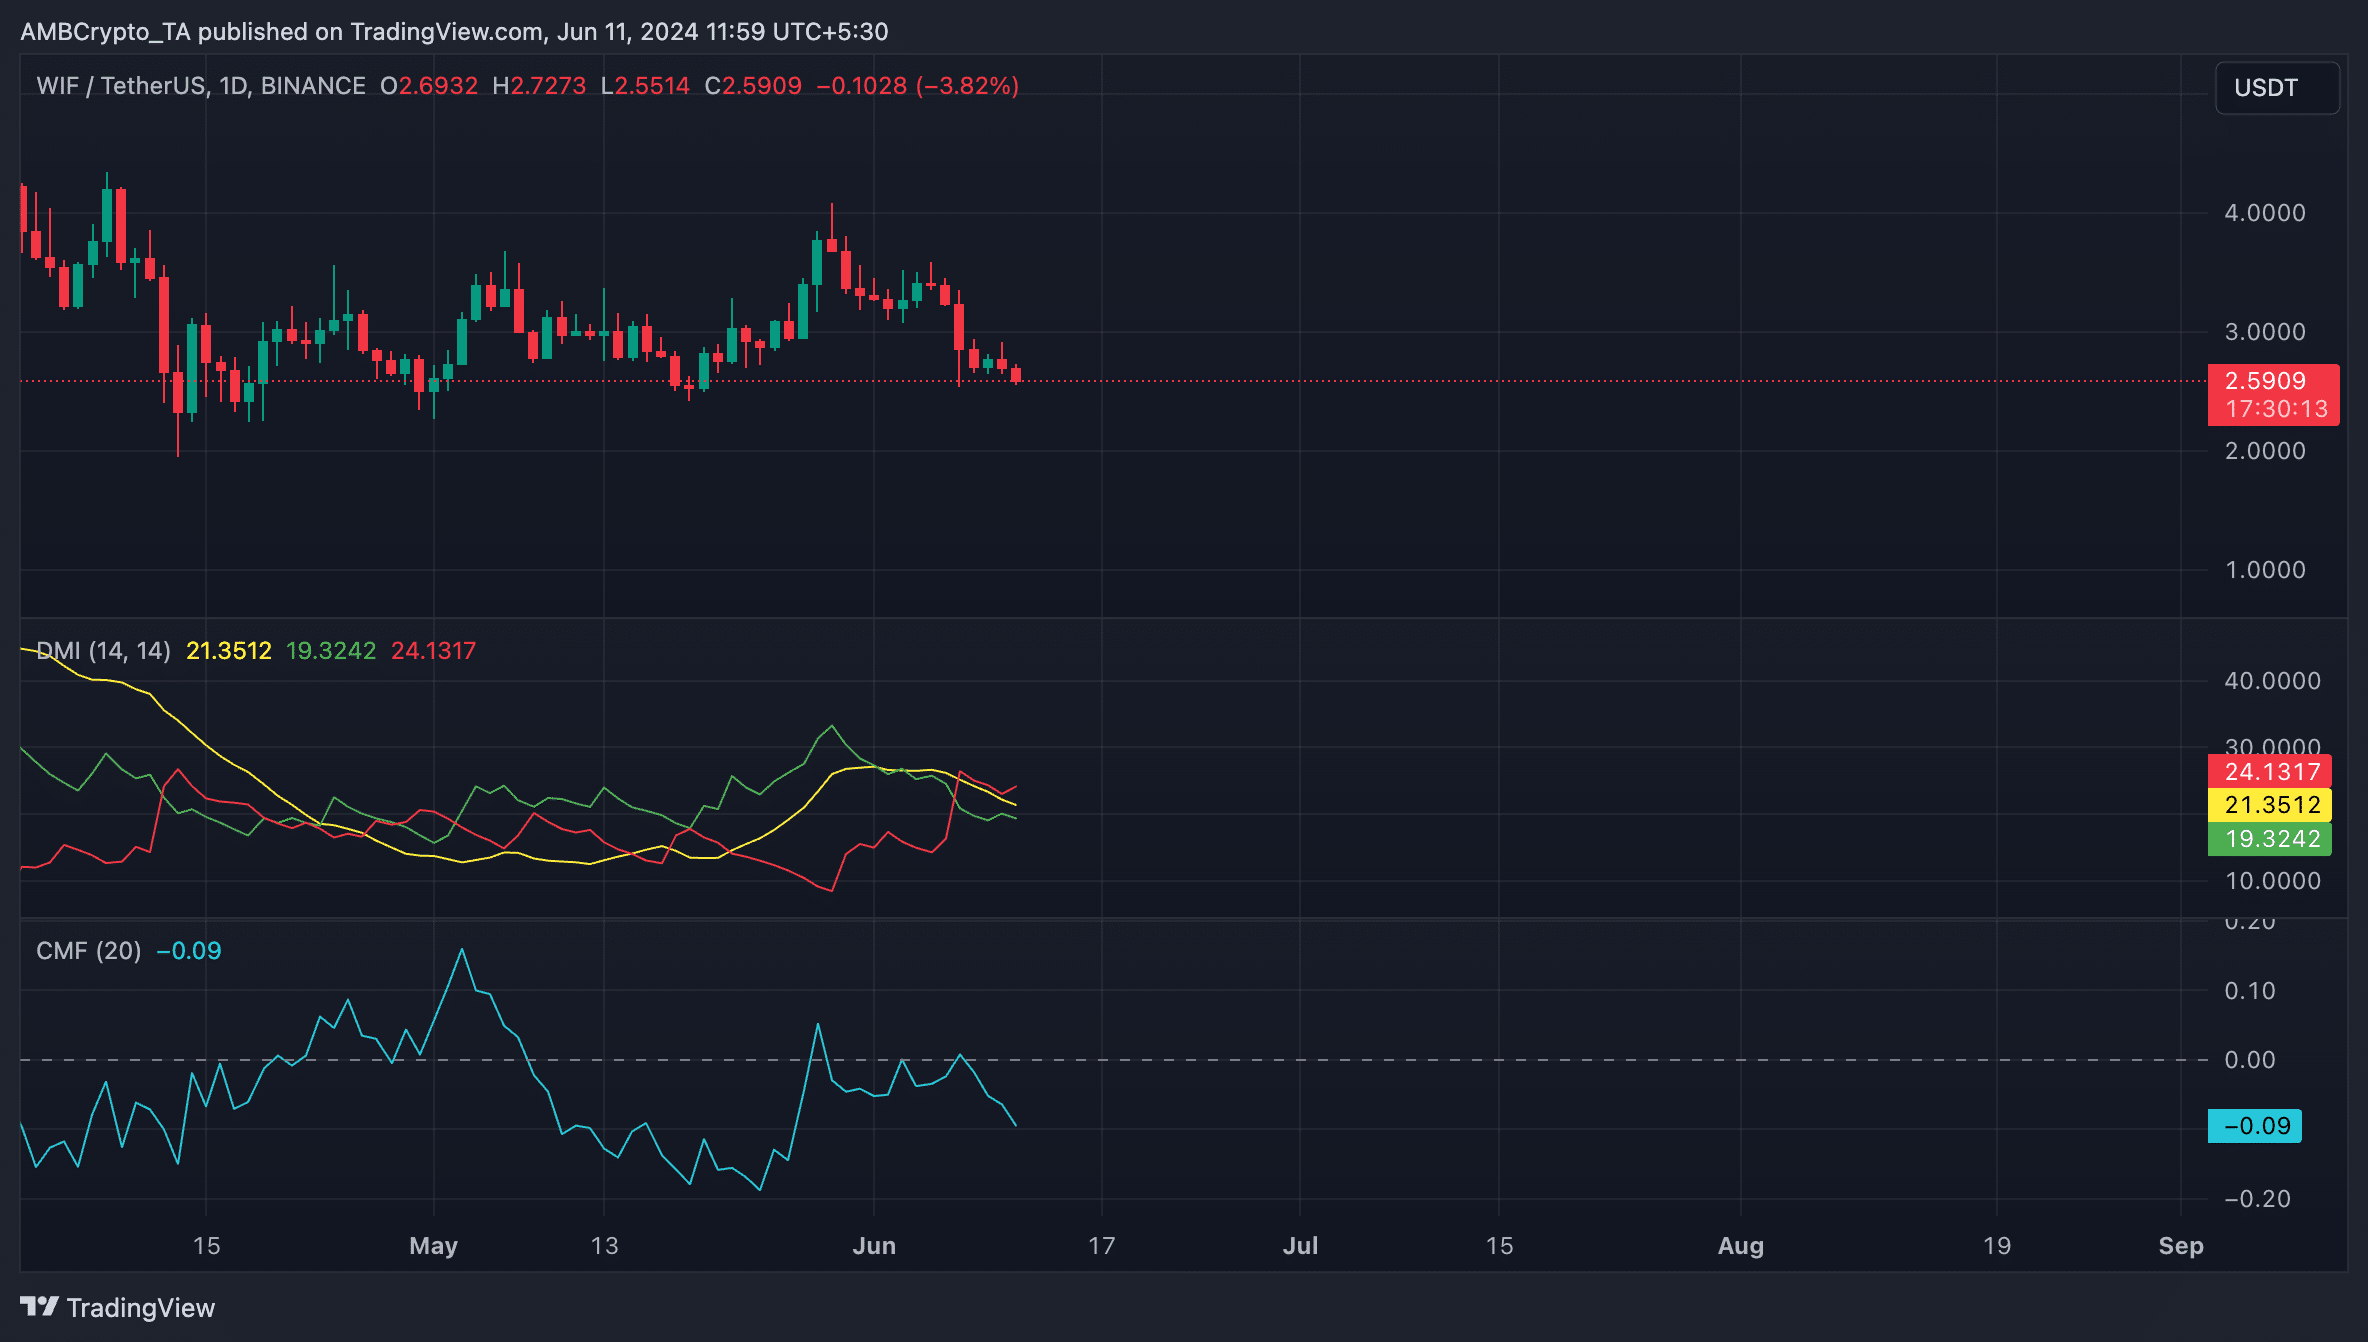
For example, its Chaikin Money Flow (CMF) rested below the zero line to return a value of -0.09 at press time.
This indicator measures the flow of money into and out of the WIF market. When its value is negative, it signals liquidity outflow from the market, which is a bearish sign and a precursor to a further price decline.
Realistic or not, here’s NOT’s market cap in SOL terms
Also, readings from WIF’s Directional Movement Index (DMI) showed its positive directional index (green) resting below its negative index (red).

Source: TradingView
This means that bear strength is more significant than bull strength. It is interpreted as a signal that the sellers have market control.
- The prices of NOT and WIF have declined in the last week.
- This has been due to a surge in profit-taking activity.
Notcoin [NOT] and dogwifhat [WIF] have shed their most recent gains. The two altcoins have witnessed double-digit price declines in the past seven days.
According to CoinMarketCap, NOT’s value dropped by 35%, while WIF’s price dipped by 21%. At press time, NOT exchanged hands at $0.016, and the memecoin WIF traded at $2.62.
NOT braces for more dip
Following its launch on the Toncoin network on 16th May, NOT’s value climbed to a peak of $0.02 on 2nd June.
However, as profit-taking activity gained momentum, NOT bulls could not defend that price level, hence the price decline. At its current value, the altcoin’s price has dropped by 20% from its high.
An assessment of key momentum indicators confirmed the surge in NOT sell-offs in the past few days.
For example, its Relative Strength Index (RSI) and Money Flow Index (MFI) trended toward their respective center lines. At press time, the token’s RSI and MFI were 55.31 and 56.56, confirming the decline in buying pressure.
Further, the value of NOT’s Aroon Up Line (orange) was 35% at the time of writing. This indicator identifies the strength of an asset’s price trends and potential reversal points.
When an asset’s Aroon Up line is close to zero, the uptrend is weak, and the most recent high was reached a long time ago.
At its current price, NOT traded close to its 20-day exponential moving average (EMA), which tracks the token’s average price in the past 20 days.
When an asset trades close to this key moving average, it signals a decline in buying momentum and an indication that the bears might soon regain market control.

Source: TradingView
WIF sellers take charge
Regarding WIF, its performance has not been any different, as the bearish bias toward the leading meme coin remains significant.
For example, its Chaikin Money Flow (CMF) rested below the zero line to return a value of -0.09 at press time.
This indicator measures the flow of money into and out of the WIF market. When its value is negative, it signals liquidity outflow from the market, which is a bearish sign and a precursor to a further price decline.
Realistic or not, here’s NOT’s market cap in SOL terms
Also, readings from WIF’s Directional Movement Index (DMI) showed its positive directional index (green) resting below its negative index (red).

Source: TradingView
This means that bear strength is more significant than bull strength. It is interpreted as a signal that the sellers have market control.


where can i buy cheap clomiphene tablets can i get clomiphene online can i order generic clomid for sale can i purchase generic clomiphene without insurance where to buy cheap clomiphene pill can i buy clomid tablets where to buy cheap clomid without dr prescription
This is the kind of advise I find helpful.
purchase azithromycin online – sumycin 250mg us order flagyl 200mg without prescription
purchase semaglutide pills – where can i buy semaglutide buy cyproheptadine 4 mg generic
buy domperidone tablets – buy flexeril 15mg generic buy flexeril 15mg for sale
augmentin 375mg pill – https://atbioinfo.com/ buy acillin
esomeprazole 40mg uk – https://anexamate.com/ esomeprazole us
buy warfarin generic – anticoagulant cheap cozaar 50mg
buy cheap ed pills – generic ed pills ed pills that work
cheap amoxil generic – cheap generic amoxicillin cheap amoxil
buy cenforce for sale – order cenforce 50mg without prescription buy cenforce 100mg pills
cialis tadalafil 20mg kaufen – https://ciltadgn.com/# where to buy cialis cheap
cialis 2.5 mg – https://strongtadafl.com/ cialis 5mg best price
viagra sale hyderabad – strong vpls generic sildenafil 100mg
Good blog you procure here.. It’s obdurate to assign high status belles-lettres like yours these days. I justifiably respect individuals like you! Withstand mindfulness!! efectos secundarios lasix
More content pieces like this would urge the web better. https://buyfastonl.com/
Proof blog you be undergoing here.. It’s severely to on strong quality belles-lettres like yours these days. I truly recognize individuals like you! Rent mindfulness!! https://ursxdol.com/amoxicillin-antibiotic/
Thanks on putting this up. It’s evidently done. https://prohnrg.com/product/omeprazole-20-mg/
This website exceedingly has all of the low-down and facts I needed about this participant and didn’t know who to ask. fildena xxx 100mg
Thanks for putting this up. It’s understandably done. https://ondactone.com/product/domperidone/
This is the kind of delivery I find helpful.
avodart online order
This website absolutely has all of the bumf and facts I needed there this subject and didn’t know who to ask. http://www.cs-tygrysek.ugu.pl/member.php?action=profile&uid=98427
buy dapagliflozin cheap – buy dapagliflozin for sale dapagliflozin pills
buy xenical cheap – https://asacostat.com/# cost xenical 120mg