- ETH found critical support at key levels.
- Network growth showed more ETH addresses popping up.
Ethereum’s[ETH] price is finding strong support between $3,700 and $3,810, where 3 million addresses have accumulated 4.6 million ETH. This critical accumulation zone reflects growing investor confidence and provides a cushion against potential bearish pressures.
With strong demand-supply dynamics and key Fibonacci levels pointing to $5,000 as a plausible target, Ethereum’s bullish case continues to strengthen.
Support levels and accumulation zones
Analysis of Ethereum’s price trajectory reveals a robust demand zone between $3,700 and $3,810. According to data from IntoTheBlock, approximately three million addresses accumulated 4.6 million ETH around this price range.
Analysis showed that this level emerges as a critical support area, providing a cushion against potential bearish pressures. The strong accumulation here reflects investor confidence and hints at the possibility of sustained bullish momentum.
Ethereum network growth reaches new highs
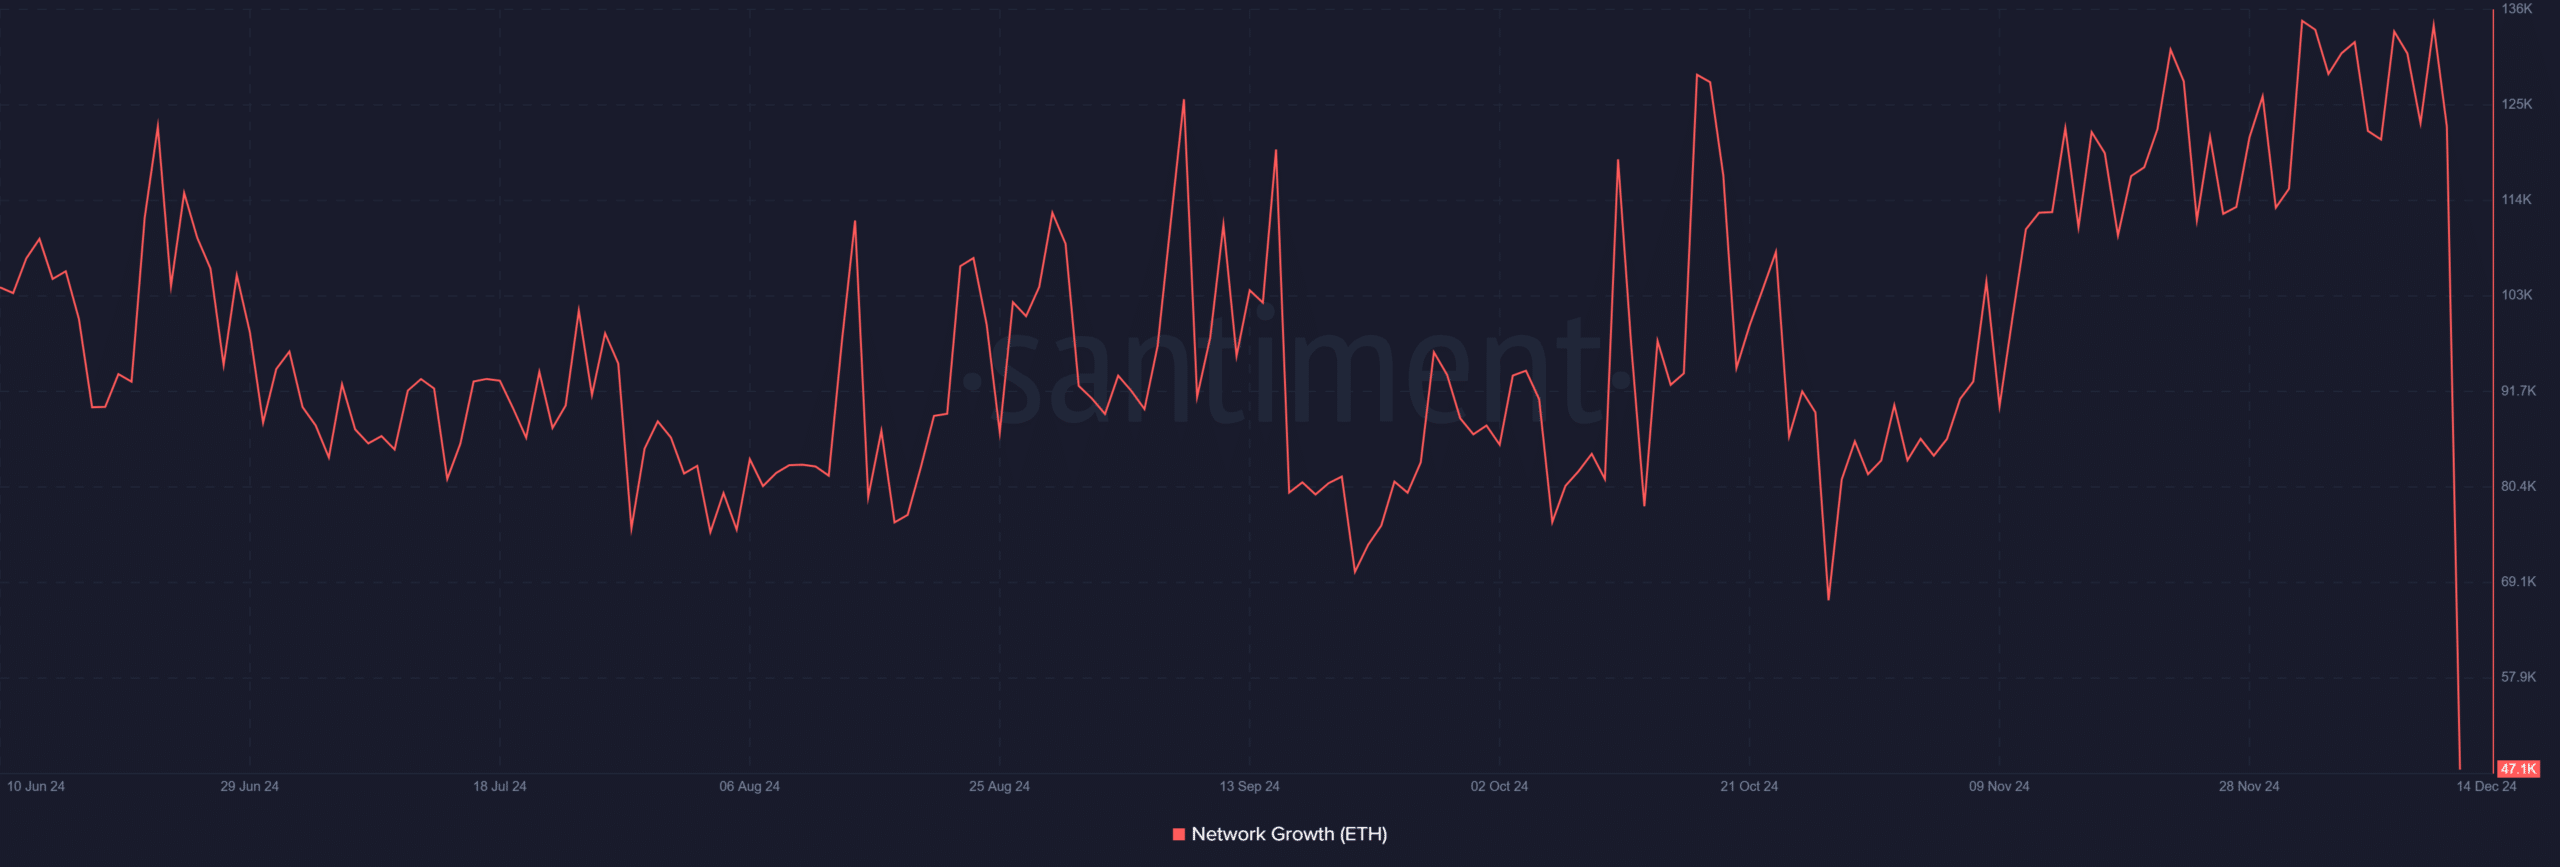
According to an analysis of the Ethereum network growth on Santiment, there has been a significant increase. The analysis showed an average of 130,200 new wallets created daily in December.
This marks an 8-month-high, indicating renewed interest in ETH as it garners attention from both retail and institutional participants.

Source: Santiment
Furthermore, this uptick in wallet creation suggests that Ethereum’s network activity is expanding, reinforcing the idea of a growing user base and heightened transactional activity.
Realized price upper band signals bullish potential
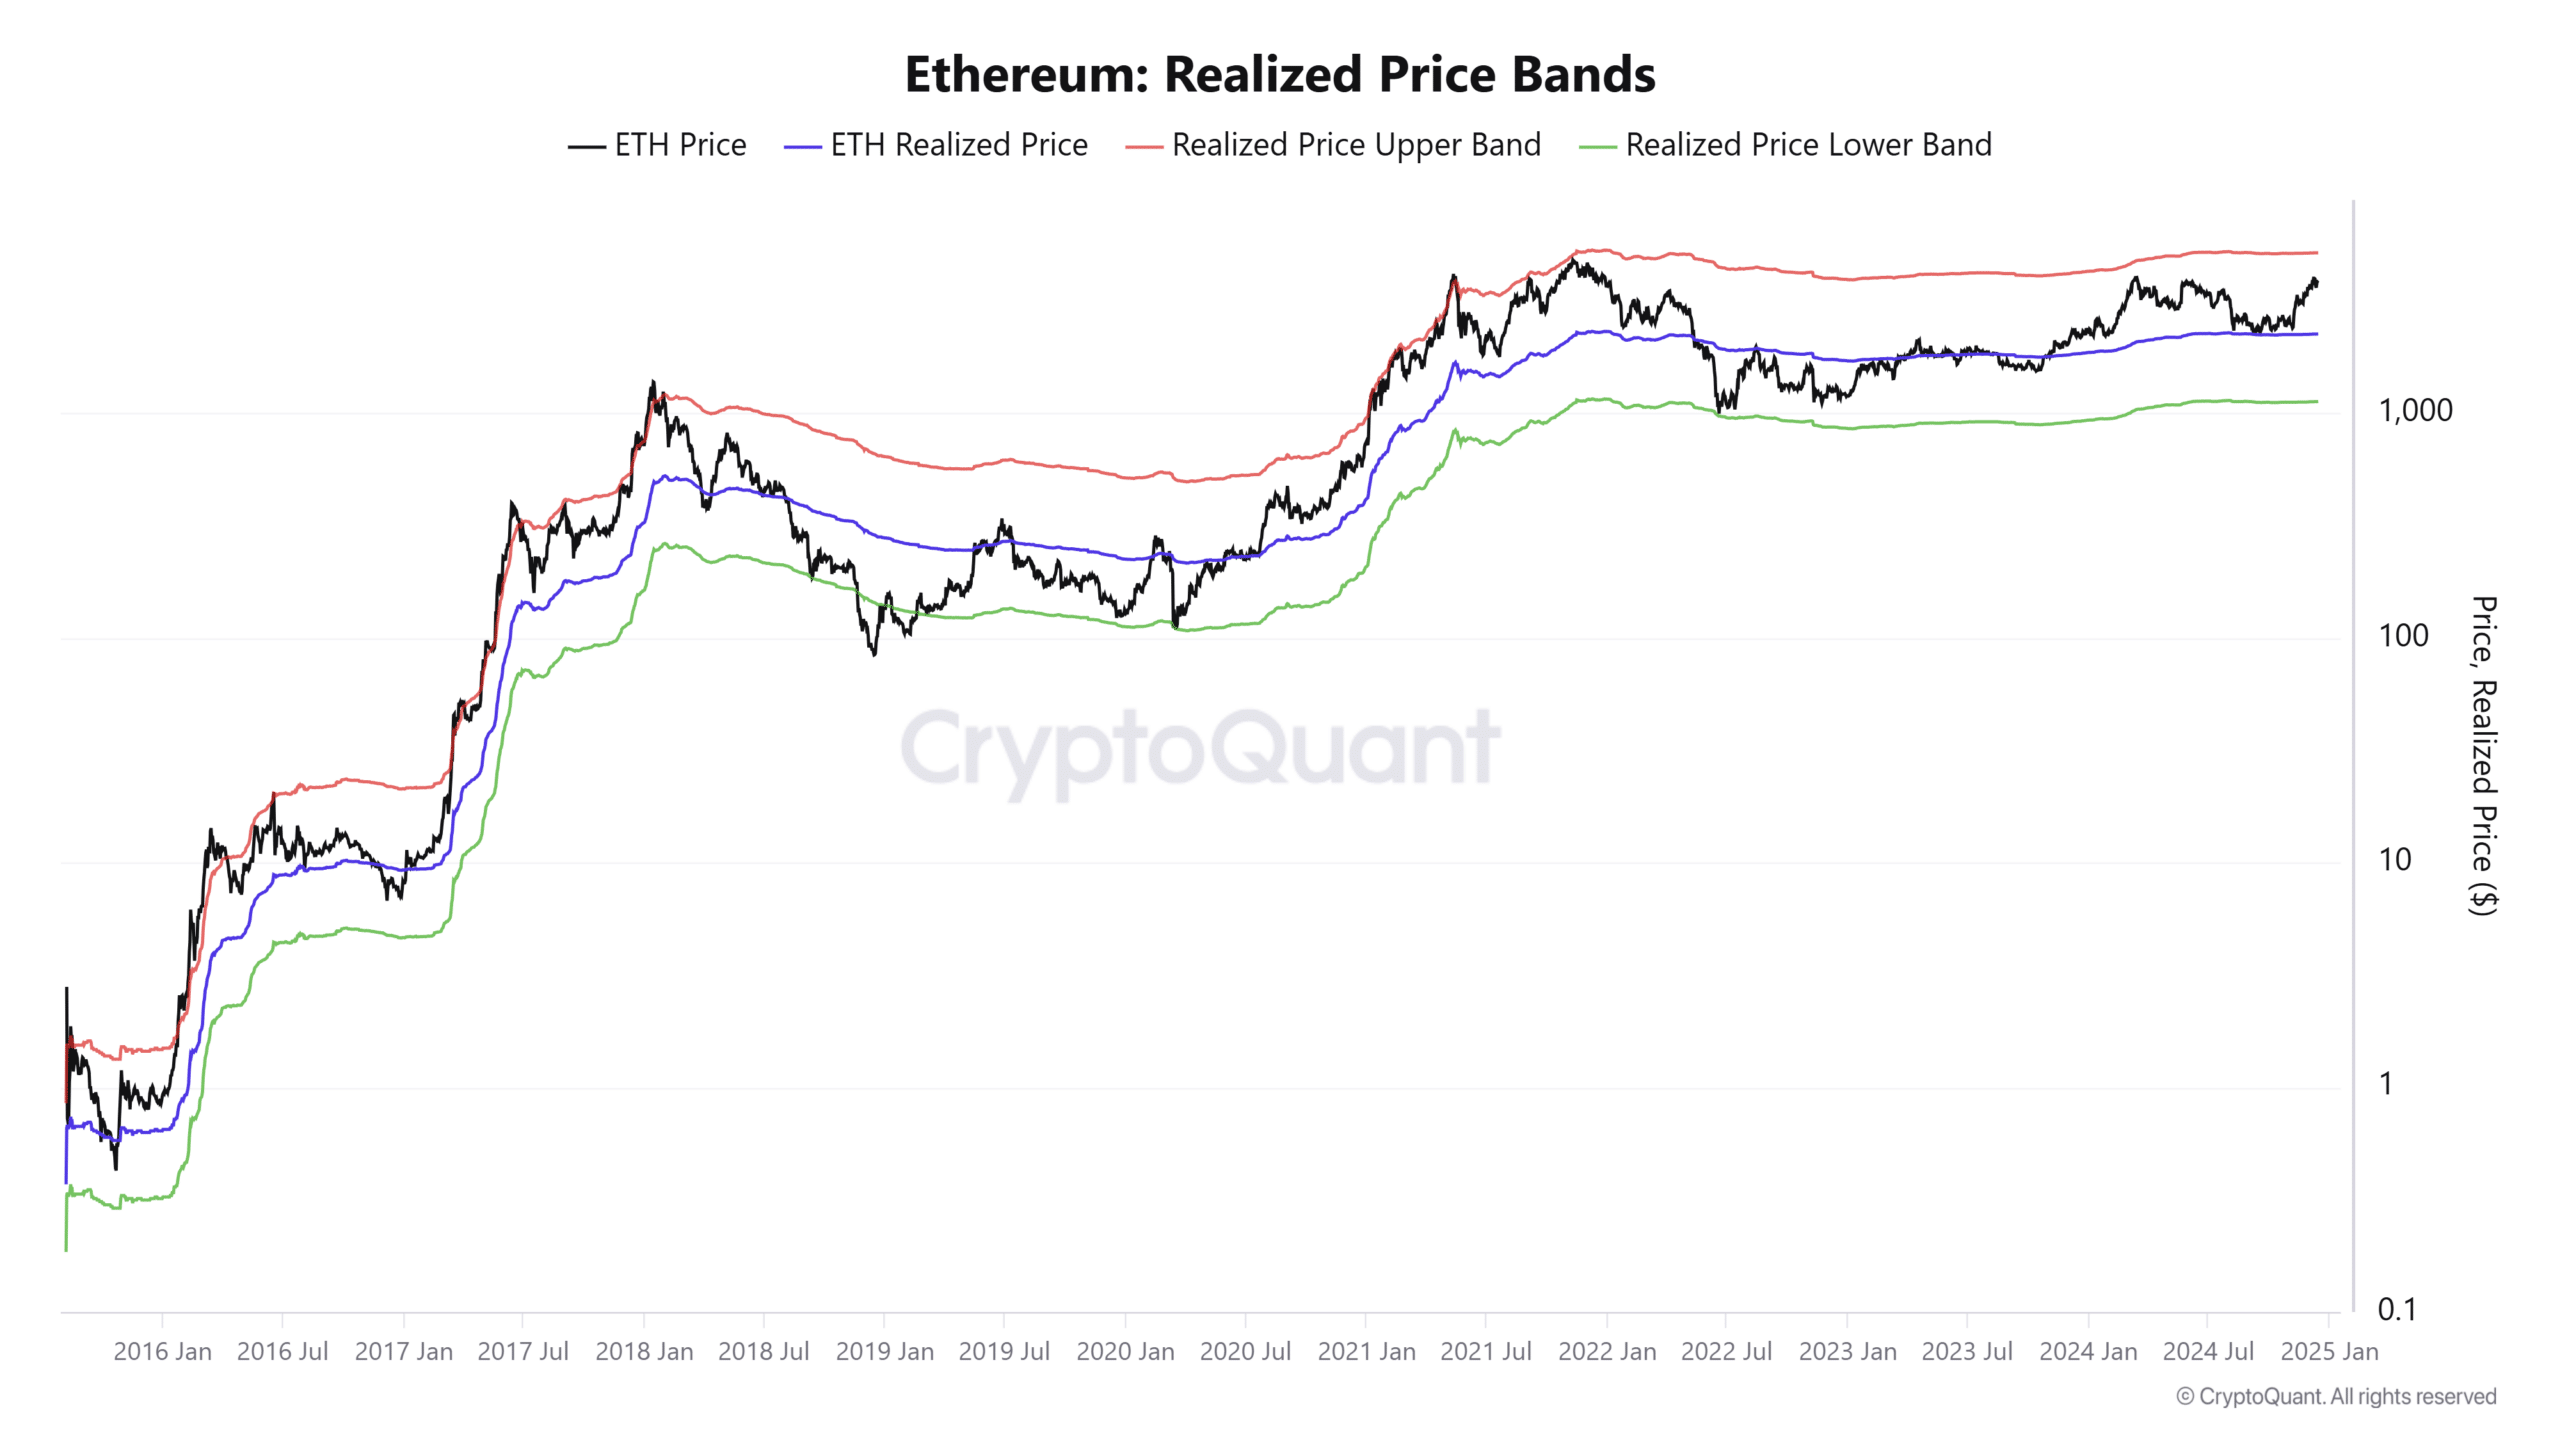
The realized price upper band, currently at $5,200, aligns with Ethereum’s 2021 bull run peak. This level is a psychological barrier and a potential price target in the ongoing bullish cycle.

Source: CryptoQuant
Also, Ethereum’s realized price, at $2,300, reflects the average acquisition cost across the network, underscoring the profitability of current holders.
With the spot price hovering around $3,900, the gap between the realized price and the upper band highlights room for further upward movement.
Ethereum Fibonacci extension levels signal…
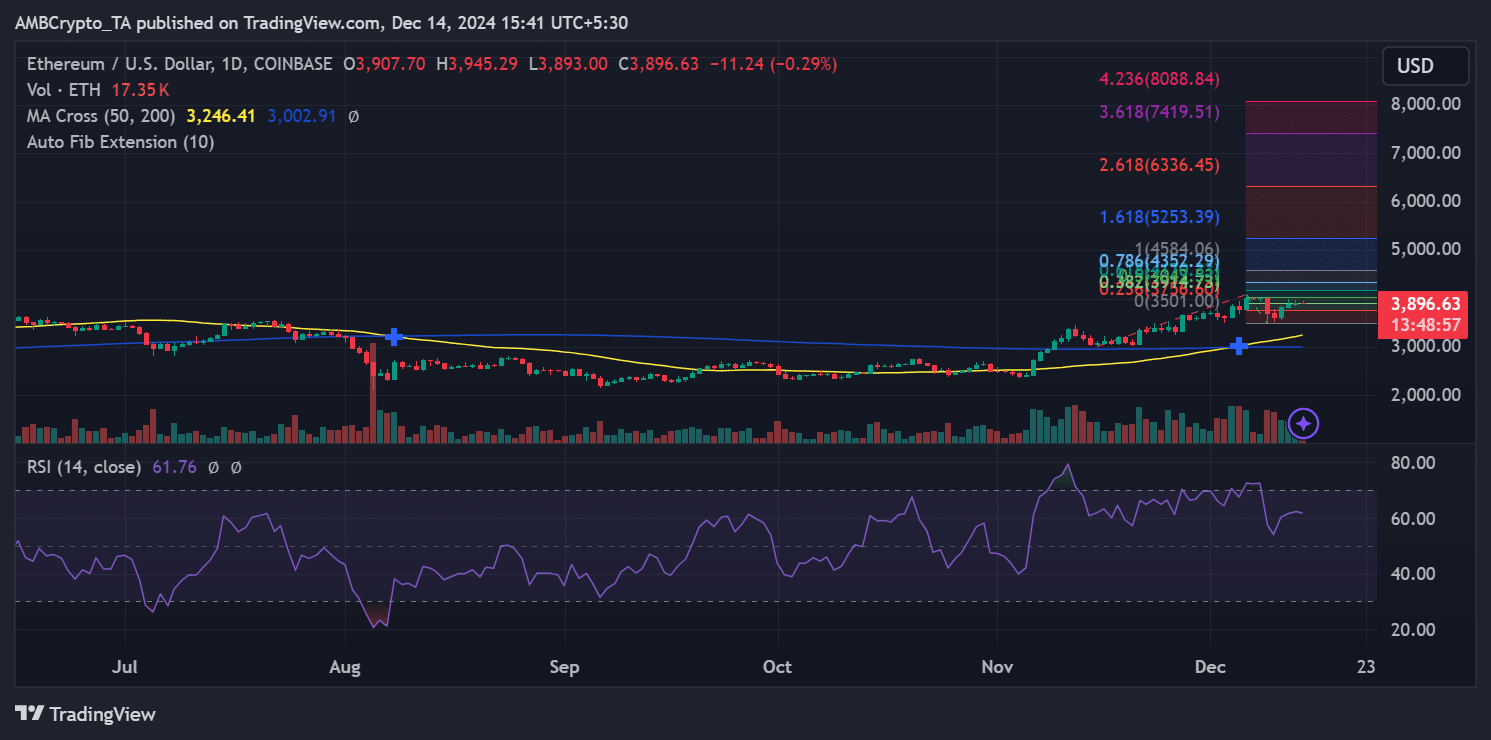
At press time, Ethereum was trading at $3,896. Key technical levels provide insight into its potential path forward. Analysis using the Fibonacci extension tool highlights critical resistance and target levels.
Ethereum was approaching the 1.618 Fibonacci extension level at $5,253, which closely aligns with its realized price upper band of $5,200.
Breaking past this level would indicate strong bullish momentum, potentially setting the stage for a rally toward the 2.618 extension at $6,336 and beyond.

Source: TradingView
The intermediate resistance for Ethereum lies at $4,278, a significant hurdle identified by the 0.786 Fibonacci retracement level.
Conquering this level could pave the way for further upward momentum, pushing ETH closer to the psychological $5,000 mark. On the downside, immediate support is near $3,700, aligning with the critical accumulation zone.
Supply dynamics and implications for $5K
Favorable demand-supply dynamics are boosting Ethereum’s price action. The concentration of holdings in the $3,700–$3,810 range and the rapid expansion of active addresses show sustained interest from long-term investors and new entrants.
If Ethereum maintains its current trajectory and breaks key resistance levels, the $5,000 mark could become a reality sooner than expected.
Read Ethereum (ETH) Price Prediction 2024-25
Ethereum’s journey toward $5,000 is supported by strong accumulation zones, record-breaking network growth, and key Fibonacci extension levels that align with historical price metrics.
These converging factors highlight a well-supported bullish case for ETH, with the potential to break above $5,000 as demand and technical momentum strengthen.
- ETH found critical support at key levels.
- Network growth showed more ETH addresses popping up.
Ethereum’s[ETH] price is finding strong support between $3,700 and $3,810, where 3 million addresses have accumulated 4.6 million ETH. This critical accumulation zone reflects growing investor confidence and provides a cushion against potential bearish pressures.
With strong demand-supply dynamics and key Fibonacci levels pointing to $5,000 as a plausible target, Ethereum’s bullish case continues to strengthen.
Support levels and accumulation zones
Analysis of Ethereum’s price trajectory reveals a robust demand zone between $3,700 and $3,810. According to data from IntoTheBlock, approximately three million addresses accumulated 4.6 million ETH around this price range.
Analysis showed that this level emerges as a critical support area, providing a cushion against potential bearish pressures. The strong accumulation here reflects investor confidence and hints at the possibility of sustained bullish momentum.
Ethereum network growth reaches new highs
According to an analysis of the Ethereum network growth on Santiment, there has been a significant increase. The analysis showed an average of 130,200 new wallets created daily in December.
This marks an 8-month-high, indicating renewed interest in ETH as it garners attention from both retail and institutional participants.

Source: Santiment
Furthermore, this uptick in wallet creation suggests that Ethereum’s network activity is expanding, reinforcing the idea of a growing user base and heightened transactional activity.
Realized price upper band signals bullish potential
The realized price upper band, currently at $5,200, aligns with Ethereum’s 2021 bull run peak. This level is a psychological barrier and a potential price target in the ongoing bullish cycle.

Source: CryptoQuant
Also, Ethereum’s realized price, at $2,300, reflects the average acquisition cost across the network, underscoring the profitability of current holders.
With the spot price hovering around $3,900, the gap between the realized price and the upper band highlights room for further upward movement.
Ethereum Fibonacci extension levels signal…
At press time, Ethereum was trading at $3,896. Key technical levels provide insight into its potential path forward. Analysis using the Fibonacci extension tool highlights critical resistance and target levels.
Ethereum was approaching the 1.618 Fibonacci extension level at $5,253, which closely aligns with its realized price upper band of $5,200.
Breaking past this level would indicate strong bullish momentum, potentially setting the stage for a rally toward the 2.618 extension at $6,336 and beyond.

Source: TradingView
The intermediate resistance for Ethereum lies at $4,278, a significant hurdle identified by the 0.786 Fibonacci retracement level.
Conquering this level could pave the way for further upward momentum, pushing ETH closer to the psychological $5,000 mark. On the downside, immediate support is near $3,700, aligning with the critical accumulation zone.
Supply dynamics and implications for $5K
Favorable demand-supply dynamics are boosting Ethereum’s price action. The concentration of holdings in the $3,700–$3,810 range and the rapid expansion of active addresses show sustained interest from long-term investors and new entrants.
If Ethereum maintains its current trajectory and breaks key resistance levels, the $5,000 mark could become a reality sooner than expected.
Read Ethereum (ETH) Price Prediction 2024-25
Ethereum’s journey toward $5,000 is supported by strong accumulation zones, record-breaking network growth, and key Fibonacci extension levels that align with historical price metrics.
These converging factors highlight a well-supported bullish case for ETH, with the potential to break above $5,000 as demand and technical momentum strengthen.


![What Is Asset Tokenization? Types, Why It Matters Now [2025]](https://coininsights.com/wp-content/uploads/2025/05/asset_tokenization-360x180.png)


BWER Company provides Iraq’s leading-edge weighbridge solutions, designed to withstand harsh environments while delivering top-tier performance and accuracy.
can i get cheap clomid tablets can i order generic clomiphene without a prescription clomid generic cost can i purchase clomid pills can you buy clomid without insurance can i order clomiphene without insurance buying cheap clomid pill
Greetings! Very serviceable advice within this article! It’s the little changes which will make the largest changes. Thanks a lot for sharing!
This is the tolerant of post I unearth helpful.
azithromycin 250mg us – buy tindamax cheap purchase flagyl without prescription
semaglutide 14 mg brand – purchase cyproheptadine pills cyproheptadine 4mg pill