- Ethereum’s bullish structure hinges on holding the critical support level at $1,721.40.
- Large investors shift to Ethereum ETFs, boosting transaction volumes and market interest.
Ethereum [ETH] has experienced a price decline of 3.60% over the past seven days, underperforming the global crypto market, which saw a modest increase of 0.70%.
At press time, Ethereum traded at $3,316.71, with a 24-hour trading volume of $13,185,794,355. This marks a 0.73% decline in the last 24 hours.
Ethereum: Key support and resistance levels
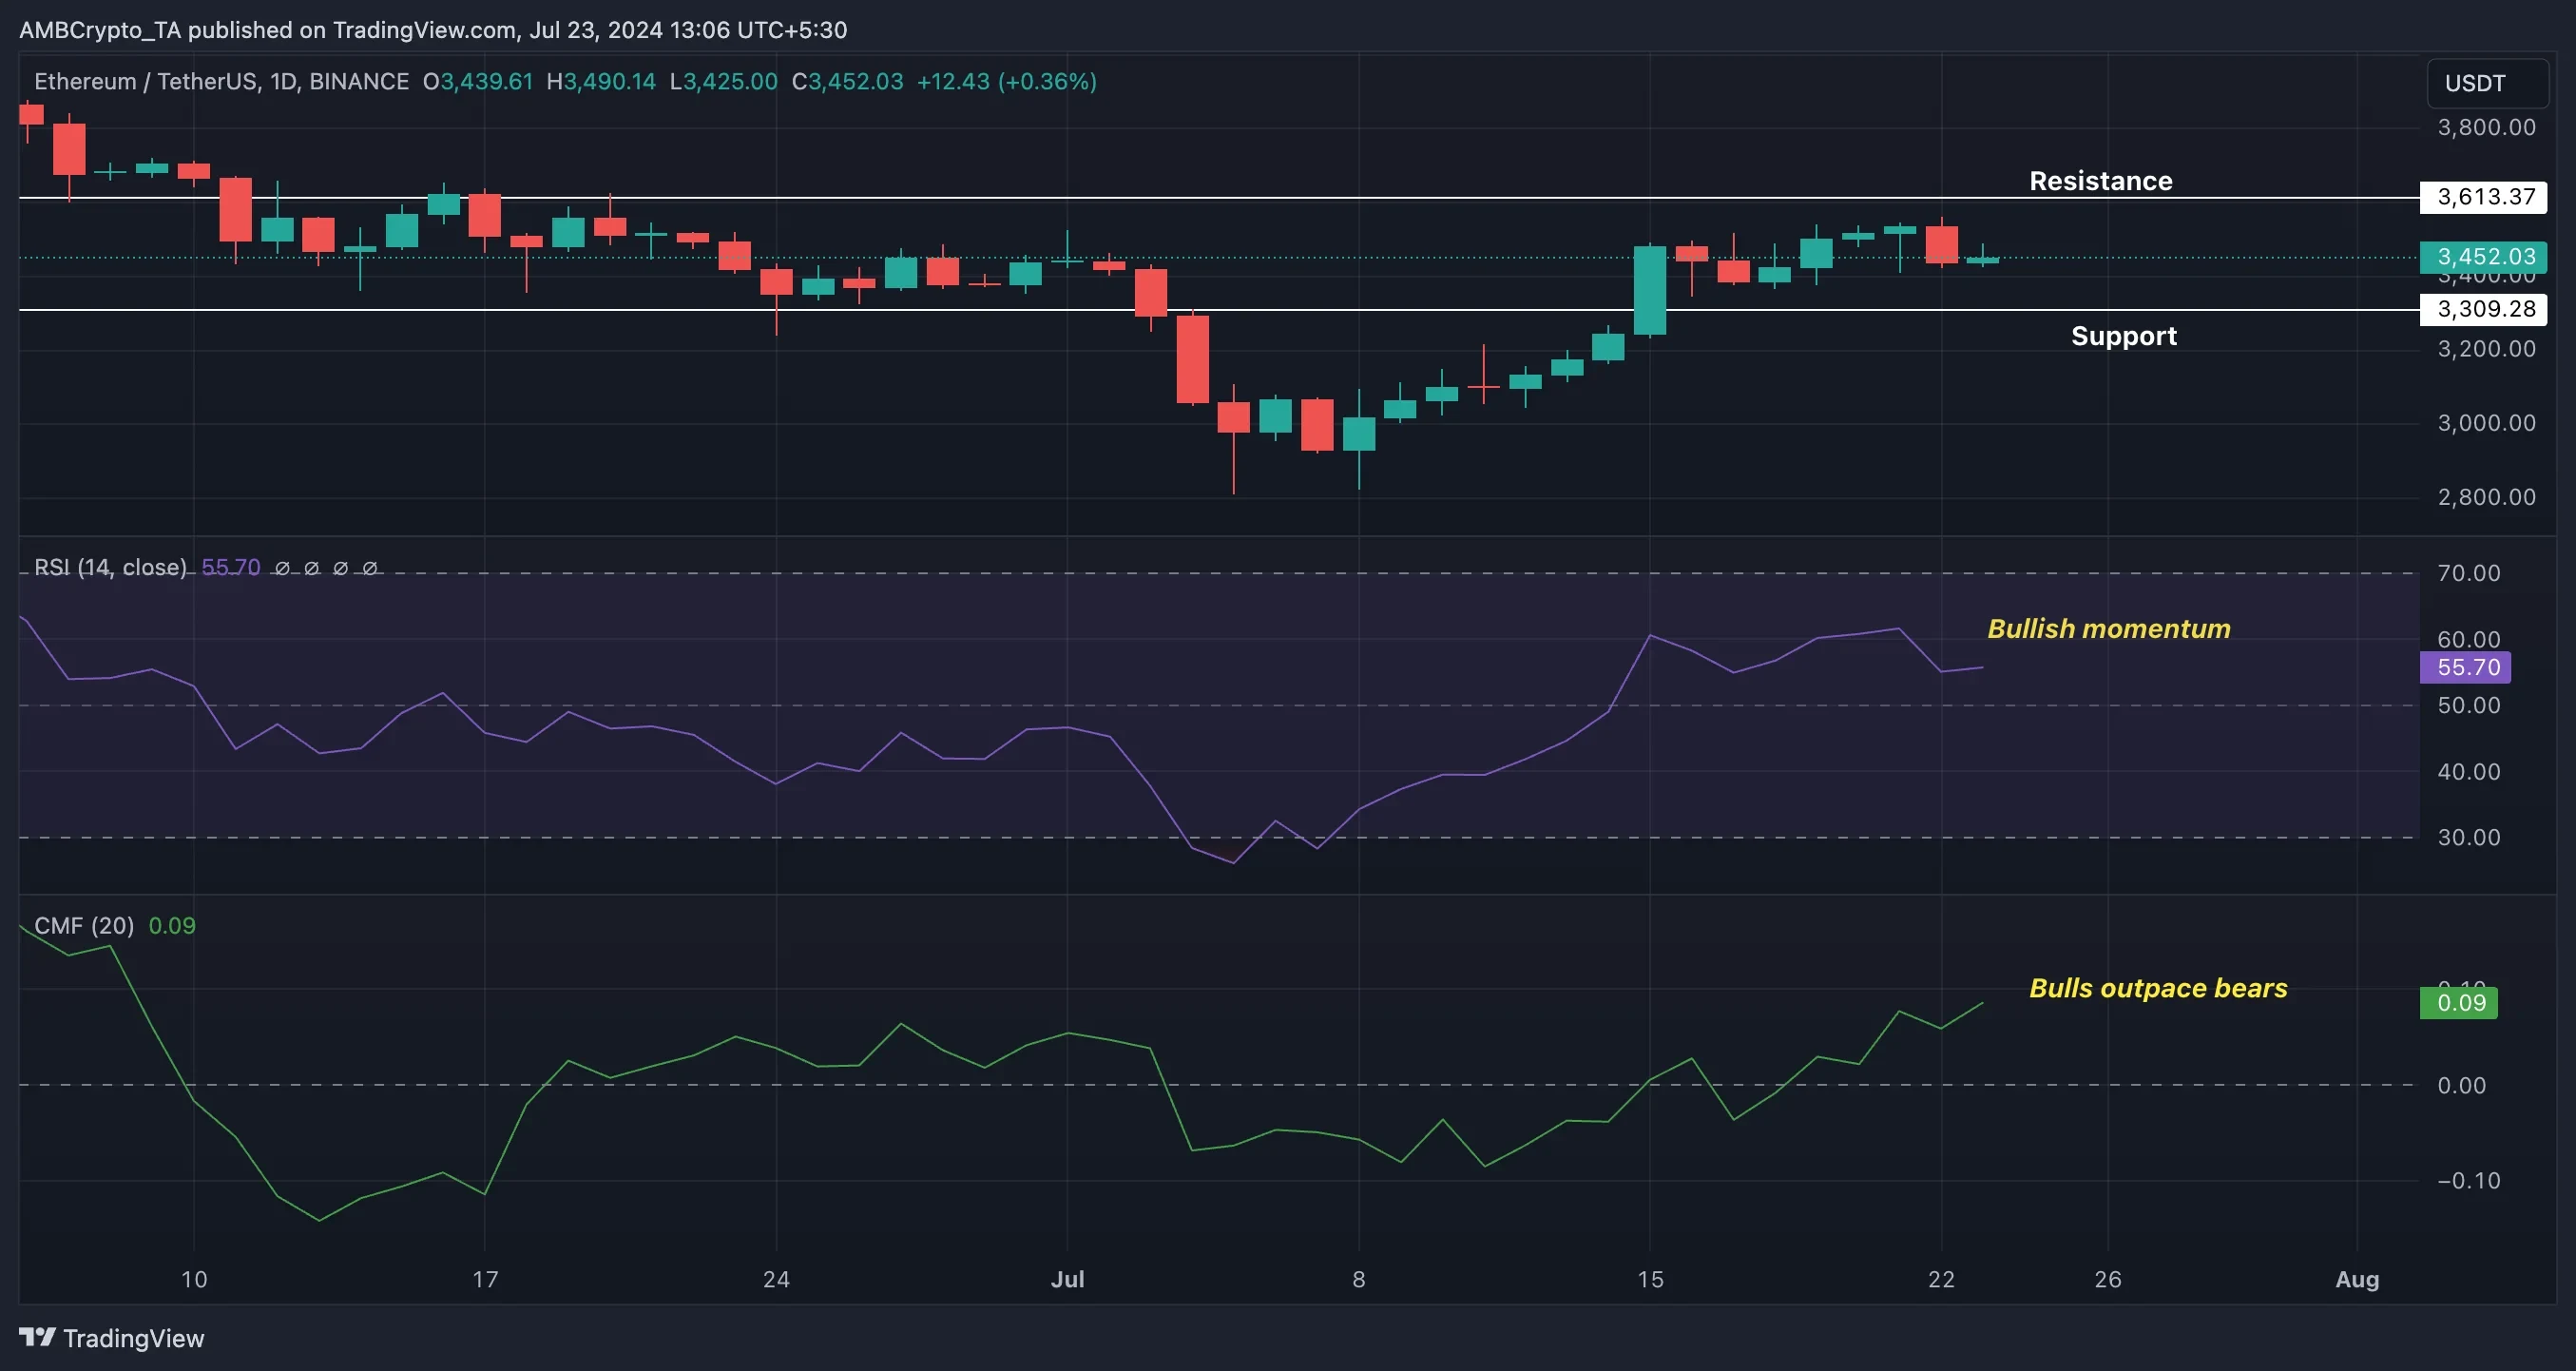
Ethereum’s primary support zone is around $1,721.40, aligning with the 0.618 Fibonacci retracement level. This support level is critical for maintaining the bullish structure of the market.
On the upside, the key resistance level to watch is at $3,600.00. A break above this resistance could pave the way for ETH to target its all-time high of $4,867.81, suggesting a significant potential for gains.
The recent price action saw Ethereum retesting the weekly Fair Value Gap (FVG) extending from $2,896.74 to $3,036.62, followed by a 20.42% rally.
However, the price faced rejection at the weekly resistance level of $3,545.90 and traded slightly down by 7.62% to $3,086.13. The FVG coincides with the 50% Fibonacci retracement, forming a robust support zone.
If this level holds, there is potential for a 57.87% rally to retest the all-time high.

Source: TradingView
At press time, the Relative Strength Index (RSI) on the weekly chart is trading above its neutral level of 50, indicating a bullish momentum. Additionally, the Awesome Oscillator (AO) is above zero, signaling strong market sentiment.
These indicators suggest a continuation of the bullish trend if Ethereum maintains its current levels and does not break below the key support zones.
Whale activity and ETF influence
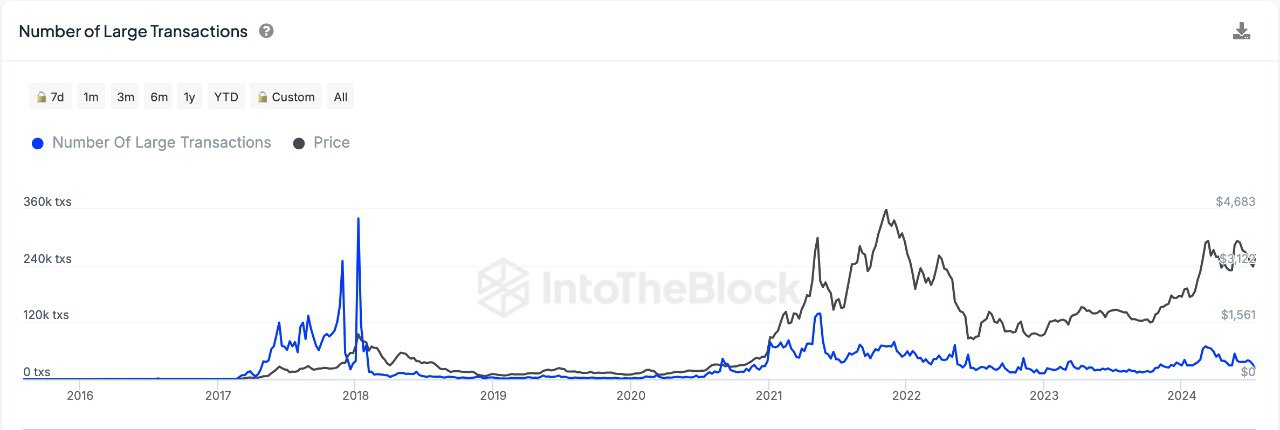
Ethereum is witnessing a surge in large transaction volumes, indicative of increased whale activity. This trend is likely linked to the launch of ETH ETFs.
Large investors appear to be trading Ethereum actively, possibly shifting their exposure from direct blockchain transactions to ETFs.

Source: IntoTheBlock
This movement suggests a preference for the regulated and potentially more accessible investment vehicle provided by ETFs.
According to DefiLlama, the total value locked (TVL) in Ethereum is $59.414 billion, reflecting the overall activity and value within the Ethereum ecosystem. The market capitalization of stablecoins on Ethereum stands at $78.742 billion.
Read Ethereum (ETH) Price Prediction 2024-25
In the past 24 hours, ETH generated $3.61 million in fees and $2.29 million in revenue.
Moreover, active addresses within the last 24 hours totaled 368,579, indicating substantial user engagement.
- Ethereum’s bullish structure hinges on holding the critical support level at $1,721.40.
- Large investors shift to Ethereum ETFs, boosting transaction volumes and market interest.
Ethereum [ETH] has experienced a price decline of 3.60% over the past seven days, underperforming the global crypto market, which saw a modest increase of 0.70%.
At press time, Ethereum traded at $3,316.71, with a 24-hour trading volume of $13,185,794,355. This marks a 0.73% decline in the last 24 hours.
Ethereum: Key support and resistance levels
Ethereum’s primary support zone is around $1,721.40, aligning with the 0.618 Fibonacci retracement level. This support level is critical for maintaining the bullish structure of the market.
On the upside, the key resistance level to watch is at $3,600.00. A break above this resistance could pave the way for ETH to target its all-time high of $4,867.81, suggesting a significant potential for gains.
The recent price action saw Ethereum retesting the weekly Fair Value Gap (FVG) extending from $2,896.74 to $3,036.62, followed by a 20.42% rally.
However, the price faced rejection at the weekly resistance level of $3,545.90 and traded slightly down by 7.62% to $3,086.13. The FVG coincides with the 50% Fibonacci retracement, forming a robust support zone.
If this level holds, there is potential for a 57.87% rally to retest the all-time high.

Source: TradingView
At press time, the Relative Strength Index (RSI) on the weekly chart is trading above its neutral level of 50, indicating a bullish momentum. Additionally, the Awesome Oscillator (AO) is above zero, signaling strong market sentiment.
These indicators suggest a continuation of the bullish trend if Ethereum maintains its current levels and does not break below the key support zones.
Whale activity and ETF influence
Ethereum is witnessing a surge in large transaction volumes, indicative of increased whale activity. This trend is likely linked to the launch of ETH ETFs.
Large investors appear to be trading Ethereum actively, possibly shifting their exposure from direct blockchain transactions to ETFs.

Source: IntoTheBlock
This movement suggests a preference for the regulated and potentially more accessible investment vehicle provided by ETFs.
According to DefiLlama, the total value locked (TVL) in Ethereum is $59.414 billion, reflecting the overall activity and value within the Ethereum ecosystem. The market capitalization of stablecoins on Ethereum stands at $78.742 billion.
Read Ethereum (ETH) Price Prediction 2024-25
In the past 24 hours, ETH generated $3.61 million in fees and $2.29 million in revenue.
Moreover, active addresses within the last 24 hours totaled 368,579, indicating substantial user engagement.


![What Is Asset Tokenization? Types, Why It Matters Now [2025]](https://coininsights.com/wp-content/uploads/2025/05/asset_tokenization-360x180.png)


buying clomiphene tablets clomid cost uk can i order clomid prices can i get cheap clomiphene no prescription can you buy cheap clomiphene online where to buy cheap clomiphene no prescription where buy generic clomiphene price
This website absolutely has all of the information and facts I needed there this subject and didn’t identify who to ask.
This website positively has all of the tidings and facts I needed to this thesis and didn’t comprehend who to ask.
zithromax pill – buy generic tindamax order generic metronidazole 400mg
order generic semaglutide 14 mg – purchase cyproheptadine pill purchase cyproheptadine
order domperidone sale – sumycin 250mg pills buy flexeril paypal