


Dogecoin corrected gains and tested the $0.150 zone against the US Dollar. DOGE is now forming a base and might start a fresh increase above $0.1520.
- DOGE price jumped toward $0.160 before correcting gains.
- The price is trading above the $0.150 level and the 100-hourly simple moving average.
- There is a key bullish trend line forming with support at $0.1485 on the hourly chart of the DOGE/USD pair (data source from Kraken).
- The price must settle above $0.1540 to move into a positive zone and start a fresh surge.
Dogecoin Price Holds Support
After a steady increase, Dogecoin price faced resistance near the $0.160 zone. A high was formed at $0.1594 before DOGE started a downside correction like Bitcoin and Ethereum. There was a drop below the $0.1540 support zone.
A low was formed at $0.1488 and DOGE is now consolidating for the next move. Dogecoin is still trading above the $0.150 level and the 100-hourly simple moving average. There is also a key bullish trend line forming with support at $0.1485 on the hourly chart of the DOGE/USD pair.
On the upside, the price is facing resistance near the $0.1515 level. It is near the 23.6% Fib retracement level of the downward move from the $0.1594 swing high to the $0.1488 low.
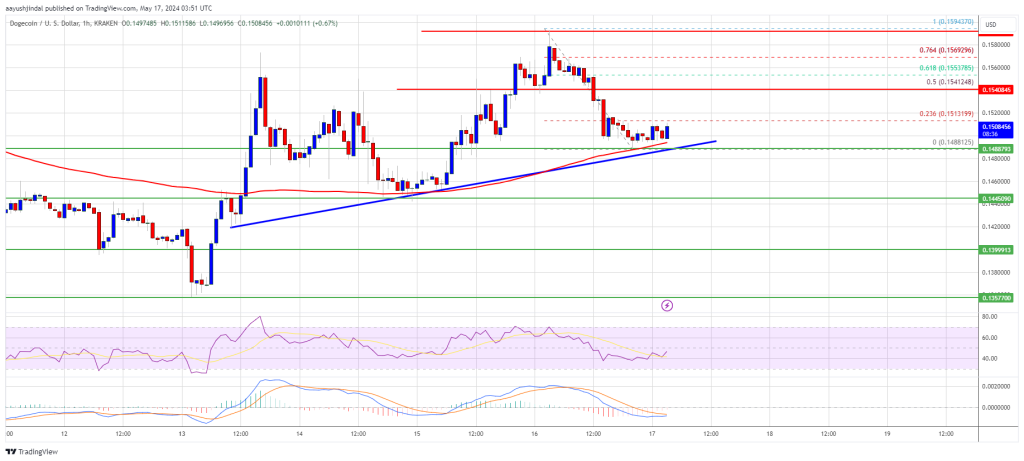
The next major resistance is near the $0.1540 level or the 50% Fib retracement level of the downward move from the $0.1594 swing high to the $0.1488 low. A close above the $0.1540 resistance might send the price toward the $0.160 resistance. Any more gains might send the price toward the $0.1650 level. The next major stop for the bulls might be $0.1720.
More Losses In DOGE?
If DOGE’s price fails to gain pace above the $0.1540 level, it could start another decline. Initial support on the downside is near the $0.150 level and the trend line.
The next major support is near the $0.1445 level. If there is a downside break below the $0.1445 support, the price could decline further. In the stated case, the price might decline toward the $0.1350 level.
Technical Indicators
Hourly MACD – The MACD for DOGE/USD is now losing momentum in the bearish zone.
Hourly RSI (Relative Strength Index) – The RSI for DOGE/USD is now above the 50 level.
Major Support Levels – $0.1500, $0.1445 and $0.1350.
Major Resistance Levels – $0.1515, $0.1540, and $0.1600.
Dogecoin corrected gains and tested the $0.150 zone against the US Dollar. DOGE is now forming a base and might start a fresh increase above $0.1520.
- DOGE price jumped toward $0.160 before correcting gains.
- The price is trading above the $0.150 level and the 100-hourly simple moving average.
- There is a key bullish trend line forming with support at $0.1485 on the hourly chart of the DOGE/USD pair (data source from Kraken).
- The price must settle above $0.1540 to move into a positive zone and start a fresh surge.
Dogecoin Price Holds Support
After a steady increase, Dogecoin price faced resistance near the $0.160 zone. A high was formed at $0.1594 before DOGE started a downside correction like Bitcoin and Ethereum. There was a drop below the $0.1540 support zone.
A low was formed at $0.1488 and DOGE is now consolidating for the next move. Dogecoin is still trading above the $0.150 level and the 100-hourly simple moving average. There is also a key bullish trend line forming with support at $0.1485 on the hourly chart of the DOGE/USD pair.
On the upside, the price is facing resistance near the $0.1515 level. It is near the 23.6% Fib retracement level of the downward move from the $0.1594 swing high to the $0.1488 low.
The next major resistance is near the $0.1540 level or the 50% Fib retracement level of the downward move from the $0.1594 swing high to the $0.1488 low. A close above the $0.1540 resistance might send the price toward the $0.160 resistance. Any more gains might send the price toward the $0.1650 level. The next major stop for the bulls might be $0.1720.
More Losses In DOGE?
If DOGE’s price fails to gain pace above the $0.1540 level, it could start another decline. Initial support on the downside is near the $0.150 level and the trend line.
The next major support is near the $0.1445 level. If there is a downside break below the $0.1445 support, the price could decline further. In the stated case, the price might decline toward the $0.1350 level.
Technical Indicators
Hourly MACD – The MACD for DOGE/USD is now losing momentum in the bearish zone.
Hourly RSI (Relative Strength Index) – The RSI for DOGE/USD is now above the 50 level.
Major Support Levels – $0.1500, $0.1445 and $0.1350.
Major Resistance Levels – $0.1515, $0.1540, and $0.1600.


Thanks for sharing excellent informations. Your website is very cool. I’m impressed by the details that you?¦ve on this site. It reveals how nicely you perceive this subject. Bookmarked this website page, will come back for extra articles. You, my friend, ROCK! I found simply the info I already searched all over the place and simply could not come across. What a great web site.
Hi, Neat post. There is a problem along with your web site in internet explorer, would check this… IE nonetheless is the market chief and a good part of other folks will pass over your great writing because of this problem.
It’s really a nice and helpful piece of info. I’m glad that you shared this useful info with us. Please keep us up to date like this. Thank you for sharing.
Thanks for any other great article. The place else may anyone get that type of info in such a perfect method of writing? I have a presentation next week, and I am on the look for such info.
With havin so much content do you ever run into any issues of plagorism or copyright violation? My site has a lot of completely unique content I’ve either authored myself or outsourced but it looks like a lot of it is popping it up all over the web without my authorization. Do you know any solutions to help protect against content from being stolen? I’d definitely appreciate it.
I gotta bookmark this web site it seems invaluable very beneficial
I have been absent for some time, but now I remember why I used to love this web site. Thank you, I will try and check back more often. How frequently you update your site?
It’s in point of fact a nice and helpful piece of info. I’m satisfied that you shared this useful info with us. Please stay us informed like this. Thank you for sharing.
Real clean internet site, thanks for this post.
buying cheap clomiphene clomid contraindications buy cheap clomid without prescription buying generic clomid without prescription where to get cheap clomiphene how to buy generic clomiphene tablets how can i get clomiphene price
More posts like this would make the online space more useful.
I couldn’t resist commenting. Warmly written!
azithromycin usa – cost ciplox 500mg metronidazole cost
semaglutide generic – purchase rybelsus online cheap cyproheptadine 4mg over the counter
I have recently started a website, the information you offer on this web site has helped me greatly. Thanks for all of your time & work. “Her grandmother, as she gets older, is not fading but rather becoming more concentrated.” by Paulette Bates Alden.
order motilium 10mg sale – domperidone pills cheap cyclobenzaprine
order generic inderal 20mg – order clopidogrel 75mg online order methotrexate 5mg pills
generic clavulanate – atbioinfo oral acillin
esomeprazole 40mg capsules – https://anexamate.com/ nexium 40mg sale
order coumadin 5mg for sale – anticoagulant buy losartan 25mg generic
Hey are using WordPress for your blog platform? I’m new to the blog world but I’m trying to get started and set up my own. Do you require any html coding expertise to make your own blog? Any help would be really appreciated!
order meloxicam 7.5mg online cheap – mobo sin purchase meloxicam generic
order prednisone 20mg online – https://apreplson.com/ order deltasone 20mg generic
buy ed pills fda – fastedtotake.com erection pills viagra online
purchase fluconazole sale – site forcan online order
buy cenforce without prescription – https://cenforcers.com/ cenforce sale
cialis canadian purchase – on this site tadalafil liquid fda approval date
difference between sildenafil tadalafil and vardenafil – cialis super active reviews mail order cialis
ranitidine 150mg over the counter – ranitidine 150mg canada where can i buy ranitidine
cheap online viagra no prescription – https://strongvpls.com/# generic viagra sale online
Thanks recompense sharing. It’s acme quality. https://gnolvade.com/
This is a theme which is in to my heart… Myriad thanks! Exactly where can I upon the phone details in the course of questions? https://buyfastonl.com/gabapentin.html
I couldn’t resist commenting. Warmly written! https://ursxdol.com/cialis-tadalafil-20/
Some truly nice and utilitarian information on this web site, as well I think the style and design holds great features.
This is the compassionate of writing I positively appreciate. https://aranitidine.com/fr/sibelium/
Thanks on putting this up. It’s okay done. https://ondactone.com/simvastatin/
The sagacity in this tune is exceptional.
https://doxycyclinege.com/pro/spironolactone/
With every little thing that seems to be building inside this specific area, a significant percentage of viewpoints are generally quite exciting. Even so, I appologize, because I can not give credence to your entire idea, all be it refreshing none the less. It would seem to us that your opinions are generally not entirely rationalized and in reality you are generally your self not really completely certain of the point. In any event I did appreciate reading through it.
Great write-up, I am normal visitor of one¦s blog, maintain up the nice operate, and It’s going to be a regular visitor for a long time.
I couldn’t weather commenting. Well written! https://sportavesti.ru/forums/users/ichnu-2/
Thank you for another magnificent post. Where else could anybody get that kind of information in such an ideal way of writing? I have a presentation next week, and I’m on the look for such info.
I will right away grab your rss as I can not to find your e-mail subscription link or e-newsletter service. Do you’ve any? Kindly let me know so that I may subscribe. Thanks.
forxiga without prescription – dapagliflozin 10 mg for sale pill dapagliflozin 10 mg
This blog is definitely rather handy since I’m at the moment creating an internet floral website – although I am only starting out therefore it’s really fairly small, nothing like this site. Can link to a few of the posts here as they are quite. Thanks much. Zoey Olsen
obviously like your web-site but you need to check the spelling on several of your posts. Several of them are rife with spelling issues and I find it very bothersome to tell the truth nevertheless I’ll certainly come back again.
orlistat price – orlistat pills buy orlistat online cheap