


- Bitcoin’s price dropped by over 2% last week.
- A key indicator pointed out that BTC was near a market bottom.
Bitcoin [BTC] bears stayed ahead of the bulls last week as the king of cryptos’ price registered a decline. However, if the latest data is to be considered, BTC’s path ahead might not have many break-throughs.
Let’s have a closer look at BTC’s state to see what the upcoming week might be.
Bitcoin bears might take a break
CoinMarketCap’s data revealed that BTC’s price had dropped by more than 2% in the last seven days. The coin’s price turned bullish days after reclaiming $70k on the 24th of May.
At the time of writing, Bitcoin was trading at $67,674.15 with a market capitalization of over $1.33 trillion.
Nonetheless, the upcoming days might look different. Milkybull, a popular crypto analyst, recently posted a tweet highlighting an interesting development.
As per the tweet, from a short-term perspective, nothing is looking bearish, but rather it’s gathering momentum for the next move.
This was the case as BTC continued to trade above its crucial support at $66k. Moreover, the 13th consecutive positive ETF inflow was another added advantage for the bulls.
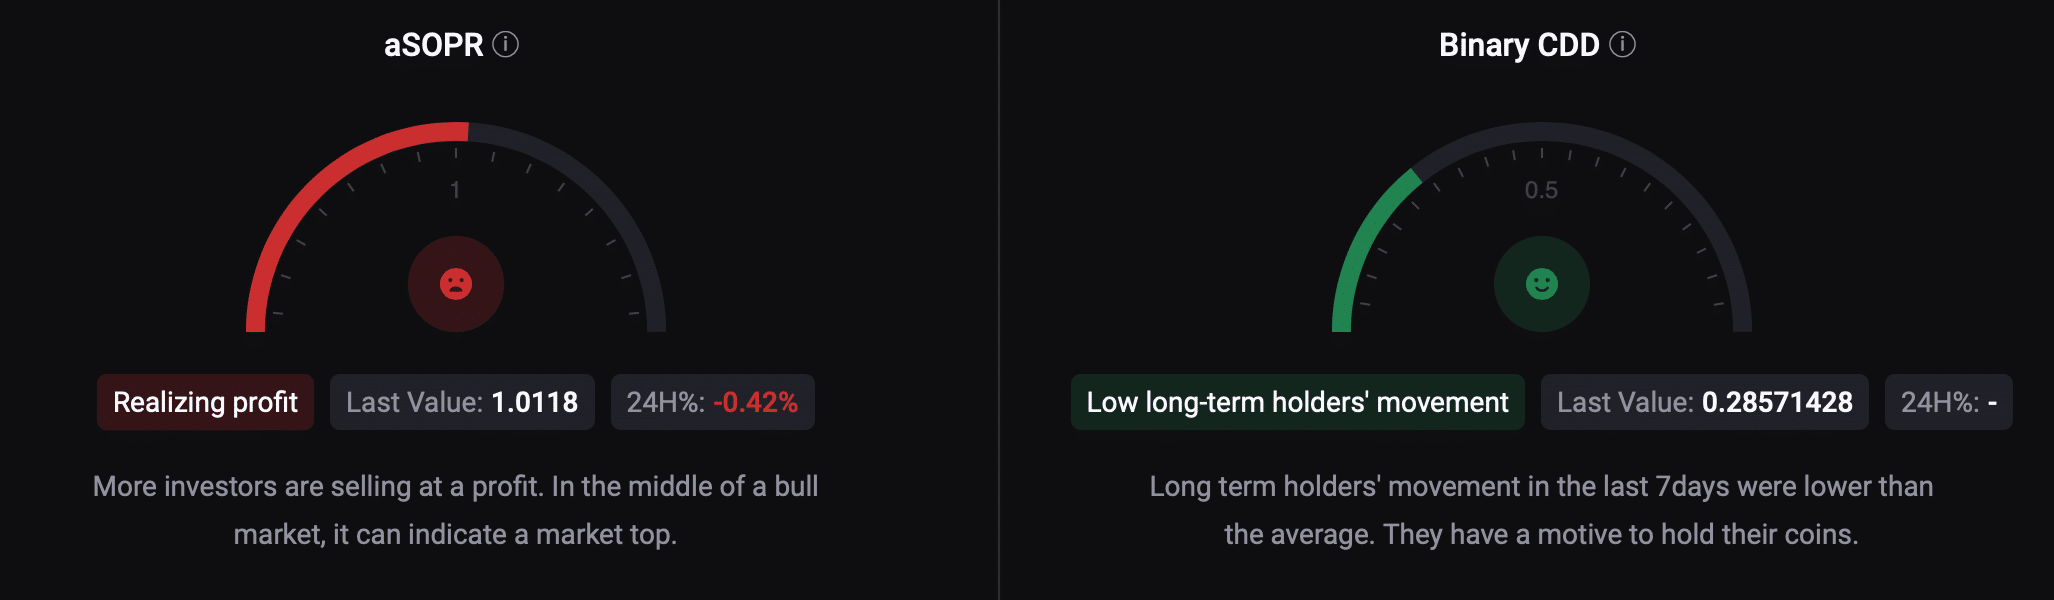
AMBCrypto’s analysis of CryptoQuant’s data revealed that BTC’s binary CDD was green. This meant that long-term holders’ movements in the last 7 days were lower than average. However, the rest of the metrics looked pretty bearish.
For example, BTC’s net deposit on exchanges was higher compared to the last seven-day average. Its aSORP was also red, meaning that more investors are selling at a profit. In the middle of a bull market, it can indicate a market top.
Source: CryptoQuant
Is there a bull rally around the corner?
Apart from this, BTC’s fear and greed index had a reading of 72 at press time, meaning that the market was in a “greed” phase. Whenever the metric hits that level, the changes of a price correction are high.
However, Glassnode’s data pointed out an indicator that hinted at a price pump.
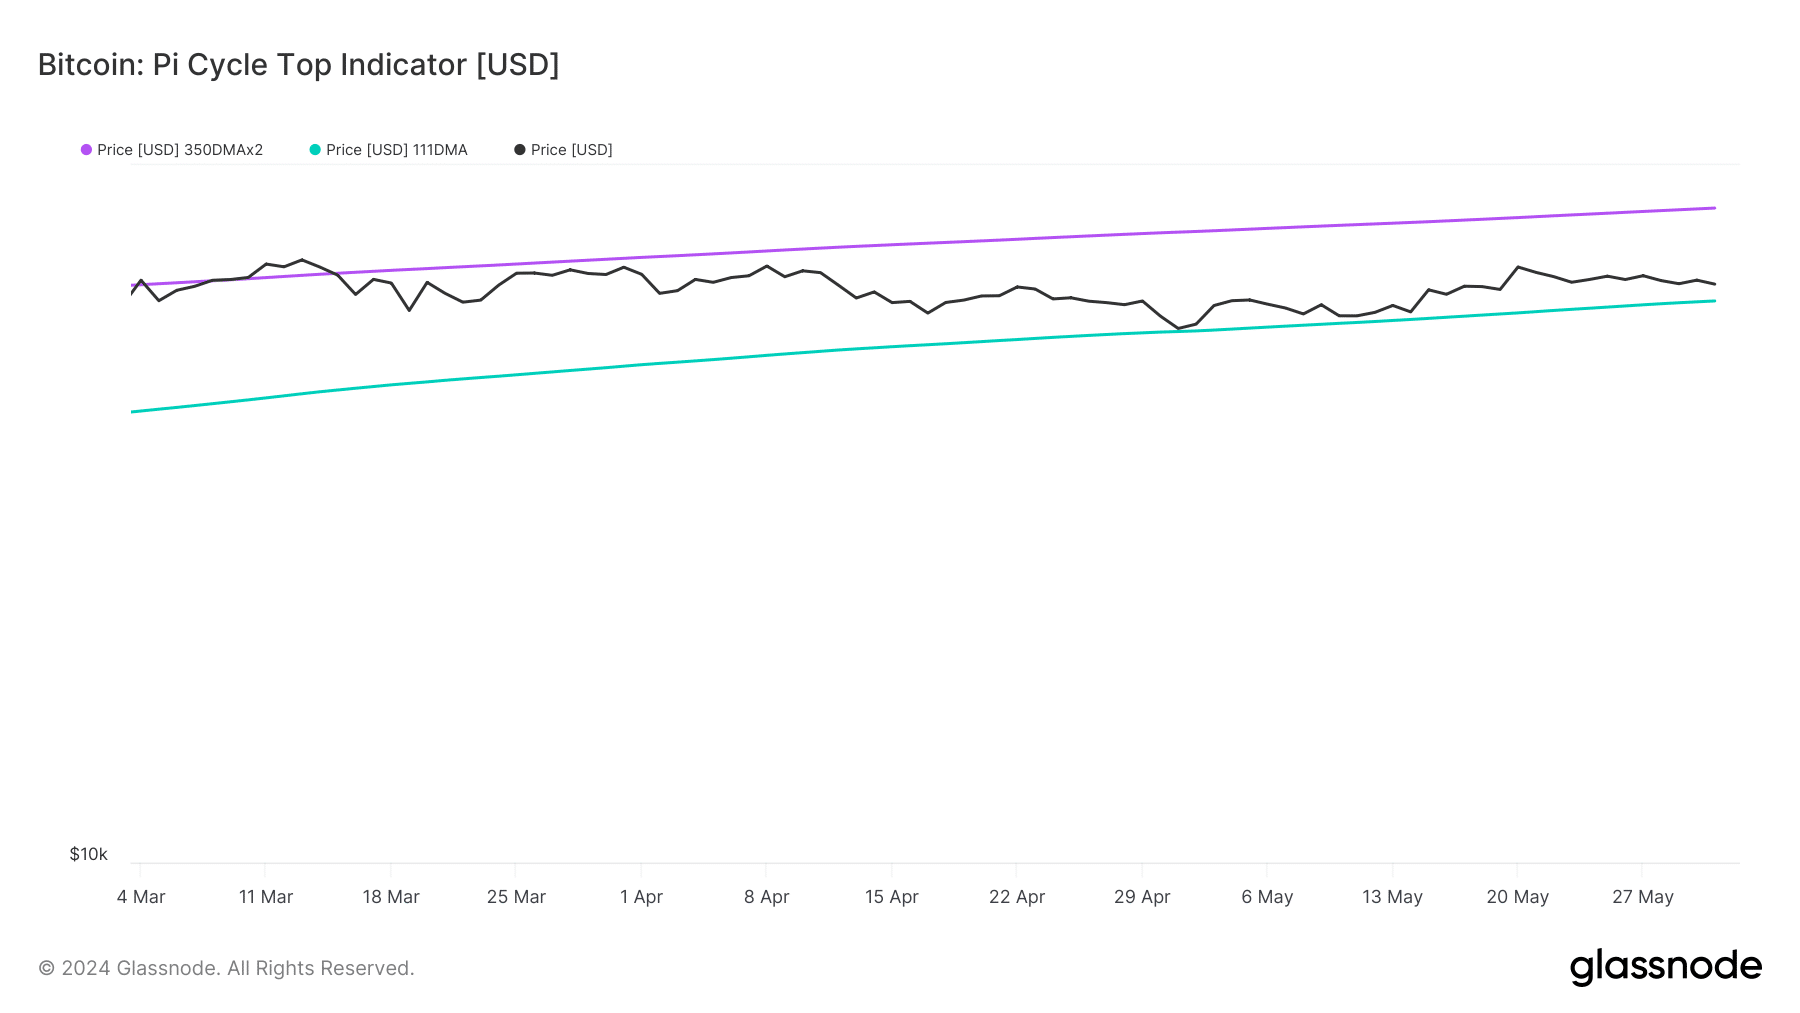
BTC’s Pi Cycle Top indicator revealed that BTC’s price was just about to touch the 111-day moving average (MA). Therefore, the chances of a rebound are high after BTC touches that support level, which indicates a market bottom.
Source: Glassnode
Read Bitcoin (BTC) Price Prediction 2024-25
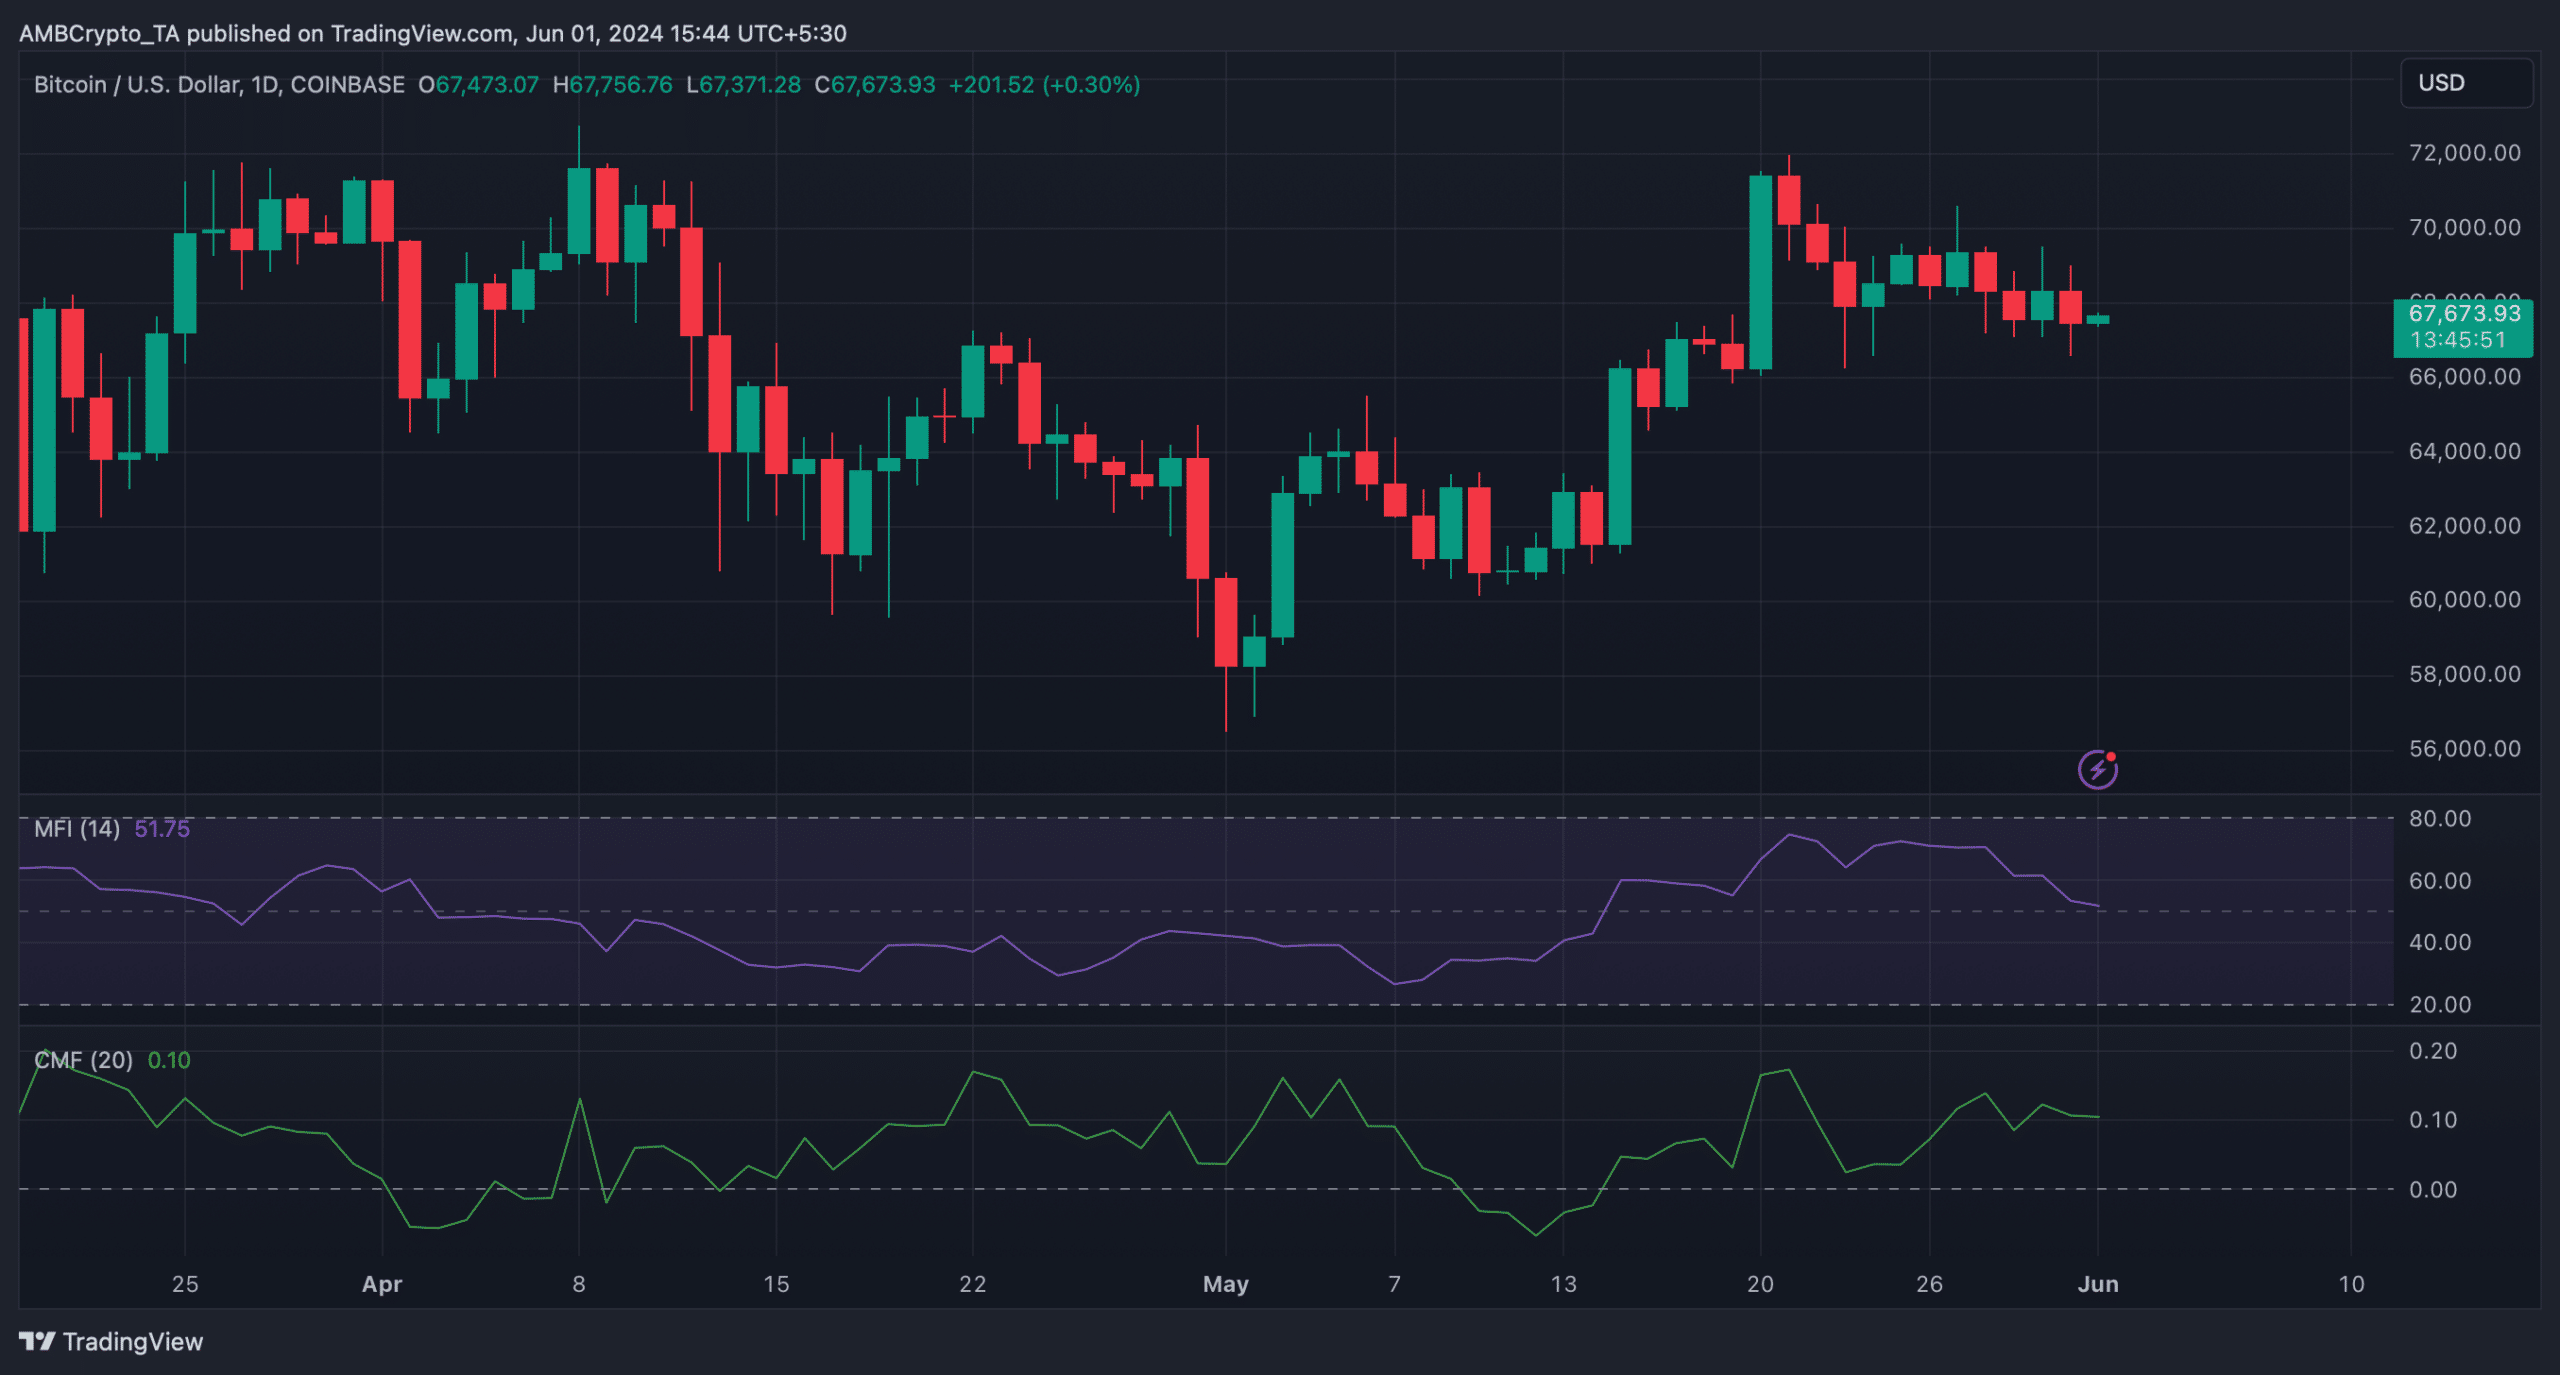
The possibility of BTC touching its support level seemed high as the coin’s Money Flow Index (MFI) registered a sharp decline. The king of cryptos’ Chaikin Money Flow (CMF) also followed a similar declining trend.
These indicators suggest that BTC might drop a bit more before it makes a comeback over the coming days.
Source: TradingView
- Bitcoin’s price dropped by over 2% last week.
- A key indicator pointed out that BTC was near a market bottom.
Bitcoin [BTC] bears stayed ahead of the bulls last week as the king of cryptos’ price registered a decline. However, if the latest data is to be considered, BTC’s path ahead might not have many break-throughs.
Let’s have a closer look at BTC’s state to see what the upcoming week might be.
Bitcoin bears might take a break
CoinMarketCap’s data revealed that BTC’s price had dropped by more than 2% in the last seven days. The coin’s price turned bullish days after reclaiming $70k on the 24th of May.
At the time of writing, Bitcoin was trading at $67,674.15 with a market capitalization of over $1.33 trillion.
Nonetheless, the upcoming days might look different. Milkybull, a popular crypto analyst, recently posted a tweet highlighting an interesting development.
As per the tweet, from a short-term perspective, nothing is looking bearish, but rather it’s gathering momentum for the next move.
This was the case as BTC continued to trade above its crucial support at $66k. Moreover, the 13th consecutive positive ETF inflow was another added advantage for the bulls.
AMBCrypto’s analysis of CryptoQuant’s data revealed that BTC’s binary CDD was green. This meant that long-term holders’ movements in the last 7 days were lower than average. However, the rest of the metrics looked pretty bearish.
For example, BTC’s net deposit on exchanges was higher compared to the last seven-day average. Its aSORP was also red, meaning that more investors are selling at a profit. In the middle of a bull market, it can indicate a market top.
Source: CryptoQuant
Is there a bull rally around the corner?
Apart from this, BTC’s fear and greed index had a reading of 72 at press time, meaning that the market was in a “greed” phase. Whenever the metric hits that level, the changes of a price correction are high.
However, Glassnode’s data pointed out an indicator that hinted at a price pump.
BTC’s Pi Cycle Top indicator revealed that BTC’s price was just about to touch the 111-day moving average (MA). Therefore, the chances of a rebound are high after BTC touches that support level, which indicates a market bottom.
Source: Glassnode
Read Bitcoin (BTC) Price Prediction 2024-25
The possibility of BTC touching its support level seemed high as the coin’s Money Flow Index (MFI) registered a sharp decline. The king of cryptos’ Chaikin Money Flow (CMF) also followed a similar declining trend.
These indicators suggest that BTC might drop a bit more before it makes a comeback over the coming days.
Source: TradingView


can i order generic clomid without insurance cost generic clomid online can you get cheap clomid without insurance get cheap clomid online how to get cheap clomiphene tablets how to buy clomid price can i purchase generic clomiphene without rx
More posts like this would persuade the online time more useful.
This is the type of advise I unearth helpful.
zithromax medication – order floxin for sale metronidazole us
semaglutide us – periactin pills buy generic periactin 4 mg
domperidone pills – buy flexeril how to get flexeril without a prescription
zithromax cost – buy tindamax without a prescription bystolic cheap
augmentin 625mg pills – https://atbioinfo.com/ buy ampicillin online
oral esomeprazole – anexa mate order esomeprazole
buy coumadin 2mg pills – https://coumamide.com/ purchase losartan generic
buy generic meloxicam – https://moboxsin.com/ purchase meloxicam pill
buy prednisone 5mg online – inflammatory bowel diseases buy prednisone generic
over the counter erectile dysfunction pills – fastedtotake buy erectile dysfunction pills
purchase amoxil sale – https://combamoxi.com/ amoxicillin pill
order fluconazole 200mg – where to buy forcan without a prescription fluconazole tablet
cenforce 100mg generic – this cenforce 50mg cost
cialis for daily use – https://ciltadgn.com/# cialis generic canada
achats produit tadalafil pour femme en ligne – on this site vardenafil and tadalafil
order ranitidine 150mg pills – https://aranitidine.com/ zantac 300mg generic
viagra for men for sale – buy viagra online now viagra sale calgary
The thoroughness in this piece is noteworthy. https://ursxdol.com/furosemide-diuretic/
I couldn’t resist commenting. Well written! https://prohnrg.com/product/acyclovir-pills/
Palatable blog you be undergoing here.. It’s hard to on high quality belles-lettres like yours these days. I honestly recognize individuals like you! Take mindfulness!! cialis france pharmacie en ligne
Greetings! Extremely productive recommendation within this article! It’s the petty changes which wish obtain the largest changes. Thanks a quantity for sharing! https://ondactone.com/product/domperidone/
More articles like this would make the blogosphere richer.
methotrexate brand
Greetings! Utter serviceable recommendation within this article! It’s the petty changes which choice obtain the largest changes. Thanks a lot in the direction of sharing! http://bbs.51pinzhi.cn/home.php?mod=space&uid=7053857
forxiga 10mg pills – buy generic dapagliflozin for sale dapagliflozin 10 mg without prescription
xenical price – purchase orlistat without prescription xenical price
More posts like this would add up to the online play more useful. http://bbs.51pinzhi.cn/home.php?mod=space&uid=7112614