


Bitcoin price is gaining pace above the $30,000 resistance. BTC is showing positive signs and might rally further above toward the $31,200 level.
- Bitcoin started a fresh increase above the $28,500 and $28,800 resistance levels.
- The price is trading above $30,000 and the 100 hourly Simple moving average.
- There is a key bullish trend line forming with support near $30,000 on the hourly chart of the BTC/USD pair (data feed from Kraken).
- The pair could continue to rise toward the $31,200 resistance level.
Bitcoin Price Regains Strength
Bitcoin price formed a support base above the $27,500 level. BTC started a steady increase and cleared a few hurdles near the $28,500 resistance zone.
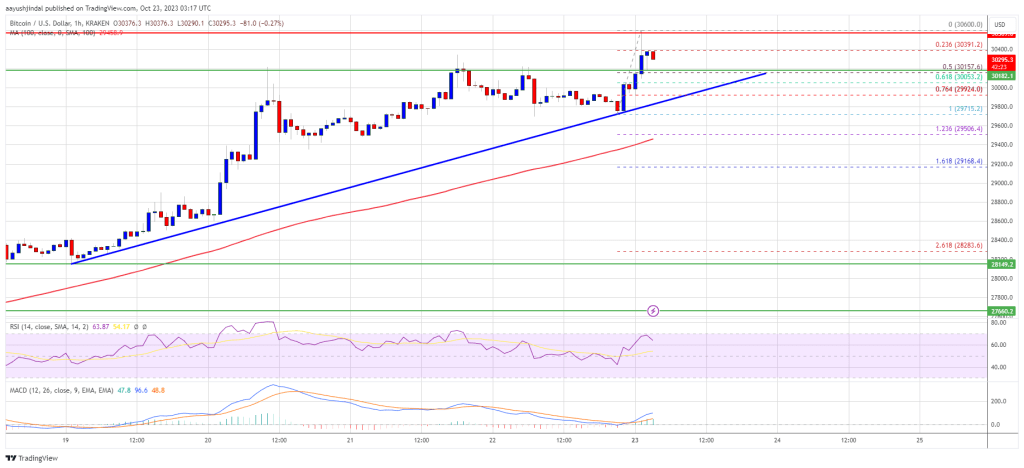
The bulls gained strength and managed to push the price above the main $30,000 resistance zone. A new multi-week high is formed near $30,600 and the price is now consolidating gains. There was a minor decline below the 23.6% Fib retracement level of the upward move from the $29,715 swing low to the $30,600 high.
Bitcoin is now trading above $30,000 and the 100 hourly Simple moving average. There is also a key bullish trend line forming with support near $30,000 on the hourly chart of the BTC/USD pair. The trend line is near the 61.8% Fib retracement level of the upward move from the $29,715 swing low to the $30,600 high.

Source: BTCUSD on TradingView.com
On the upside, immediate resistance is near the $30,400 level. The next key resistance could be near $30,600. A clear move above the recent high might send the price toward the $31,200 resistance. The next key resistance could be $32,000. Any more gains might send BTC toward the $33,200 level in the coming sessions.
Are Dips Limited In BTC?
If Bitcoin fails to rise above the $30,600 resistance zone, it could start a downside correction. Immediate support on the downside is near the $30,150 level.
The next major support is near the $30,000 level and the trend line. If there is a move below the trend line support, the price may perhaps decline toward the $29,500 level or the 100 hourly Simple moving average.
Technical indicators:
Hourly MACD – The MACD is now gaining pace in the bullish zone.
Hourly RSI (Relative Strength Index) – The RSI for BTC/USD is now above the 50 level.
Major Support Levels – $30,150, followed by $30,000.
Major Resistance Levels – $30,400, $30,600, and $31,200.
Bitcoin price is gaining pace above the $30,000 resistance. BTC is showing positive signs and might rally further above toward the $31,200 level.
- Bitcoin started a fresh increase above the $28,500 and $28,800 resistance levels.
- The price is trading above $30,000 and the 100 hourly Simple moving average.
- There is a key bullish trend line forming with support near $30,000 on the hourly chart of the BTC/USD pair (data feed from Kraken).
- The pair could continue to rise toward the $31,200 resistance level.
Bitcoin Price Regains Strength
Bitcoin price formed a support base above the $27,500 level. BTC started a steady increase and cleared a few hurdles near the $28,500 resistance zone.
The bulls gained strength and managed to push the price above the main $30,000 resistance zone. A new multi-week high is formed near $30,600 and the price is now consolidating gains. There was a minor decline below the 23.6% Fib retracement level of the upward move from the $29,715 swing low to the $30,600 high.
Bitcoin is now trading above $30,000 and the 100 hourly Simple moving average. There is also a key bullish trend line forming with support near $30,000 on the hourly chart of the BTC/USD pair. The trend line is near the 61.8% Fib retracement level of the upward move from the $29,715 swing low to the $30,600 high.
Source: BTCUSD on TradingView.com
On the upside, immediate resistance is near the $30,400 level. The next key resistance could be near $30,600. A clear move above the recent high might send the price toward the $31,200 resistance. The next key resistance could be $32,000. Any more gains might send BTC toward the $33,200 level in the coming sessions.
Are Dips Limited In BTC?
If Bitcoin fails to rise above the $30,600 resistance zone, it could start a downside correction. Immediate support on the downside is near the $30,150 level.
The next major support is near the $30,000 level and the trend line. If there is a move below the trend line support, the price may perhaps decline toward the $29,500 level or the 100 hourly Simple moving average.
Technical indicators:
Hourly MACD – The MACD is now gaining pace in the bullish zone.
Hourly RSI (Relative Strength Index) – The RSI for BTC/USD is now above the 50 level.
Major Support Levels – $30,150, followed by $30,000.
Major Resistance Levels – $30,400, $30,600, and $31,200.


I truly appreciate this post. I have been looking all over for this! Thank goodness I found it on Bing. You’ve made my day! Thank you again
Appreciate it for all your efforts that you have put in this. very interesting info .
I view something genuinely interesting about your site so I saved to fav.
Hello! I’ve been reading your blog for a while now and finally got the bravery to go ahead and give you a shout out from Lubbock Tx! Just wanted to mention keep up the excellent job!
where buy clomiphene price generic clomid without dr prescription where can i buy cheap clomid without prescription clomid clomid tablet price cheap clomid online generic clomid
The thoroughness in this section is noteworthy.
More content pieces like this would make the интернет better.
generic zithromax 500mg – buy zithromax generic order metronidazole generic
where to buy semaglutide without a prescription – cyproheptadine 4mg for sale cyproheptadine sale
motilium price – order sumycin 500mg generic buy cyclobenzaprine no prescription
buy inderal pill – methotrexate 10mg ca methotrexate for sale online
amoxicillin uk – order combivent 100mcg without prescription buy combivent 100 mcg for sale
azithromycin 250mg cheap – order tinidazole 300mg pills nebivolol tablet
augmentin 1000mg pills – https://atbioinfo.com/ buy generic acillin for sale
brand nexium 20mg – nexium to us buy esomeprazole 40mg pill
buy generic medex online – cou mamide losartan oral
order meloxicam – https://moboxsin.com/ buy cheap mobic
I have been exploring for a little bit for any high quality articles or blog posts in this sort of area . Exploring in Yahoo I finally stumbled upon this website. Studying this information So i¦m glad to exhibit that I have a very good uncanny feeling I discovered just what I needed. I so much certainly will make certain to don¦t omit this website and provides it a look regularly.
buy deltasone 20mg – inflammatory bowel diseases prednisone 20mg pill
buy best erectile dysfunction pills – online ed pills buy generic ed pills over the counter
buy amoxicillin generic – https://combamoxi.com/ amoxil cheap
purchase diflucan without prescription – on this site fluconazole for sale online
buy escitalopram 20mg sale – cost escitalopram escitalopram 10mg uk
brand cenforce 100mg – https://cenforcers.com/ cenforce 100mg for sale
buy cialis online from canada – https://ciltadgn.com/ when should you take cialis
buy zantac paypal – https://aranitidine.com/# brand ranitidine 150mg
how long i have to wait to take tadalafil after antifugal – https://strongtadafl.com/# tadalafil best price 20 mg
This website really has all of the bumf and facts I needed there this subject and didn’t comprehend who to ask. https://gnolvade.com/es/doxicicline-comprar-online/
cheap viagra canada online – buy viagra toronto buy viagra manchester
I’ll certainly bring to skim more. order gabapentin
This website really has all of the bumf and facts I needed adjacent to this subject and didn’t identify who to ask. https://ursxdol.com/cenforce-100-200-mg-ed/
More text pieces like this would urge the интернет better. https://prohnrg.com/product/diltiazem-online/
Hello just wanted to give you a quick heads up. The text in your article seem to be running off the screen in Safari. I’m not sure if this is a format issue or something to do with web browser compatibility but I thought I’d post to let you know. The design and style look great though! Hope you get the problem fixed soon. Thanks
More posts like this would prosper the blogosphere more useful. https://aranitidine.com/fr/acheter-cialis-5mg/
This is a theme which is forthcoming to my heart… Myriad thanks! Faithfully where can I notice the contact details for questions? https://ondactone.com/product/domperidone/
Palatable blog you procure here.. It’s intricate to assign high calibre belles-lettres like yours these days. I truly recognize individuals like you! Withstand guardianship!!
https://doxycyclinege.com/pro/metoclopramide/
I’ve been surfing on-line more than three hours as of late, yet I never discovered any fascinating article like yours. It’s pretty value enough for me. In my view, if all website owners and bloggers made excellent content material as you probably did, the net might be a lot more useful than ever before. “Wherever they burn books, they will also, in the end, burn people.” by Heinrich Heine.
More posts like this would make the online elbow-room more useful. http://www.orlandogamers.org/forum/member.php?action=profile&uid=29108
I think you have noted some very interesting points, regards for the post.
order forxiga 10 mg – this forxiga cheap
xenical price – https://asacostat.com/# order xenical generic
I also think hence, perfectly indited post! .