


- BNB started to trade above a long-term resistance level.
- The coin’s price might reclaim its two-year-old all-time high.
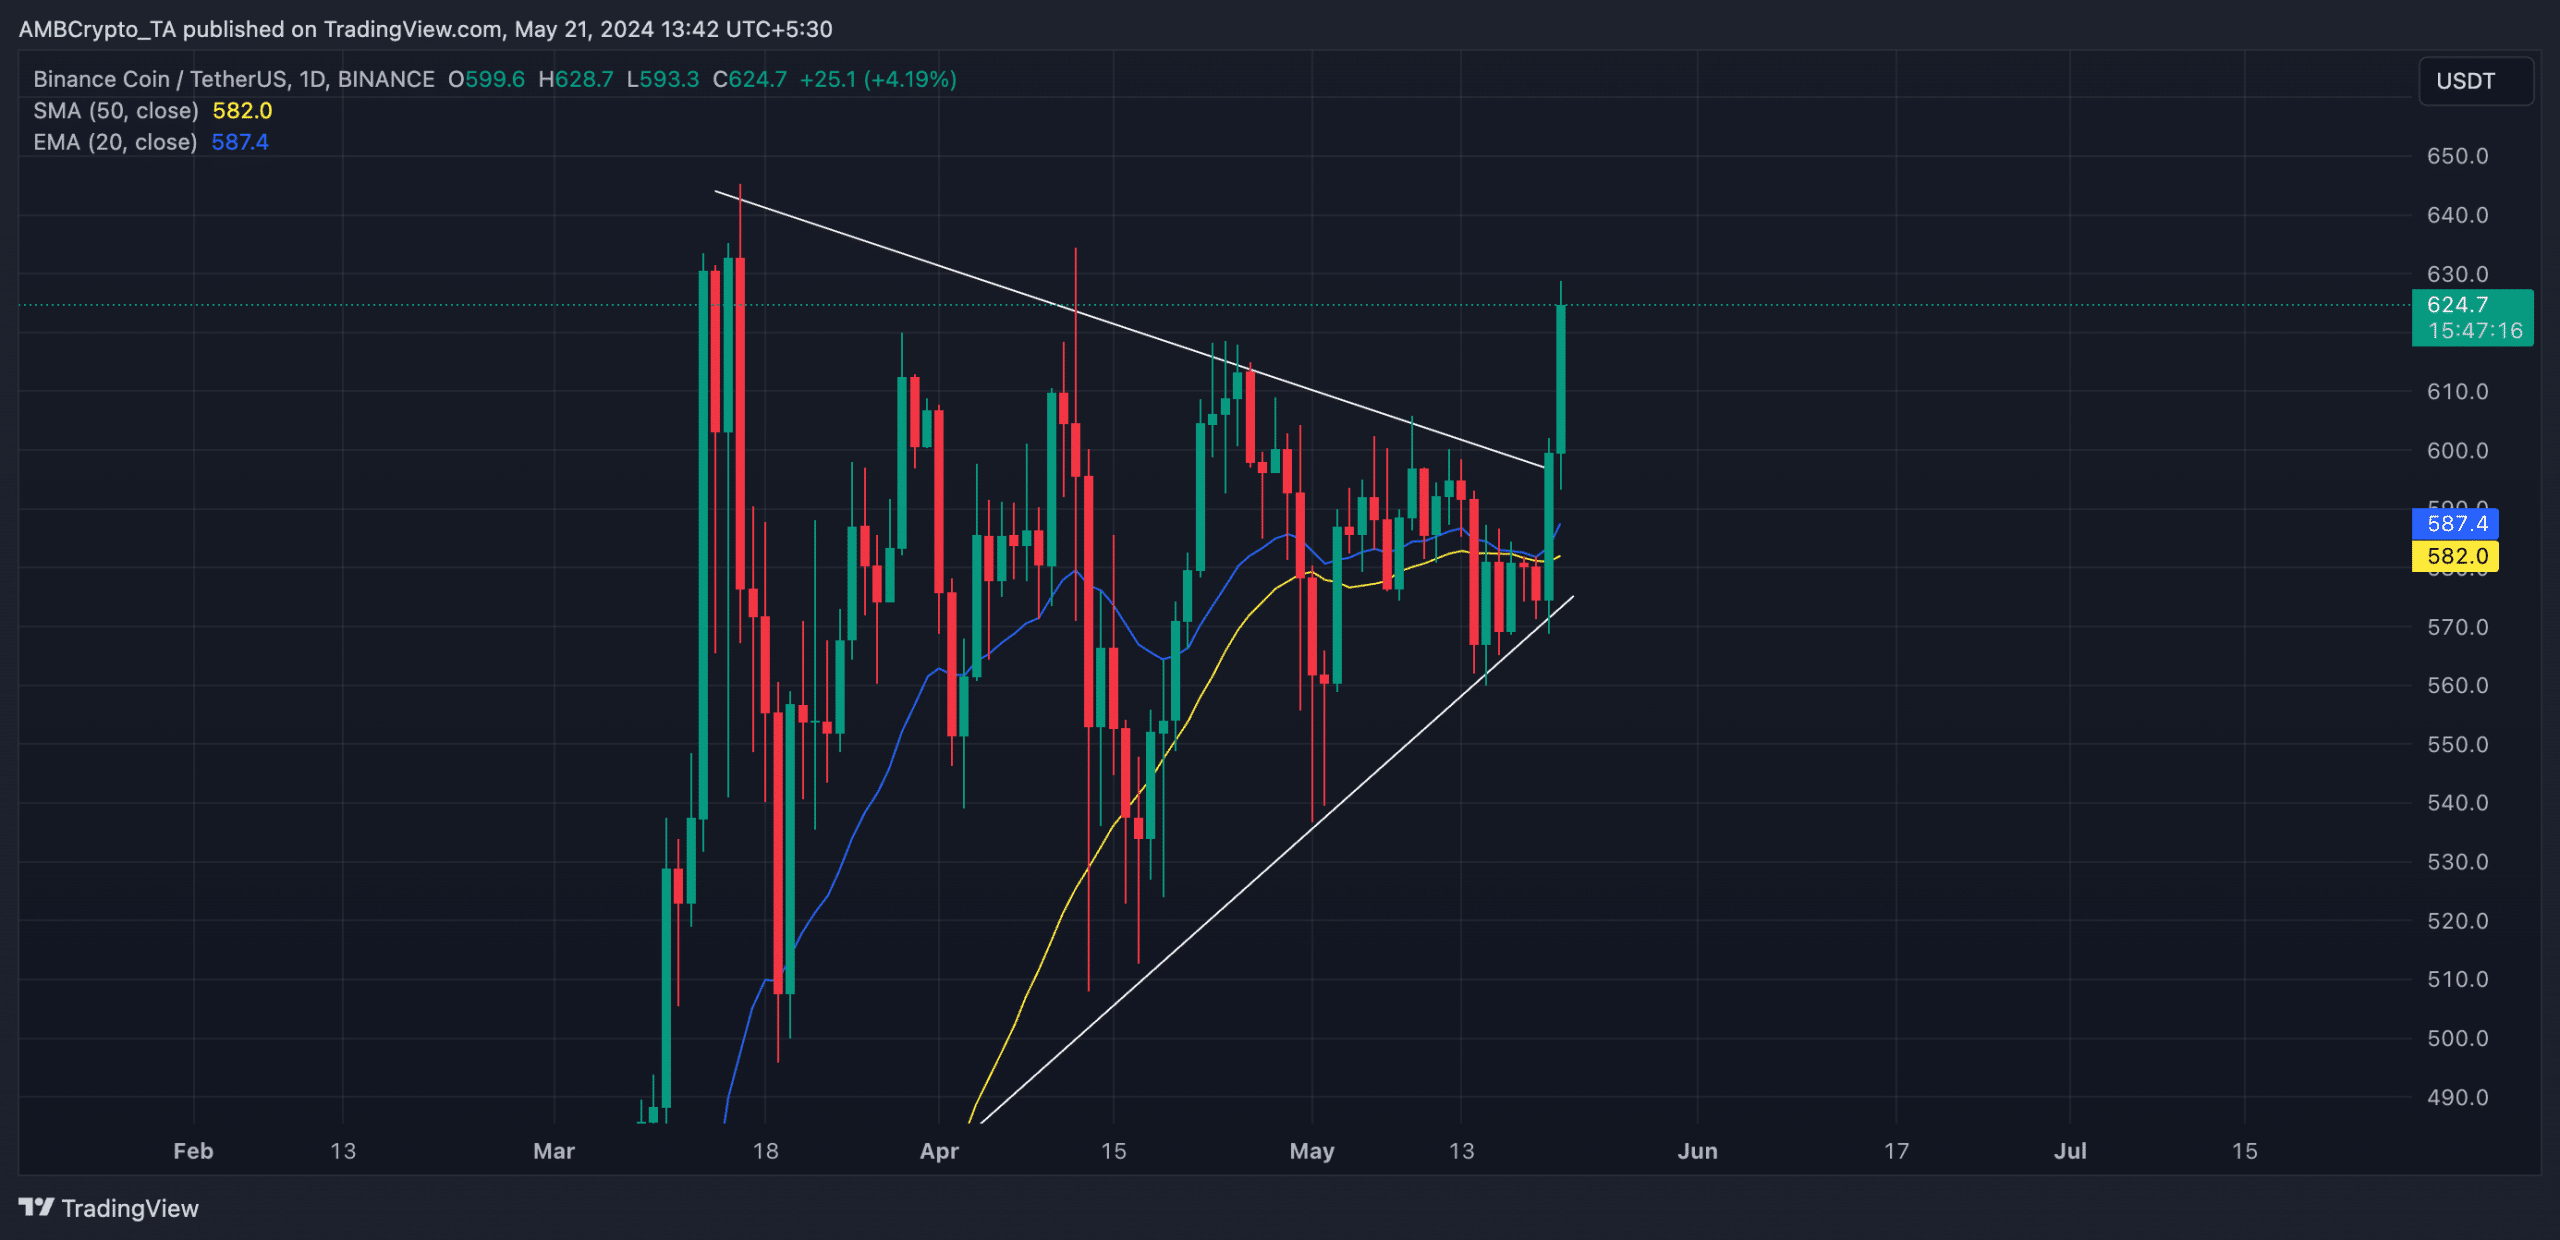
Binance Coin [BNB] has broken above the upper line of its long-term symmetrical triangle, signaling a spike in buying pressure.
As of this writing, the altcoin traded at $623, above the $595 price region, which had formed a significant resistance level since March.
Source: BNB/USDT, TradingView
When an asset trades within a symmetrical triangle, its price continues to hit various lower highs and higher lows.
It suggests that the asset’s price is consolidating within a tight range, with buyers pushing prices up to meet resistance and sellers pushing them down to find support.
BNB poised for further growth
BNB’s price hike in the past 24 hours has led its price to rally above key moving averages.
At its press time price, the coin traded above its 20-day Exponential Moving Average (EMA) and its 50-day Small Moving Average (SMA) at press time.
This crossover is significant because BNB’s price had traded at these moving averages for five days, indicating indecision between the bulls and the bears before the 20 May market rally.
With this crossover, the market is in a sustained upward trend. Traders interpret it as a shift in momentum toward coin accumulation.
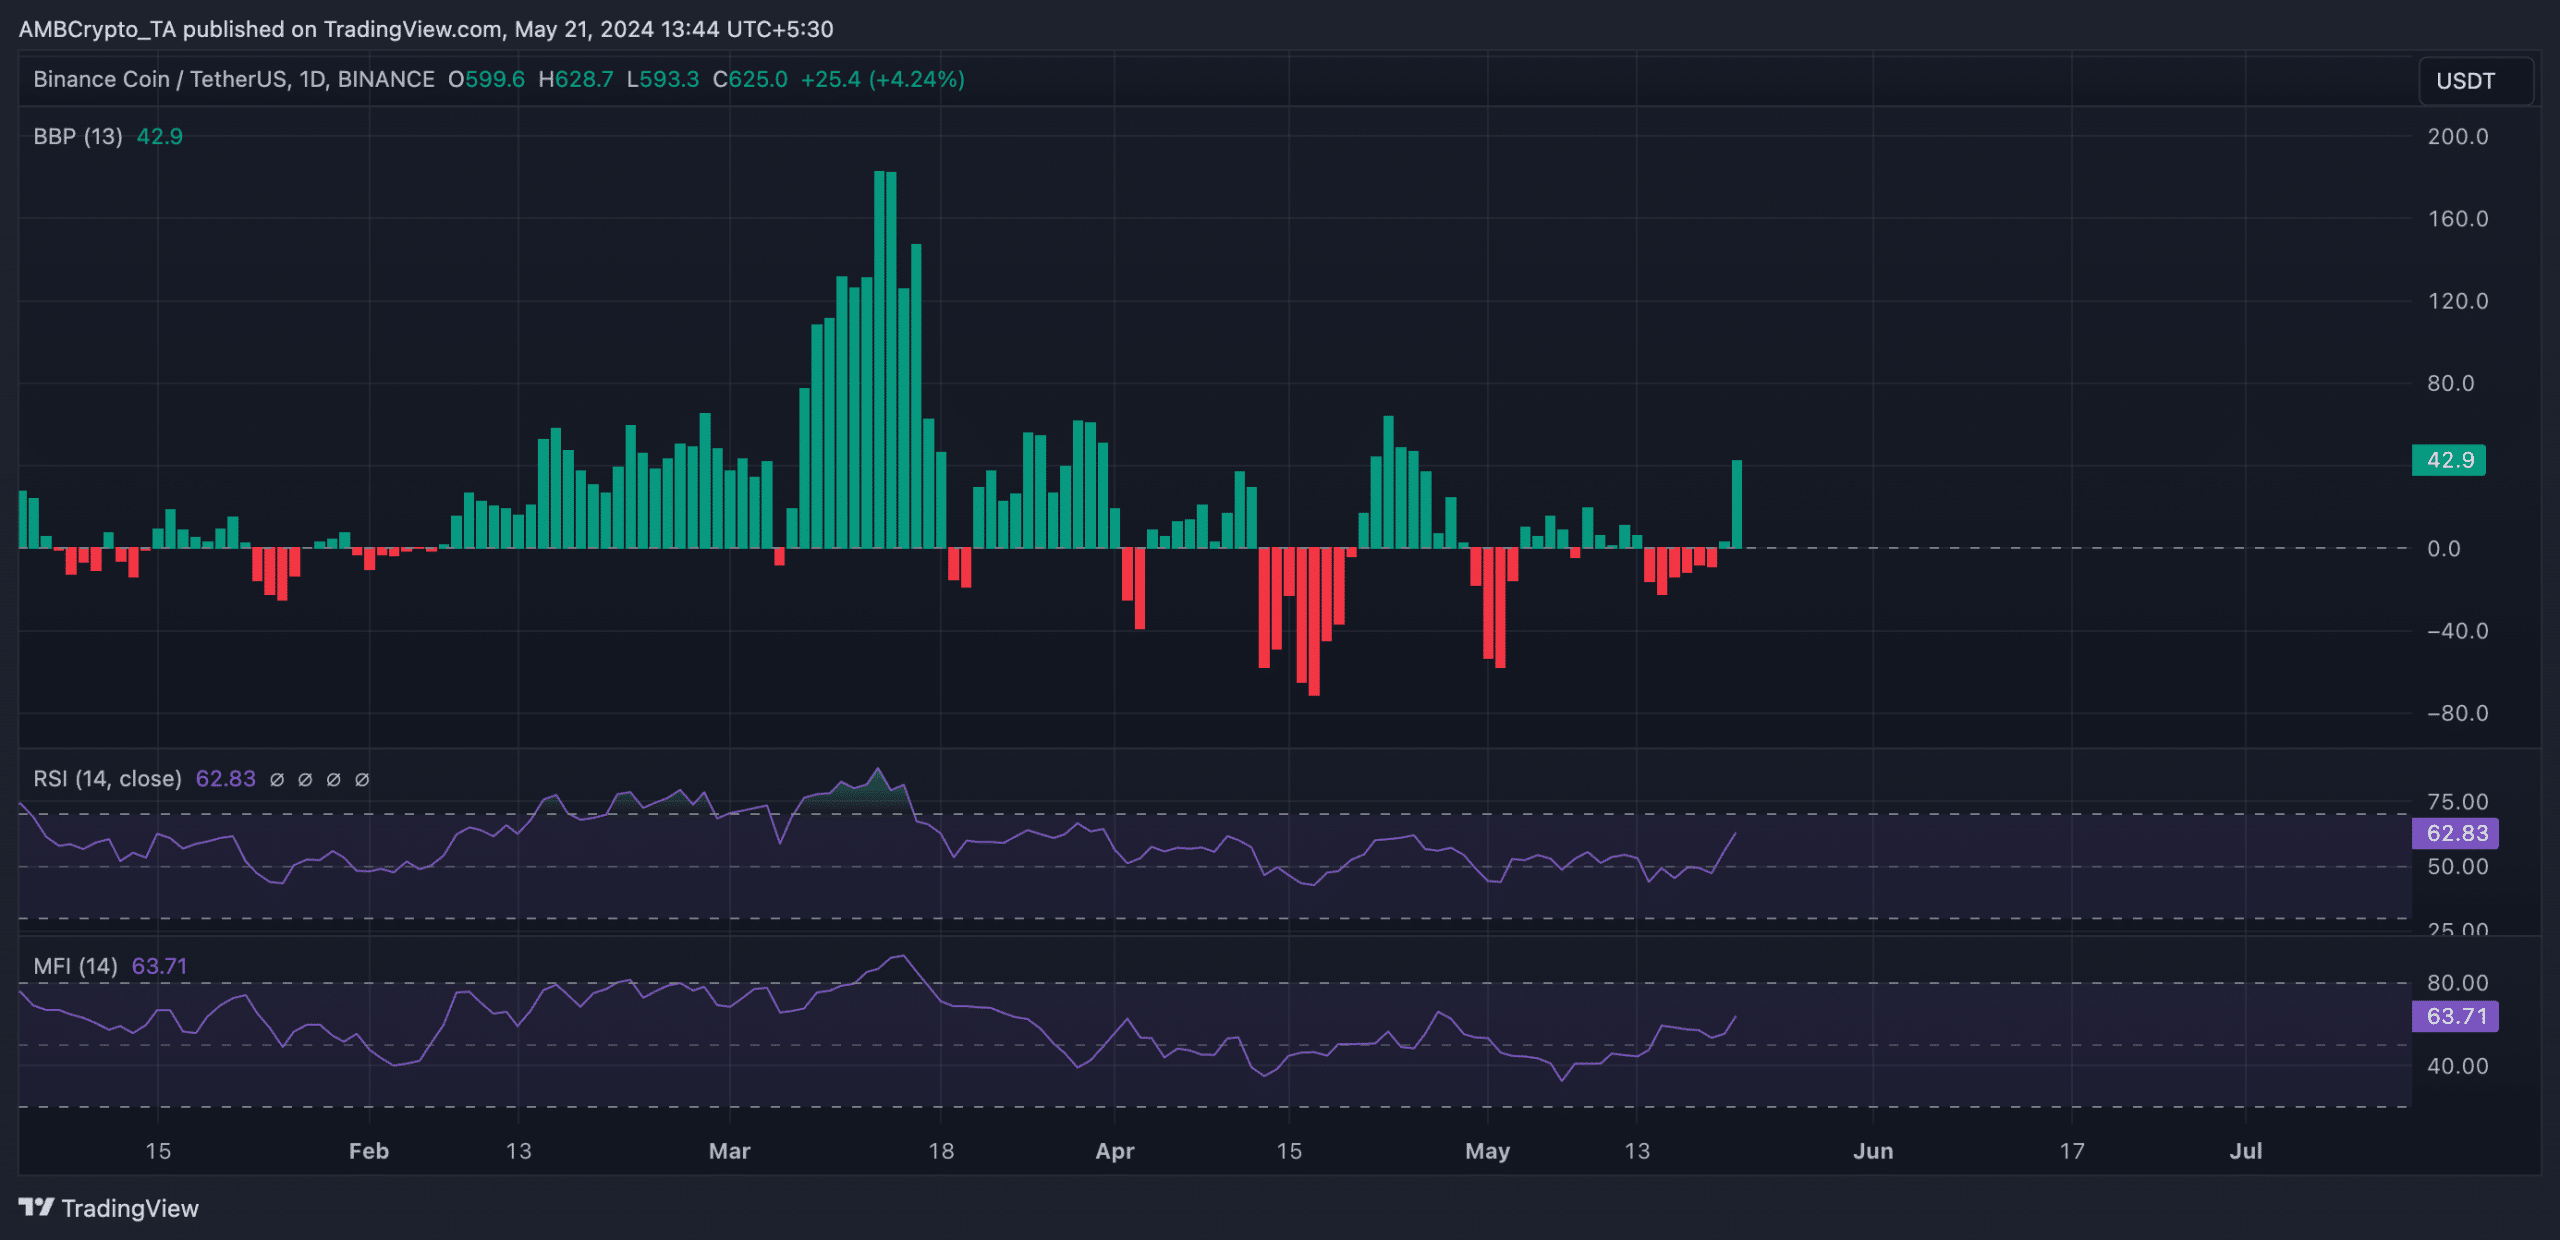
The coin’s Elder-Ray Index returned a positive value for the first time since 14 May, confirming the uptrend. This indicator measures the relationship between the strength of BNB’s buyers and sellers in the market.
When its value is positive, bull power dominates the market. As of this writing, BNB’s Elder-Ray Index was 41.44.
Further, the coin’s key momentum indicators trended upward, suggesting that the price hike in the past 24 hours has been backed by real demand for BNB.
Its Relative Strength Index (RSI) was 62.49, while its Money Flow Index (MFI) was 63.37.
At these values, these indicators showed that market participants preferred to buy more BNB coins rather than sell their current holdings.
Source: BNB/USDT, TradingView
Is your portfolio green? Check out the BNB Profit Calculator
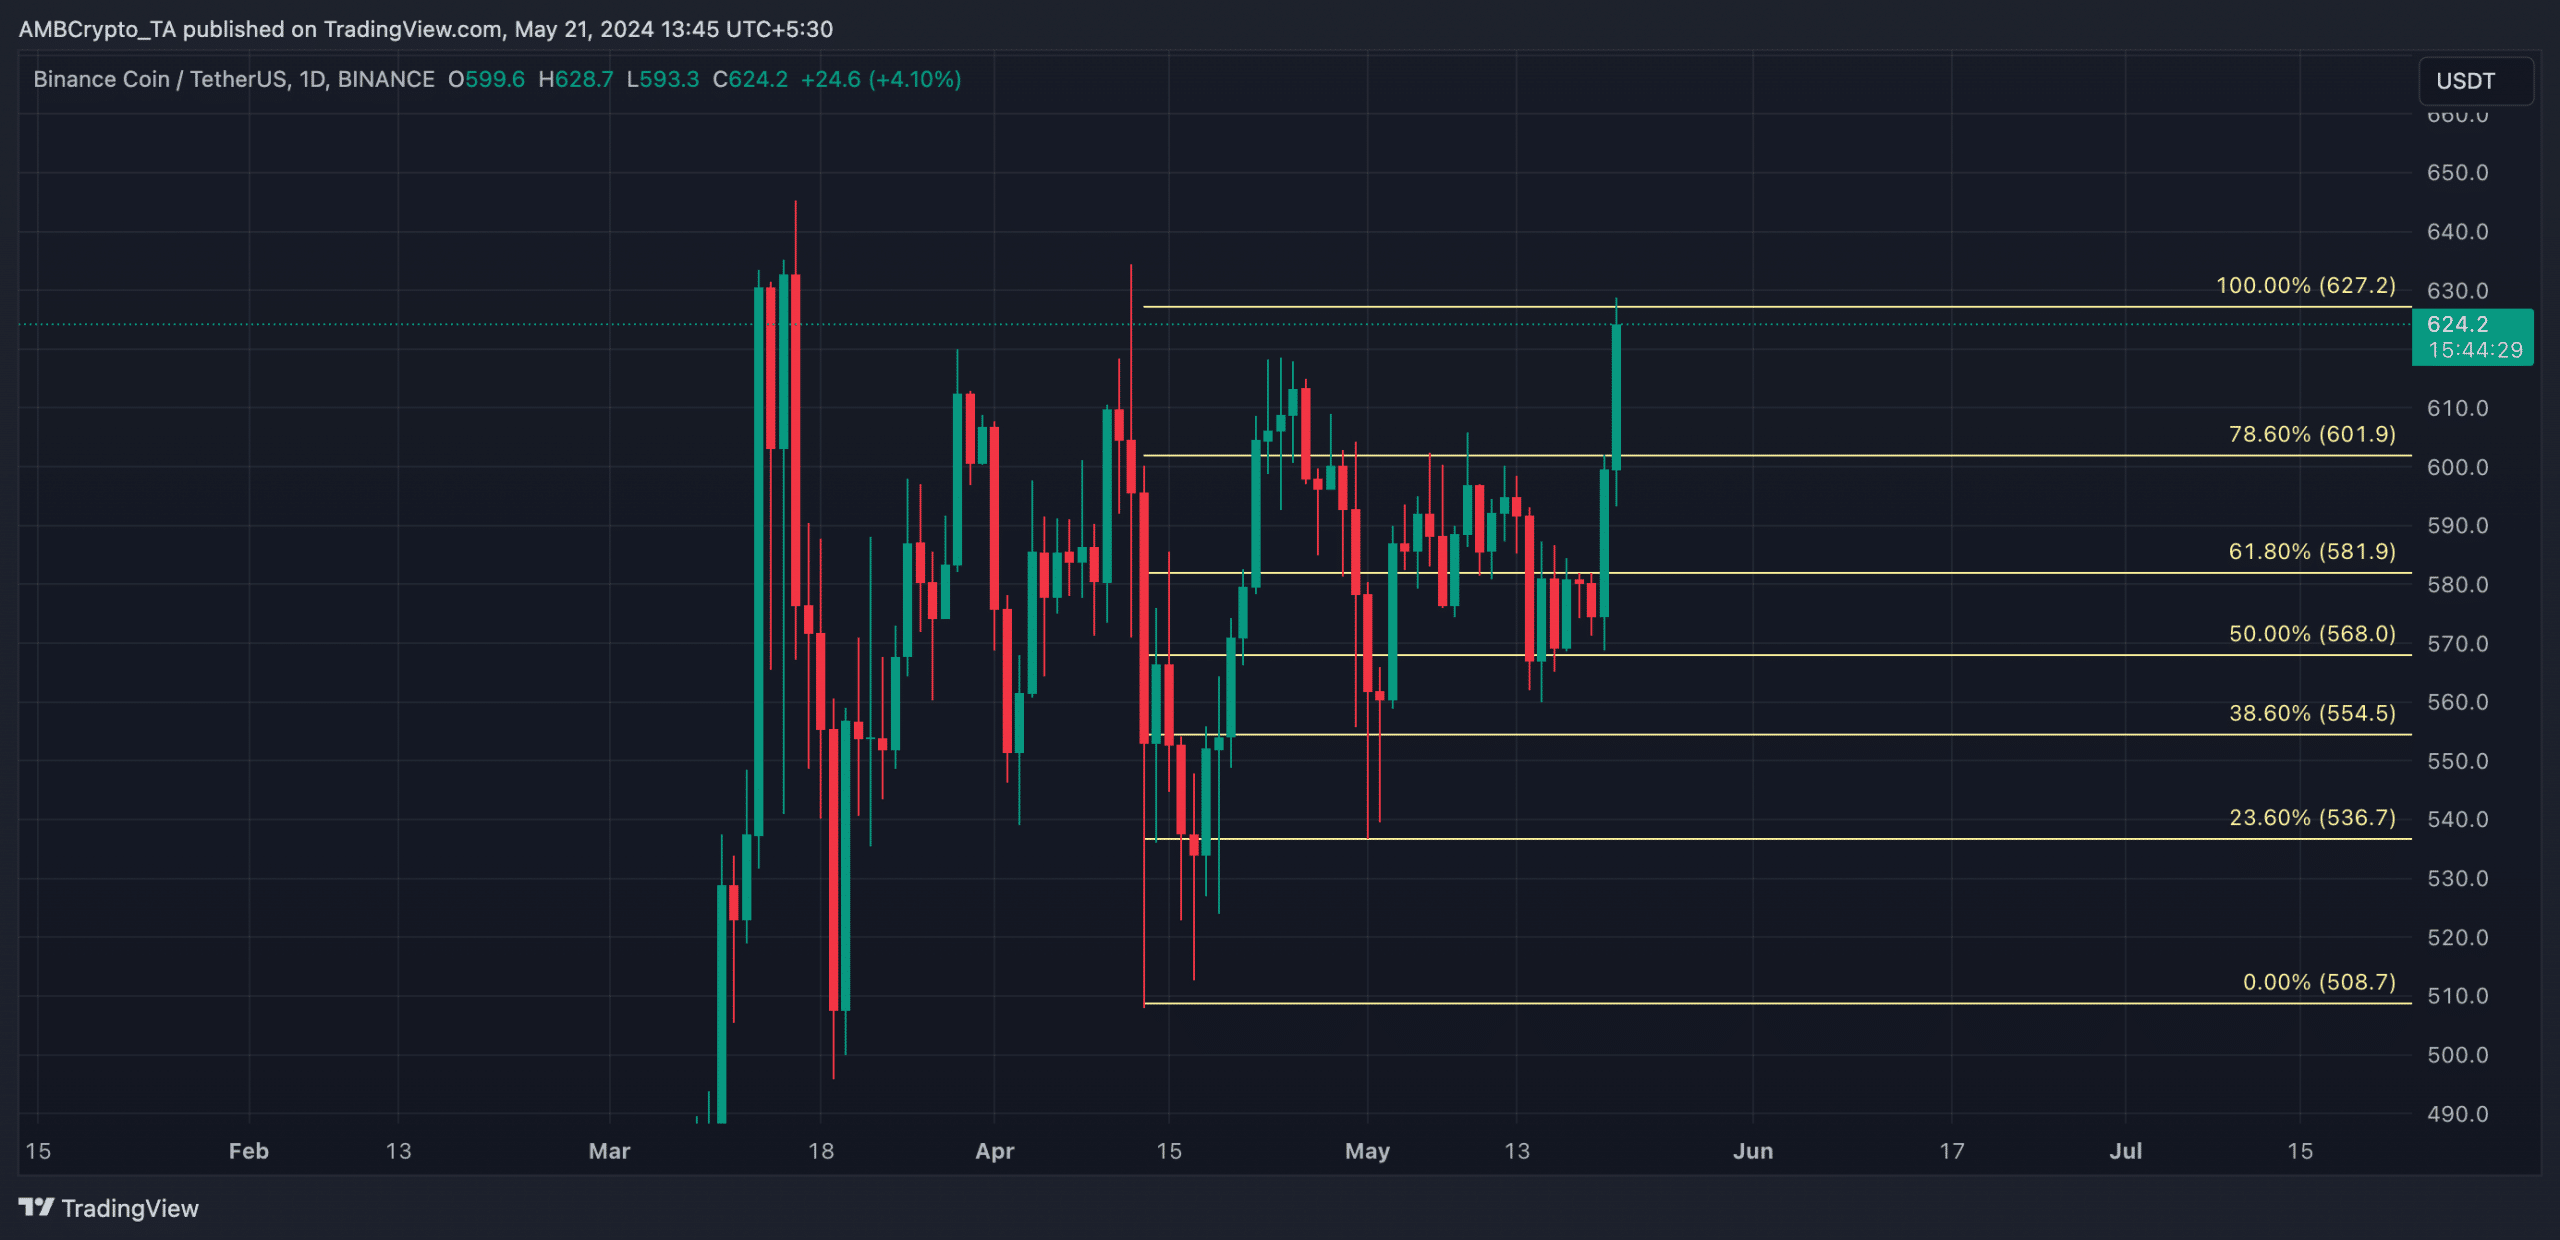
Regarding the coin’s next price point, if the buying momentum continues to grow, BNB may rally towards reclaiming its all-time high of $690, which it last reached three years ago.
Source: BNB/USDT, TradingView
However, if buyer exhaustion sets in and the bears regain control, BNB may witness a correct back to resistance under $600.
- BNB started to trade above a long-term resistance level.
- The coin’s price might reclaim its two-year-old all-time high.
Binance Coin [BNB] has broken above the upper line of its long-term symmetrical triangle, signaling a spike in buying pressure.
As of this writing, the altcoin traded at $623, above the $595 price region, which had formed a significant resistance level since March.
Source: BNB/USDT, TradingView
When an asset trades within a symmetrical triangle, its price continues to hit various lower highs and higher lows.
It suggests that the asset’s price is consolidating within a tight range, with buyers pushing prices up to meet resistance and sellers pushing them down to find support.
BNB poised for further growth
BNB’s price hike in the past 24 hours has led its price to rally above key moving averages.
At its press time price, the coin traded above its 20-day Exponential Moving Average (EMA) and its 50-day Small Moving Average (SMA) at press time.
This crossover is significant because BNB’s price had traded at these moving averages for five days, indicating indecision between the bulls and the bears before the 20 May market rally.
With this crossover, the market is in a sustained upward trend. Traders interpret it as a shift in momentum toward coin accumulation.
The coin’s Elder-Ray Index returned a positive value for the first time since 14 May, confirming the uptrend. This indicator measures the relationship between the strength of BNB’s buyers and sellers in the market.
When its value is positive, bull power dominates the market. As of this writing, BNB’s Elder-Ray Index was 41.44.
Further, the coin’s key momentum indicators trended upward, suggesting that the price hike in the past 24 hours has been backed by real demand for BNB.
Its Relative Strength Index (RSI) was 62.49, while its Money Flow Index (MFI) was 63.37.
At these values, these indicators showed that market participants preferred to buy more BNB coins rather than sell their current holdings.
Source: BNB/USDT, TradingView
Is your portfolio green? Check out the BNB Profit Calculator
Regarding the coin’s next price point, if the buying momentum continues to grow, BNB may rally towards reclaiming its all-time high of $690, which it last reached three years ago.
Source: BNB/USDT, TradingView
However, if buyer exhaustion sets in and the bears regain control, BNB may witness a correct back to resistance under $600.


can i buy clomid without prescription where can i get clomiphene price where can i get generic clomid tablets where can i buy generic clomiphene can i get generic clomid prices clomiphene prescription uk where can i get generic clomid without dr prescription
Thanks for sharing. It’s first quality.
This is the type of enter I find helpful.
purchase zithromax online – floxin online order metronidazole without prescription
buy rybelsus pills for sale – cyproheptadine 4 mg uk order periactin online
buy domperidone 10mg without prescription – order tetracycline 250mg online cheap order cyclobenzaprine online cheap
inderal 10mg drug – order methotrexate 10mg online cheap cost methotrexate 5mg
amoxil usa – purchase amoxil for sale order ipratropium sale
oral azithromycin – how to buy nebivolol bystolic order
amoxiclav for sale online – https://atbioinfo.com/ ampicillin uk
esomeprazole 40mg canada – https://anexamate.com/ esomeprazole 40mg canada
coumadin us – https://coumamide.com/ buy cheap generic losartan
buy meloxicam – moboxsin purchase mobic pill
cheap deltasone 40mg – apreplson.com buy deltasone 5mg online cheap
where to buy otc ed pills – medication for ed best place to buy ed pills online
buy amoxil sale – buy amoxicillin without prescription buy generic amoxicillin
diflucan 100mg canada – https://gpdifluca.com/ cost fluconazole 200mg
buy cenforce 100mg pill – https://cenforcers.com/ cenforce 50mg canada
teva generic cialis – https://ciltadgn.com/# cialis com free sample
order ranitidine 150mg online cheap – buy generic ranitidine buy zantac 150mg pill
cialis high blood pressure – cialis no prescription mail order cialis
I couldn’t weather commenting. Warmly written! this
viagra without doctor prescription – https://strongvpls.com/ viagra 50 mg price walgreens
More posts like this would make the blogosphere more useful. https://buyfastonl.com/azithromycin.html
I couldn’t resist commenting. Well written! https://ursxdol.com/provigil-gn-pill-cnt/
I’ll certainly carry back to read more. https://prohnrg.com/product/omeprazole-20-mg/
The thoroughness in this break down is noteworthy. https://aranitidine.com/fr/cialis-super-active/
Thanks on putting this up. It’s evidently done. https://ondactone.com/product/domperidone/