


- Ethereum’s latest bullish divergence hinted at end of bearish trend and start of a bullish trend
- CVD revealed many DEX traders are taking profits or closing their positions
Ethereum’s (ETH) market, at press time, projected a major bullish divergence, one identified by the taker buy-sell ratio against the price trend. Such a divergence often precedes a market recovery on the charts.
For instance, back in September 2023, despite the price declining to close to $1,500, the taker buy-sell ratio began to climb – A sign of buildup in buying pressure. This soon resulted in ETH recovering towards the $2,000-level.
Also, from November 2024 to January 2025, Ethereum’s price plummeted to around $2,700. However, the taker buy-sell ratio again flashed an uptrend, highlighting potential buying interest despite the fall in the altcoin’s price.
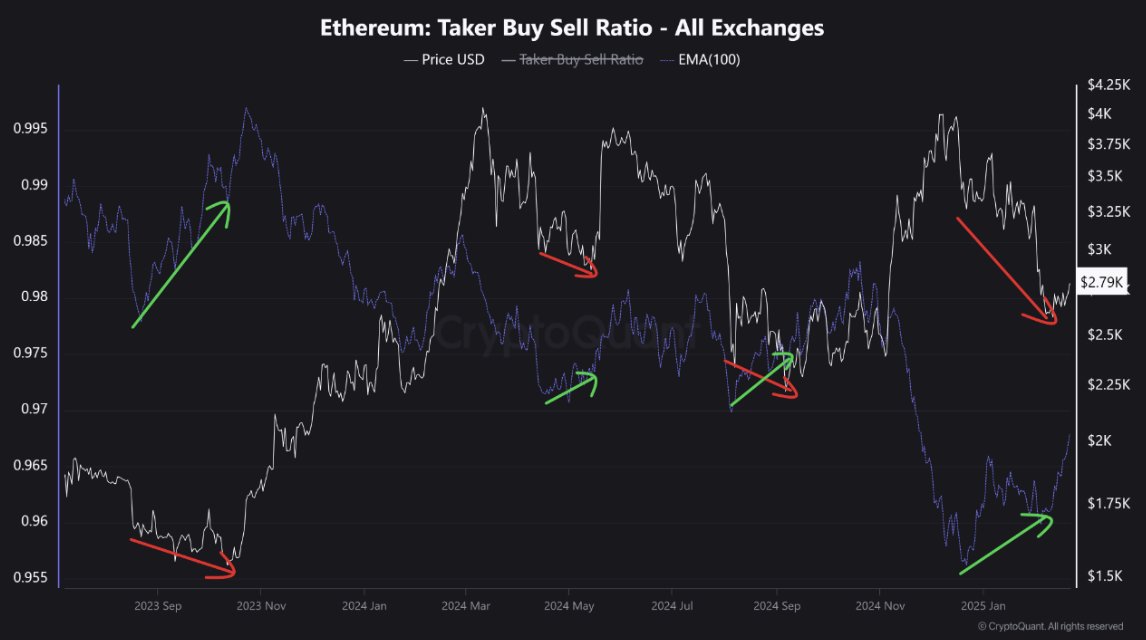
Source: CryptoQuant
Historically, such patterns signal the end of bearish phases and initiate new bullish trends.
Its latest interplay suggested that despite the press time price of $2,800, an uptrend could be imminent. This could mirror past patterns where rising taker buy activity correlated with price recoveries.
Whales vs Smart DEX traders
Furthermore, recent activities across the Ethereum ecosystem presented a striking contrast between large-scale buyers and active traders on decentralized exchanges. This was in the midst of rising prices, before the sharp drop due to the Bybit hack where $1.4 billion ETH were lost.
Notably, whale accounts have ramped up their holdings by accumulating an additional 140,000 ETH – Signaling a bullish position or a long-term hold. This mass acquisition seemed to be in line with an uptrend in ETH’s price, hinting at strong confidence among large holders.

Source: iCryptoAI/X
However, the Cumulative Volume Delta (CVD) indicated a trend where smart DEX traders have been increasingly taking profits or closing their positions. This alluded to a possible sentiment shift or risk aversion at press time price levels.
This selling activity could create short-term price volatility or pressure as profits are secured, contrasting with the whales’ accumulating behavior. The complex interplay could lead to divergent short-term versus long-term impact on Ethereum’s trajectory.
Ethereum’s log curves
Ethereum, at the time of writing, was trading in the oversold zone. This historically means a potential reversal on the charts. ETH’s price seemed to be trading below this critical threshold within the log curve zones – Increasing the likelihood of a price bounce.
Historically, such positioning has preluded major rebounds, like in mid-2017 and late 2020. During this period, ETH navigated from the oversold region to higher zones, reflecting strong buying interest at perceived value levels.

Source: Coinvo/X
Conversely, while oversold conditions often herald recoveries, external market shocks or broader bearish sentiment could override this potential, pushing ETH further down before any major recovery occurs.
The prevailing oversold status could catalyze a bullish reversal or trigger a longer downtrend.
- Ethereum’s latest bullish divergence hinted at end of bearish trend and start of a bullish trend
- CVD revealed many DEX traders are taking profits or closing their positions
Ethereum’s (ETH) market, at press time, projected a major bullish divergence, one identified by the taker buy-sell ratio against the price trend. Such a divergence often precedes a market recovery on the charts.
For instance, back in September 2023, despite the price declining to close to $1,500, the taker buy-sell ratio began to climb – A sign of buildup in buying pressure. This soon resulted in ETH recovering towards the $2,000-level.
Also, from November 2024 to January 2025, Ethereum’s price plummeted to around $2,700. However, the taker buy-sell ratio again flashed an uptrend, highlighting potential buying interest despite the fall in the altcoin’s price.
Source: CryptoQuant
Historically, such patterns signal the end of bearish phases and initiate new bullish trends.
Its latest interplay suggested that despite the press time price of $2,800, an uptrend could be imminent. This could mirror past patterns where rising taker buy activity correlated with price recoveries.
Whales vs Smart DEX traders
Furthermore, recent activities across the Ethereum ecosystem presented a striking contrast between large-scale buyers and active traders on decentralized exchanges. This was in the midst of rising prices, before the sharp drop due to the Bybit hack where $1.4 billion ETH were lost.
Notably, whale accounts have ramped up their holdings by accumulating an additional 140,000 ETH – Signaling a bullish position or a long-term hold. This mass acquisition seemed to be in line with an uptrend in ETH’s price, hinting at strong confidence among large holders.
Source: iCryptoAI/X
However, the Cumulative Volume Delta (CVD) indicated a trend where smart DEX traders have been increasingly taking profits or closing their positions. This alluded to a possible sentiment shift or risk aversion at press time price levels.
This selling activity could create short-term price volatility or pressure as profits are secured, contrasting with the whales’ accumulating behavior. The complex interplay could lead to divergent short-term versus long-term impact on Ethereum’s trajectory.
Ethereum’s log curves
Ethereum, at the time of writing, was trading in the oversold zone. This historically means a potential reversal on the charts. ETH’s price seemed to be trading below this critical threshold within the log curve zones – Increasing the likelihood of a price bounce.
Historically, such positioning has preluded major rebounds, like in mid-2017 and late 2020. During this period, ETH navigated from the oversold region to higher zones, reflecting strong buying interest at perceived value levels.
Source: Coinvo/X
Conversely, while oversold conditions often herald recoveries, external market shocks or broader bearish sentiment could override this potential, pushing ETH further down before any major recovery occurs.
The prevailing oversold status could catalyze a bullish reversal or trigger a longer downtrend.


clomiphene cost clomiphene generic name can you get clomiphene pills buy clomiphene without prescription where to get cheap clomid without dr prescription generic clomiphene price how to get generic clomiphene tablets
With thanks. Loads of knowledge!
This is the type of advise I unearth helpful.
zithromax online buy – order ciprofloxacin 500 mg pills metronidazole buy online
rybelsus tablet – buy semaglutide 14 mg sale buy generic periactin
order domperidone 10mg generic – buy generic cyclobenzaprine 15mg buy flexeril online cheap
where can i buy clavulanate – https://atbioinfo.com/ purchase ampicillin pills
buy generic nexium over the counter – https://anexamate.com/ cheap esomeprazole 40mg
coumadin 2mg us – coumamide buy hyzaar pills for sale
mobic order – https://moboxsin.com/ order meloxicam pill
buy prednisone online – https://apreplson.com/ deltasone 5mg sale
buying ed pills online – buy erection pills best ed medication
buy generic amoxil – combamoxi.com buy amoxicillin
diflucan 100mg oral – fluconazole without prescription order fluconazole 100mg sale
cenforce 100mg cheap – site buy cenforce 50mg without prescription
cialis liquid for sale – how long does cialis last in your system sildenafil vs tadalafil which is better
buy zantac online cheap – on this site buy zantac 150mg
cialis active ingredient – https://strongtadafl.com/ buying generic cialis online safe
Thanks recompense sharing. It’s top quality. on this site
cheap viagra scams – https://strongvpls.com/ order viagra ireland
More posts like this would persuade the online elbow-room more useful. https://buyfastonl.com/gabapentin.html
I am in point of fact happy to glitter at this blog posts which consists of tons of of use facts, thanks object of providing such data. https://ursxdol.com/augmentin-amoxiclav-pill/
More posts like this would prosper the blogosphere more useful. https://prohnrg.com/product/lisinopril-5-mg/
This is a theme which is virtually to my callousness… Myriad thanks! Unerringly where can I find the connection details an eye to questions? https://aranitidine.com/fr/ciagra-professional-20-mg/
I am in point of fact enchant‚e ‘ to coup d’oeil at this blog posts which consists of tons of worthwhile facts, thanks object of providing such data. https://ondactone.com/spironolactone/
This is the amicable of glad I get high on reading.
https://doxycyclinege.com/pro/spironolactone/
More posts like this would make the blogosphere more useful. http://www.fujiapuerbbs.com/home.php?mod=space&uid=3616674
buy forxiga generic – https://janozin.com/# order forxiga 10mg pills
xenical over the counter – https://asacostat.com/# cheap xenical 120mg
This website really has all of the tidings and facts I needed there this case and didn’t comprehend who to ask. https://lzdsxxb.com/home.php?mod=space&uid=5112657