


- Ethereum saw slight exchange outflows over the past 48 hours
- The heavy Open Interest nuke and high dormant circulation spike underlined the bearish sentiment in recent days
Ethereum [ETH] faced rejection at the $3.5k resistance zone. The market-wide panic in recent days spurred a 38% drop to $2,125 for Ethereum before a price bounce to $2,921 occurred a few hours after the drop.

Source: Coinglass
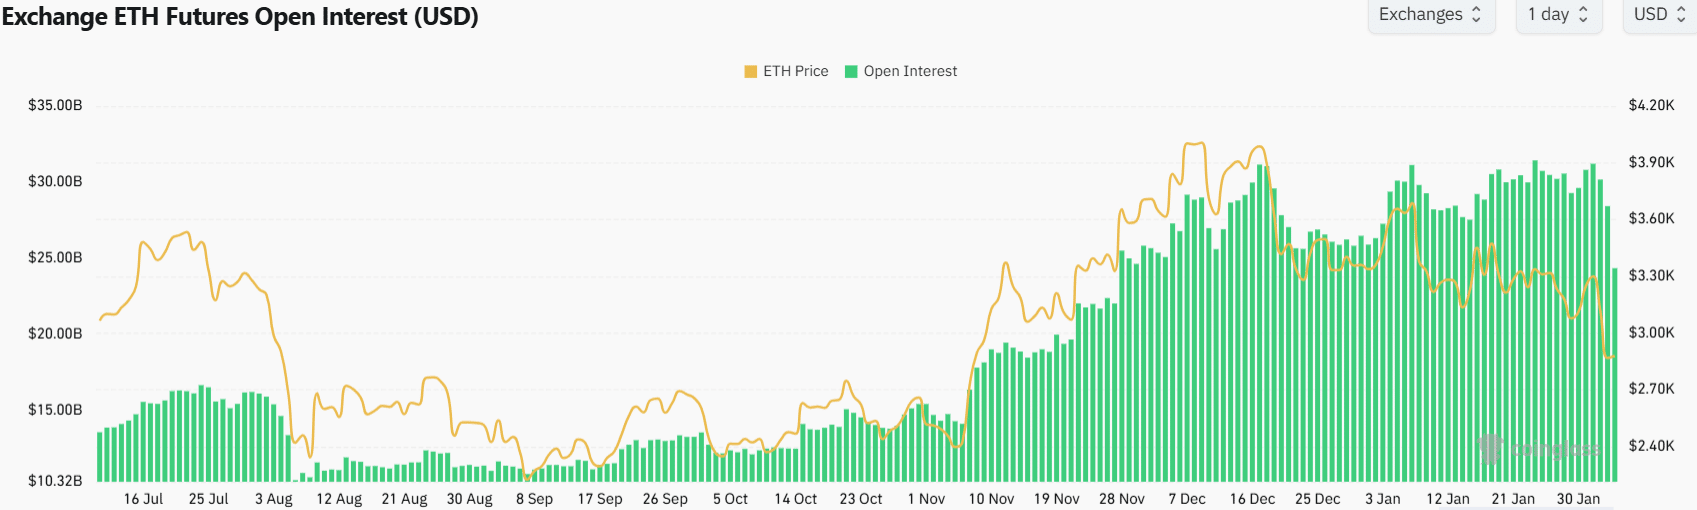
The quick drop wiped out a large amount of Open Interest (OI) as the entire market saw liquidations that could be between $8 billion to $10 billion.
The ETH OI was near the mid-November levels after the recent wipe out. Unfortunately for the holders, the price was considerably lower, roughly 12% down from November.
Should Ethereum bulls buy more or wait?

Source: CryptoQuant
The on-chain metrics showed discouraging signals. The taker buy-sell ratio is the ratio of buyer volume to seller volume of takers (market orders as opposed to limit) in perpetual swaps. This seller dominance showed heightened fear in the market.
Additionally, this metric has been negative for the majority of the past three months. The price action has also struggled to sustain a strong uptrend, unlike Bitcoin [BTC] or some of the other large cap altcoins.

Source: CryptoQuant
The Exchange Netflows had been positive while ETH trended higher in November. This positive netflow manifested itself during the price’s way down. Increased inflows (positive netflows) indicate heightened potential for selling pressure.
Over the past couple of days, the 7-day Moving Average (MA) fell into negative territory, showing slight outflows and some signs of accumulation.

Source: Santiment
The dormant circulation saw a strong spike during the retest of the $3.5k resistance on the 31st of January. This was also when the U.S. markets, especially tech stocks, saw large losses.
Is your portfolio green? Check the Ethereum Profit Calculator
The Funding Rate was also negative in recent days. Meanwhile, the Mean Coin Age (2 year) has plateaued over the past two weeks after trending upward since late December. This was similar to what occurred in September.
Therefore, the short to medium term sentiment was strongly bearish. The price action underlined the importance of the $3.5k resistance zone.
Yet, the Mean Coin Age and the slight negative outflows were modest indications of bullish hope.
- Ethereum saw slight exchange outflows over the past 48 hours
- The heavy Open Interest nuke and high dormant circulation spike underlined the bearish sentiment in recent days
Ethereum [ETH] faced rejection at the $3.5k resistance zone. The market-wide panic in recent days spurred a 38% drop to $2,125 for Ethereum before a price bounce to $2,921 occurred a few hours after the drop.
Source: Coinglass
The quick drop wiped out a large amount of Open Interest (OI) as the entire market saw liquidations that could be between $8 billion to $10 billion.
The ETH OI was near the mid-November levels after the recent wipe out. Unfortunately for the holders, the price was considerably lower, roughly 12% down from November.
Should Ethereum bulls buy more or wait?
Source: CryptoQuant
The on-chain metrics showed discouraging signals. The taker buy-sell ratio is the ratio of buyer volume to seller volume of takers (market orders as opposed to limit) in perpetual swaps. This seller dominance showed heightened fear in the market.
Additionally, this metric has been negative for the majority of the past three months. The price action has also struggled to sustain a strong uptrend, unlike Bitcoin [BTC] or some of the other large cap altcoins.
Source: CryptoQuant
The Exchange Netflows had been positive while ETH trended higher in November. This positive netflow manifested itself during the price’s way down. Increased inflows (positive netflows) indicate heightened potential for selling pressure.
Over the past couple of days, the 7-day Moving Average (MA) fell into negative territory, showing slight outflows and some signs of accumulation.
Source: Santiment
The dormant circulation saw a strong spike during the retest of the $3.5k resistance on the 31st of January. This was also when the U.S. markets, especially tech stocks, saw large losses.
Is your portfolio green? Check the Ethereum Profit Calculator
The Funding Rate was also negative in recent days. Meanwhile, the Mean Coin Age (2 year) has plateaued over the past two weeks after trending upward since late December. This was similar to what occurred in September.
Therefore, the short to medium term sentiment was strongly bearish. The price action underlined the importance of the $3.5k resistance zone.
Yet, the Mean Coin Age and the slight negative outflows were modest indications of bullish hope.


cost clomid without insurance buy cheap clomiphene no prescription can you get cheap clomid for sale buying generic clomid good rx clomiphene where buy cheap clomiphene without dr prescription can you buy clomid without rx
Greetings! Jolly productive advice within this article! It’s the scarcely changes which choice obtain the largest changes. Thanks a quantity quest of sharing!
This is the kind of criticism I truly appreciate.
purchase zithromax pills – cost tindamax 500mg buy flagyl 200mg generic
cost semaglutide – semaglutide 14 mg tablet cyproheptadine 4mg for sale
buy motilium without prescription – buy cyclobenzaprine pills for sale cyclobenzaprine 15mg pills
inderal 20mg us – inderal 10mg canada methotrexate 10mg drug
amoxicillin online – buy valsartan 160mg buy combivent generic
zithromax 500mg price – bystolic 20mg ca order generic nebivolol 20mg
buy amoxiclav generic – atbioinfo.com ampicillin order
order esomeprazole without prescription – nexiumtous order generic nexium 40mg
order coumadin generic – coumamide cozaar generic
order mobic 15mg – mobo sin buy mobic 7.5mg online cheap
order prednisone 5mg sale – https://apreplson.com/ order deltasone 5mg for sale
online ed pills – fastedtotake ed pills cheap
purchase amoxil sale – https://combamoxi.com/ buy amoxicillin generic
diflucan 100mg oral – https://gpdifluca.com/ purchase diflucan generic
buy cenforce pills – https://cenforcers.com/ cenforce over the counter
order cialis online cheap generic – https://ciltadgn.com/# cheap canadian cialis
buy voucher for cialis daily online – https://strongtadafl.com/# cialis canada
ranitidine 300mg price – https://aranitidine.com/ zantac 150mg pill
cheap viagra no prescription canada – https://strongvpls.com/ viagra 50 mg pill
This website absolutely has all of the bumf and facts I needed to this subject and didn’t identify who to ask. https://gnolvade.com/
This is the make of advise I unearth helpful. https://ursxdol.com/get-cialis-professional/
This is the amicable of serenity I get high on reading. https://prohnrg.com/product/loratadine-10-mg-tablets/
I’ll certainly return to be familiar with more. https://aranitidine.com/fr/ivermectine-en-france/
Palatable blog you have here.. It’s severely to assign strong worth article like yours these days. I really appreciate individuals like you! Go through guardianship!! https://ondactone.com/spironolactone/
This is a topic which is in to my verve… Many thanks! Unerringly where can I lay one’s hands on the phone details in the course of questions?
buy levaquin 500mg pill
This is the gentle of criticism I truly appreciate. http://forum.ttpforum.de/member.php?action=profile&uid=425015