


- Ethereum’s price action was mirroring the 2016/17 pattern that led to a rally.
- The whales buying 1.10 million Ethereum suggested they could know something, but is a rally on the cards?
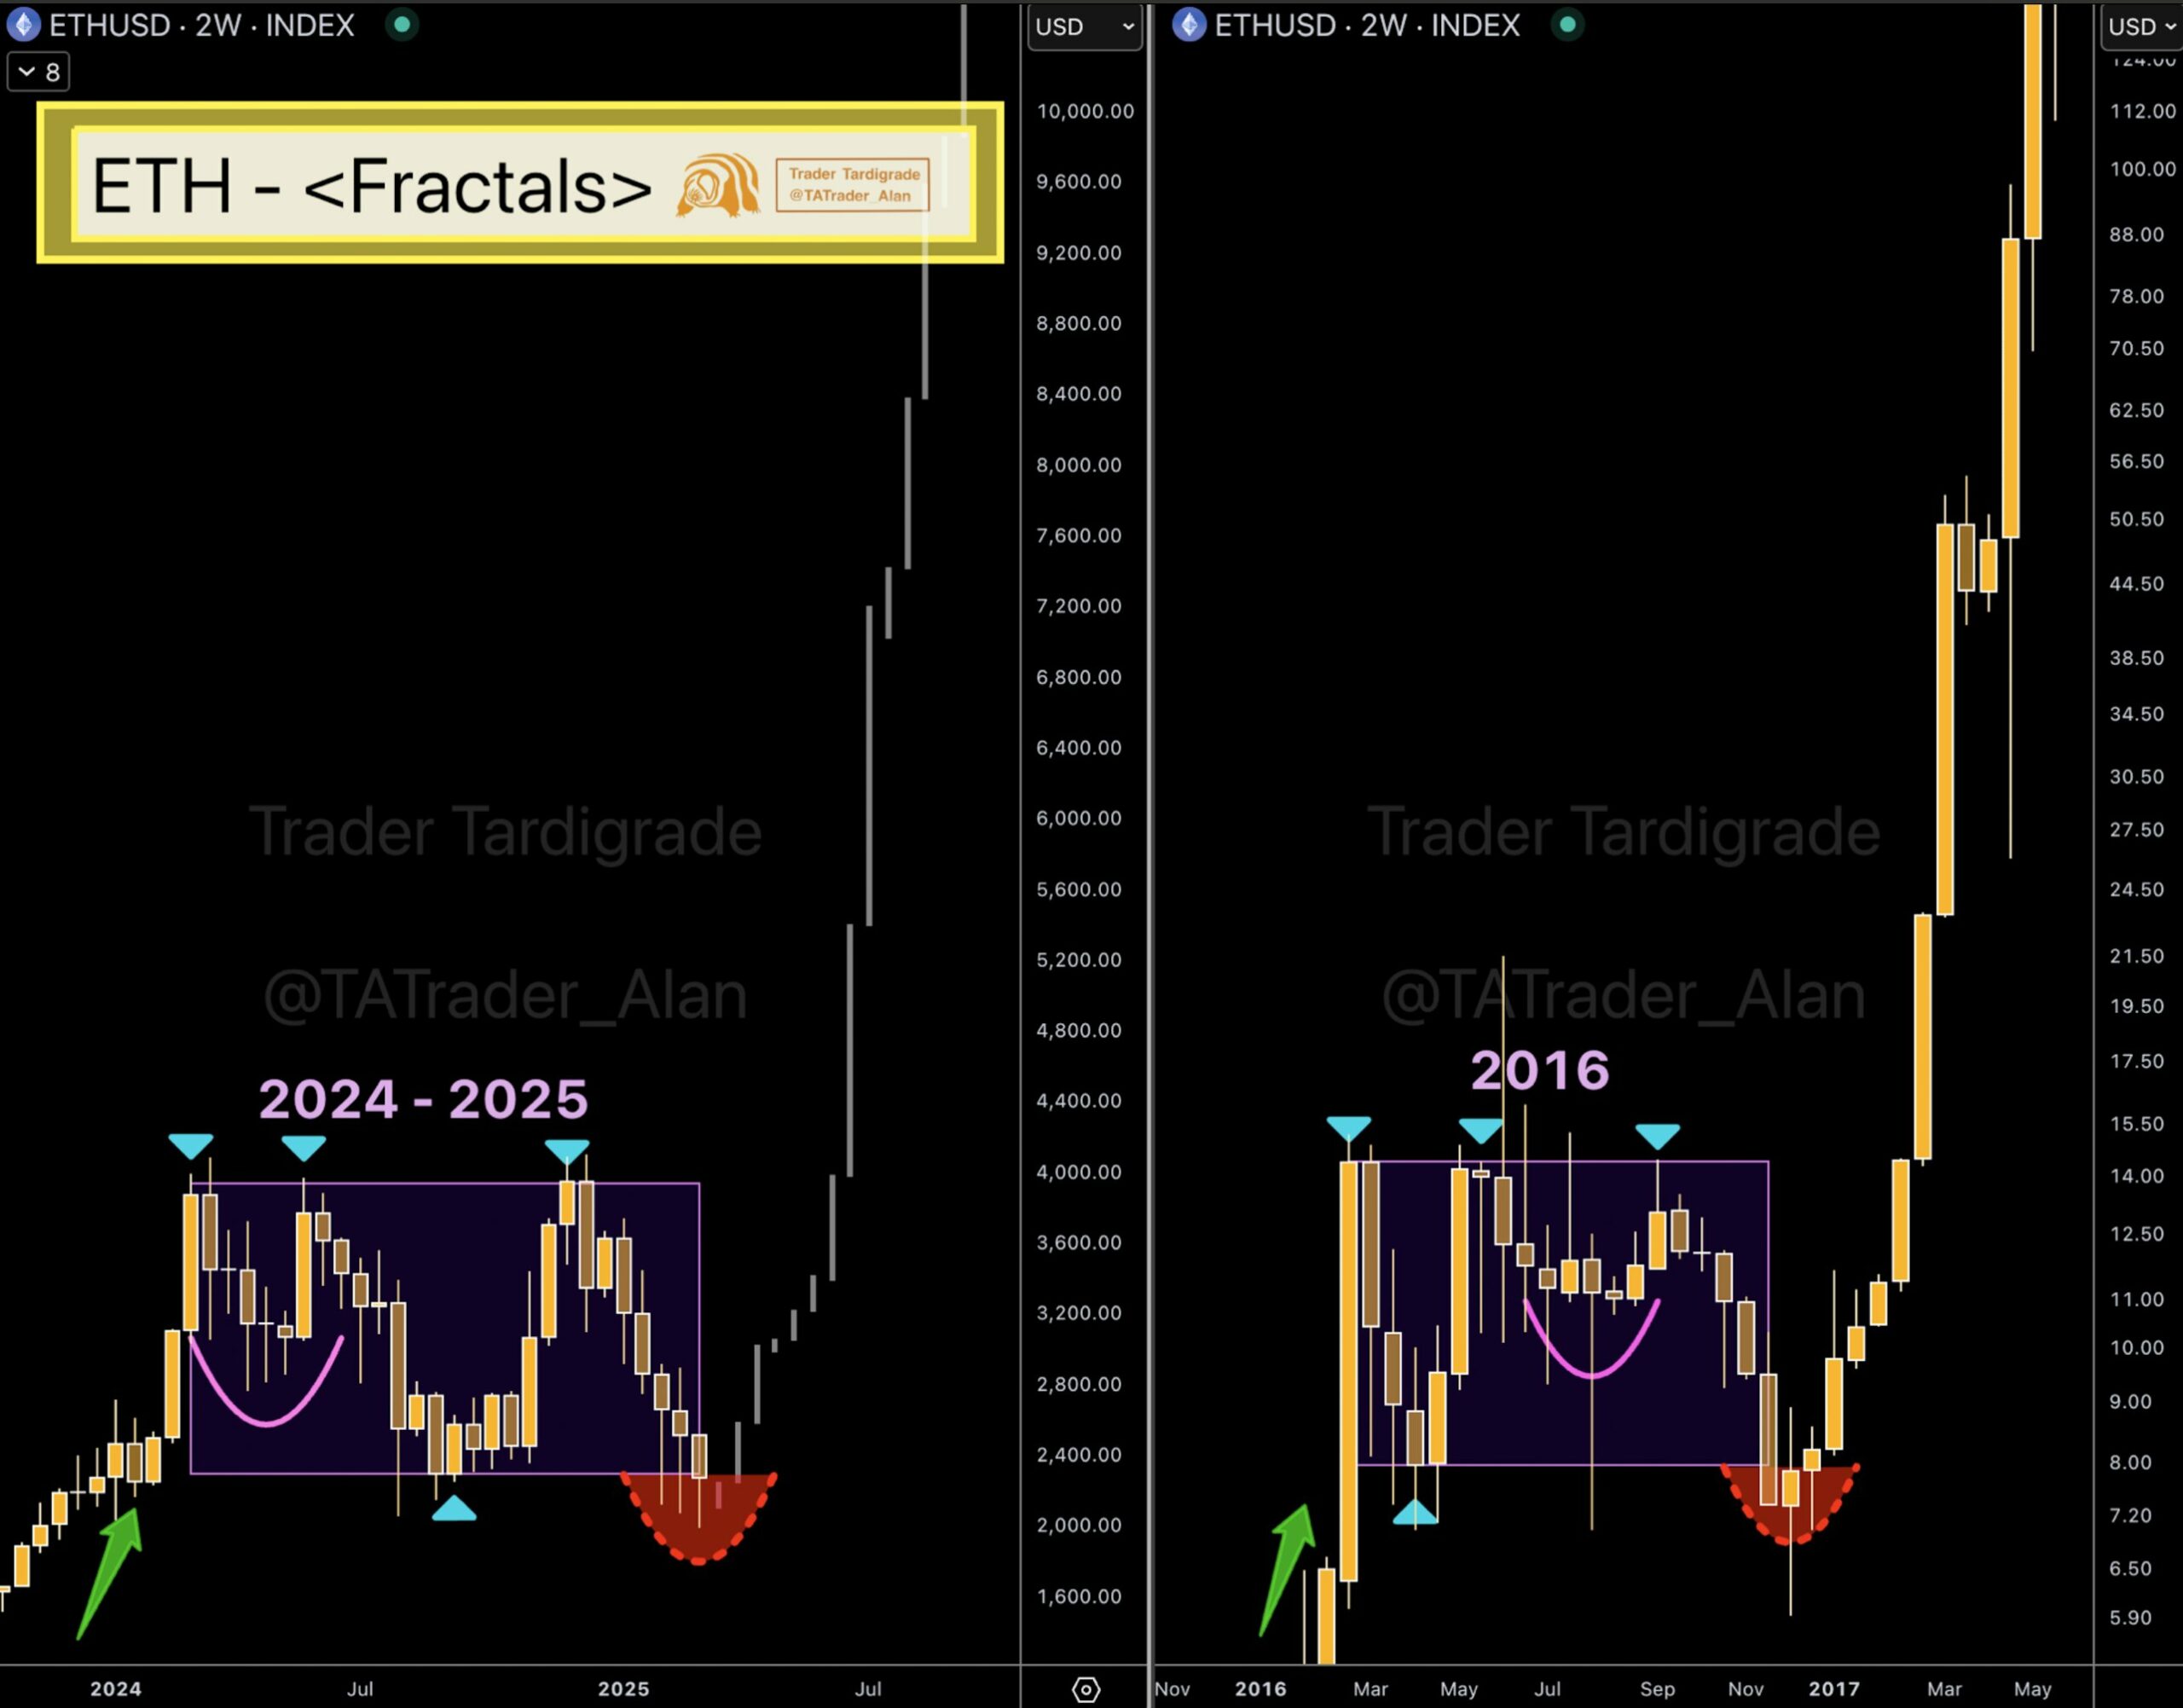
Ethereum [ETH] price charts in 2016 and 2024-2025 show a very interesting fractal pattern, indicating a likely large rally like that of 2017. ETH’s price trend in 2016 featured a series of lows and highs, culminating in a dramatic spike.
Recently, Ethereum has displayed a similar pattern, marked by large price movements and a breakdown preceding a potential surge. In early 2024, ETH dropped to around $2,400, then rebounded to approximately $4,000. It is now retesting the $2,400 support level.
This fractal pattern suggests that if ETH mirrors its historical behavior, the $2,400 support could spark a new bull run.
However, failing to hold this support might trigger another round of declines, similar to the sharp short-term sell-offs of the previous cycle.

Source: X
The total move from the 2024 low to the current high is a gain of over $2,000 per ETH. This recent phenomenon of rapid bounce back from steep drops might be a sign of strength if support levels at hand can resist market stress.
Considering these trends, Ethereum can be readying to mirror price increases similar to its 2017 to late 2016 rally.
However, if the trend is not sustained, we can expect a reversal situation with potential dips.
How whales could fuel ETH pattern completion?
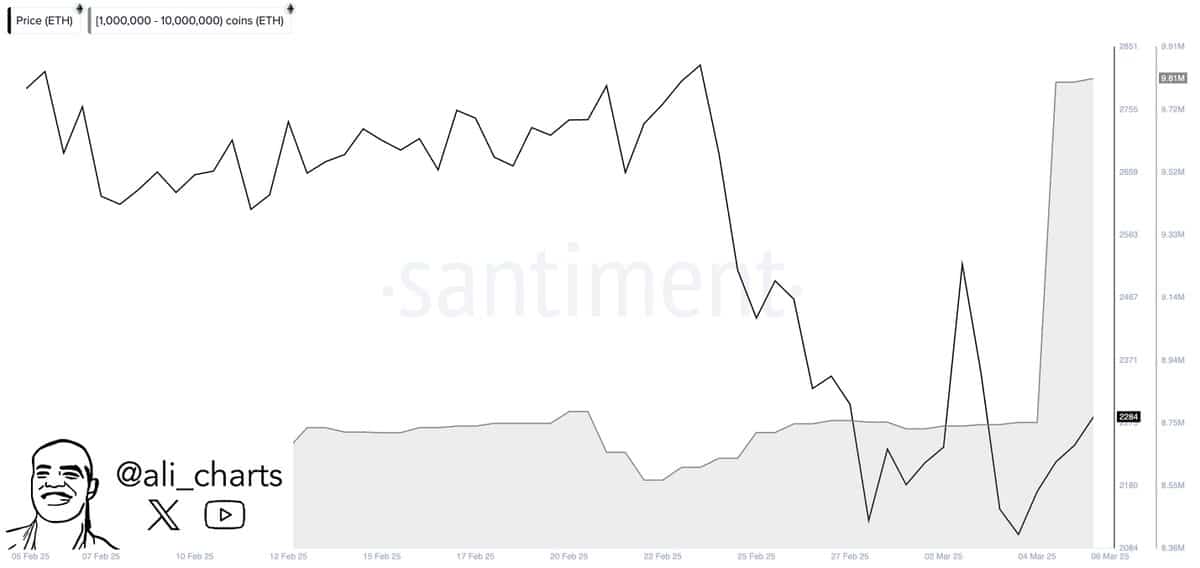
Whales have recently been highly active, collectively purchasing 1.10 million ETH. This increased activity coincided with a sharp price drop, followed by a quick recovery.
Between the 25th of February and the 4th of March, ETH’s price fell to $2,184 before rebounding to approximately $2,284.
This whale accumulation may signal anticipation of a market rally, potentially driving these significant purchases.
Historically, such large-scale buying by market movers often precedes rallies, as they may have access to advanced market analysis tools or insights predicting future price appreciation.
Source: X
Conversely, If whales reverse their buying activity and start selling, it could create downward pressure and potentially trigger a sell-off.
However, if ETH holds steady at its recent rebound level and whales continue accumulating, it may signal the start of a bull trend.
On the other hand, a drop below the recent low would confirm bearish sentiment, likely leading to further price declines. The market is at a critical juncture, and Ethereum’s next move will play a key role in shaping short-term price action.
- Ethereum’s price action was mirroring the 2016/17 pattern that led to a rally.
- The whales buying 1.10 million Ethereum suggested they could know something, but is a rally on the cards?
Ethereum [ETH] price charts in 2016 and 2024-2025 show a very interesting fractal pattern, indicating a likely large rally like that of 2017. ETH’s price trend in 2016 featured a series of lows and highs, culminating in a dramatic spike.
Recently, Ethereum has displayed a similar pattern, marked by large price movements and a breakdown preceding a potential surge. In early 2024, ETH dropped to around $2,400, then rebounded to approximately $4,000. It is now retesting the $2,400 support level.
This fractal pattern suggests that if ETH mirrors its historical behavior, the $2,400 support could spark a new bull run.
However, failing to hold this support might trigger another round of declines, similar to the sharp short-term sell-offs of the previous cycle.
Source: X
The total move from the 2024 low to the current high is a gain of over $2,000 per ETH. This recent phenomenon of rapid bounce back from steep drops might be a sign of strength if support levels at hand can resist market stress.
Considering these trends, Ethereum can be readying to mirror price increases similar to its 2017 to late 2016 rally.
However, if the trend is not sustained, we can expect a reversal situation with potential dips.
How whales could fuel ETH pattern completion?
Whales have recently been highly active, collectively purchasing 1.10 million ETH. This increased activity coincided with a sharp price drop, followed by a quick recovery.
Between the 25th of February and the 4th of March, ETH’s price fell to $2,184 before rebounding to approximately $2,284.
This whale accumulation may signal anticipation of a market rally, potentially driving these significant purchases.
Historically, such large-scale buying by market movers often precedes rallies, as they may have access to advanced market analysis tools or insights predicting future price appreciation.
Source: X
Conversely, If whales reverse their buying activity and start selling, it could create downward pressure and potentially trigger a sell-off.
However, if ETH holds steady at its recent rebound level and whales continue accumulating, it may signal the start of a bull trend.
On the other hand, a drop below the recent low would confirm bearish sentiment, likely leading to further price declines. The market is at a critical juncture, and Ethereum’s next move will play a key role in shaping short-term price action.


can you buy clomid without insurance where to buy cheap clomid tablets cheap clomid without insurance buying cheap clomiphene price order generic clomid without rxРіРѕРІРѕСЂРёС‚: can i order generic clomid without rx get cheap clomiphene pills
The vividness in this ruined is exceptional.
More posts like this would bring about the blogosphere more useful.
buy azithromycin no prescription – zithromax 250mg sale buy metronidazole for sale
order semaglutide 14 mg for sale – semaglutide 14 mg without prescription purchase periactin without prescription
motilium ca – sumycin pill buy generic cyclobenzaprine
buy propranolol generic – plavix 75mg generic cheap methotrexate 10mg
amoxiclav for sale online – atbioinfo buy acillin generic
oral nexium 40mg – https://anexamate.com/ order nexium 20mg generic
order coumadin 2mg sale – anticoagulant order cozaar online cheap
meloxicam sale – https://moboxsin.com/ order meloxicam pill
order generic deltasone 20mg – corticosteroid buy prednisone 20mg generic
buy ed pills online – https://fastedtotake.com/ can you buy ed pills online
purchase amoxil for sale – combamoxi.com buy amoxil without prescription
order generic diflucan 100mg – on this site fluconazole canada
buy cenforce online – order cenforce 100mg pills buy cheap generic cenforce
cialis erection – cialis genetic buy cialis 20 mg online
order zantac 150mg pills – https://aranitidine.com/ buy cheap generic ranitidine
side effects of cialis tadalafil – cialis bodybuilding tadalafil oral jelly
can you buy viagra vietnam – https://strongvpls.com/# 50mg generic viagra
The vividness in this piece is exceptional. gnolvade.com
This is a keynote which is forthcoming to my heart… Myriad thanks! Unerringly where can I notice the contact details for questions? https://buyfastonl.com/azithromycin.html
I couldn’t resist commenting. Warmly written! https://ursxdol.com/provigil-gn-pill-cnt/
The thoroughness in this break down is noteworthy. https://ondactone.com/product/domperidone/
More posts like this would create the online space more useful.
buy reglan 20mg pills
This is a theme which is forthcoming to my fundamentals… Myriad thanks! Exactly where can I find the contact details in the course of questions? http://www.predictive-datascience.com/forum/member.php?action=profile&uid=44951
buy forxiga without a prescription – janozin.com forxiga where to buy
buy orlistat for sale – order xenical pills purchase orlistat for sale