- Ethereum rose above $3,720, signaling bullish momentum toward the $4,000 milestone.
- Key resistance at $3,900 and RSI nearing overbought territory may challenge the breakout.
Ethereum’s [ETH] showing promising signs of a breakout, with its price steadily rising above key resistance levels.
After stabilizing above $3,500, ETH has gained momentum, surpassing key thresholds like $3,650 and $3,720.
As bullish indicators strengthen, Ethereum seems poised for significant price movement. However, the crucial question remains: Will Ethereum bulls push the price above $3,900 and aim for the coveted $4,000 mark, or will market resistance cause a potential reversal?
Breakdown of ETH’s price movements
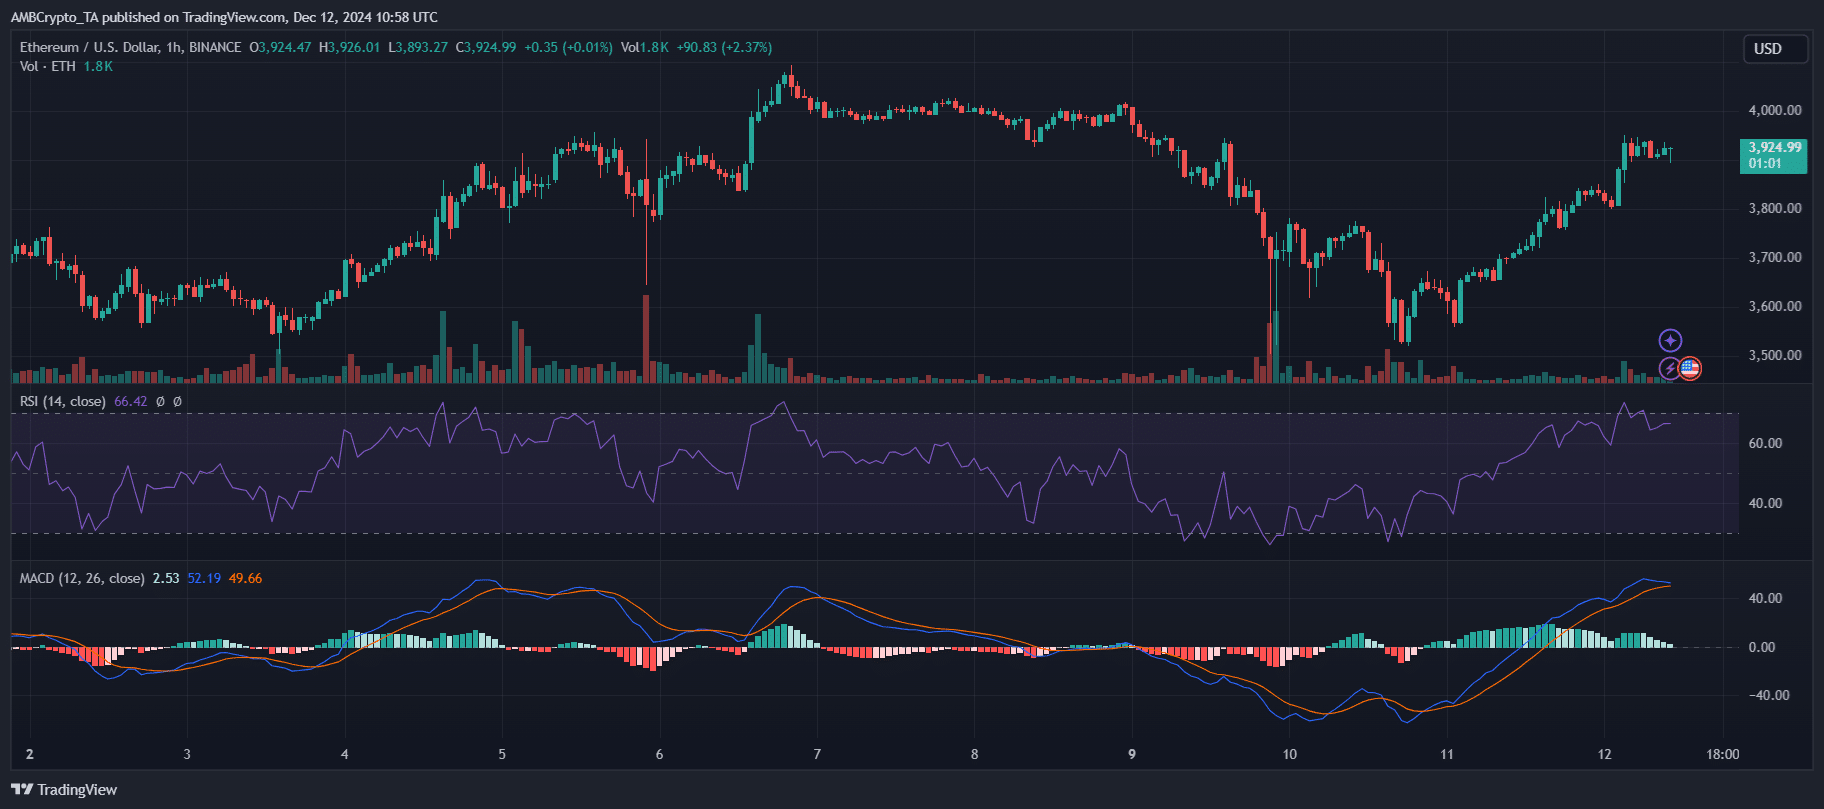
Ethereum’s recent price trajectory highlights its resilience amid fluctuating market conditions. After stabilizing above $3,500, ETH demonstrated a consistent bullish structure, marked by a series of higher lows and higher highs.
The price action formed a clear upward channel, with ETH crossing key thresholds like $3,650 and $3,720.

Source: TradingView
Notably, the volume surge during key breakouts confirms strong buyer participation. The RSI also breached the midline, moving into bullish territory, which further solidified the uptrend.
As the chart reveals, Ethereum recently tested the $3,900 resistance zone, reflecting the increasing strength of market bulls. However, minor pullbacks within this rally indicate potential hesitation among buyers.
This consolidation phase may define whether ETH secures the next leg toward $4,000 or faces a temporary setback.
The key to ETH’s breakout
Ethereum’s breakout hinges on critical support levels that underpin its bullish momentum. The $3,650-$3,720 zone has acted as a reliable support floor, absorbing selling pressure and fueling upward momentum.
RSI levels around 65 suggest ETH is nearing overbought territory, but still has room for further gains. Meanwhile, the MACD histogram shows bullish crossover signals, with the MACD line staying above the signal line; a hallmark of sustained upward momentum.
However, as ETH approaches the psychological $4,000 mark, traders should monitor diminishing buying volumes and weakening bullish momentum on lower timeframes.
Any failure to hold above the $3,720 support could lead to a deeper retracement, potentially revisiting $3,500. Conversely, a decisive push above $3,900 with robust volume could set the stage for a breakout beyond $4,000; failing which a short-term price correction is possible.
Read Ethereum [ETH] Price Prediction 2024-2025
Breakout or reversal for ETH?
A breakout requires strong volume confirmation and sustained bullish momentum, especially with the MACD maintaining its upward slope.
However, the RSI levels signal caution, as a rejection of this resistance could trigger a pullback. Bears may capitalize on fading momentum if buying pressure weakens. For bulls to claim $4,000, ETH must sustain higher lows while preserving critical support levels.
- Ethereum rose above $3,720, signaling bullish momentum toward the $4,000 milestone.
- Key resistance at $3,900 and RSI nearing overbought territory may challenge the breakout.
Ethereum’s [ETH] showing promising signs of a breakout, with its price steadily rising above key resistance levels.
After stabilizing above $3,500, ETH has gained momentum, surpassing key thresholds like $3,650 and $3,720.
As bullish indicators strengthen, Ethereum seems poised for significant price movement. However, the crucial question remains: Will Ethereum bulls push the price above $3,900 and aim for the coveted $4,000 mark, or will market resistance cause a potential reversal?
Breakdown of ETH’s price movements
Ethereum’s recent price trajectory highlights its resilience amid fluctuating market conditions. After stabilizing above $3,500, ETH demonstrated a consistent bullish structure, marked by a series of higher lows and higher highs.
The price action formed a clear upward channel, with ETH crossing key thresholds like $3,650 and $3,720.

Source: TradingView
Notably, the volume surge during key breakouts confirms strong buyer participation. The RSI also breached the midline, moving into bullish territory, which further solidified the uptrend.
As the chart reveals, Ethereum recently tested the $3,900 resistance zone, reflecting the increasing strength of market bulls. However, minor pullbacks within this rally indicate potential hesitation among buyers.
This consolidation phase may define whether ETH secures the next leg toward $4,000 or faces a temporary setback.
The key to ETH’s breakout
Ethereum’s breakout hinges on critical support levels that underpin its bullish momentum. The $3,650-$3,720 zone has acted as a reliable support floor, absorbing selling pressure and fueling upward momentum.
RSI levels around 65 suggest ETH is nearing overbought territory, but still has room for further gains. Meanwhile, the MACD histogram shows bullish crossover signals, with the MACD line staying above the signal line; a hallmark of sustained upward momentum.
However, as ETH approaches the psychological $4,000 mark, traders should monitor diminishing buying volumes and weakening bullish momentum on lower timeframes.
Any failure to hold above the $3,720 support could lead to a deeper retracement, potentially revisiting $3,500. Conversely, a decisive push above $3,900 with robust volume could set the stage for a breakout beyond $4,000; failing which a short-term price correction is possible.
Read Ethereum [ETH] Price Prediction 2024-2025
Breakout or reversal for ETH?
A breakout requires strong volume confirmation and sustained bullish momentum, especially with the MACD maintaining its upward slope.
However, the RSI levels signal caution, as a rejection of this resistance could trigger a pullback. Bears may capitalize on fading momentum if buying pressure weakens. For bulls to claim $4,000, ETH must sustain higher lows while preserving critical support levels.


can i get generic clomid without rx buying generic clomiphene no prescription can you get generic clomiphene without insurance can you buy cheap clomiphene online clomid tablet price how to buy cheap clomid no prescription can i purchase clomid for sale
Thanks on sharing. It’s acme quality.
I am in truth happy to gleam at this blog posts which consists of tons of profitable facts, thanks object of providing such data.
zithromax 250mg for sale – buy generic azithromycin order metronidazole for sale
rybelsus buy online – periactin uk buy periactin 4mg generic
buy motilium generic – tetracycline pill cyclobenzaprine 15mg canada
buy augmentin without prescription – atbioinfo ampicillin without prescription
buy nexium 40mg capsules – nexiumtous nexium 40mg uk
coumadin drug – coumamide order losartan 25mg sale
purchase meloxicam generic – https://moboxsin.com/ mobic cheap
prednisone 10mg cost – https://apreplson.com/ prednisone 10mg over the counter
where to buy ed pills – https://fastedtotake.com/ buy ed pills cheap
buy cheap amoxil – buy amoxicillin generic order generic amoxil
cheap fluconazole 100mg – https://gpdifluca.com/# purchase diflucan pill
buy cenforce 100mg generic – https://cenforcers.com/# order cenforce 100mg generic
purchasing cialis – https://ciltadgn.com/ mint pharmaceuticals tadalafil
cialis available in walgreens over counter?? – https://strongtadafl.com/ maxim peptide tadalafil citrate
With thanks. Loads of expertise! este sitio
where can i buy viagra from – https://strongvpls.com/# viagra buy uk
Thanks on sharing. It’s outstrip quality. azithromycin order online
More text pieces like this would create the web better. https://ursxdol.com/clomid-for-sale-50-mg/
Greetings! Utter productive recommendation within this article! It’s the petty changes which liking make the largest changes. Thanks a a quantity towards sharing! https://prohnrg.com/product/get-allopurinol-pills/
This is the compassionate of criticism I in fact appreciate. https://ondactone.com/product/domperidone/
The thoroughness in this break down is noteworthy.
https://doxycyclinege.com/pro/warfarin/
More posts like this would create the online play more useful. http://mi.minfish.com/home.php?mod=space&uid=1411828
dapagliflozin ca – dapagliflozin pill forxiga for sale online
buy orlistat pills – https://asacostat.com/# orlistat order online