- Historical design shown by the MVRV ratio, led ETH to bounce.
- While traders booked some profits, the OI indicated that more was close.
On the 8th of April, Ethereum [ETH] defied the school of thought that it was a slow move this cycle as its market cap jumped by over 9%. This increase placed its market cap at over $440 billion.
During this time, the altcoin’s price surpassed $3, 700 before its slight drop. But that was not the major highlight.
The past is sometimes the present
AMBCrypto analyzed Ethereum’s on-chain condition and observed the Market Value to Realized Value (MVRV) ratio. This ratio provides insights into traders’ buying and selling behavior. It can also help to spot the bottoms and tops of an asset.
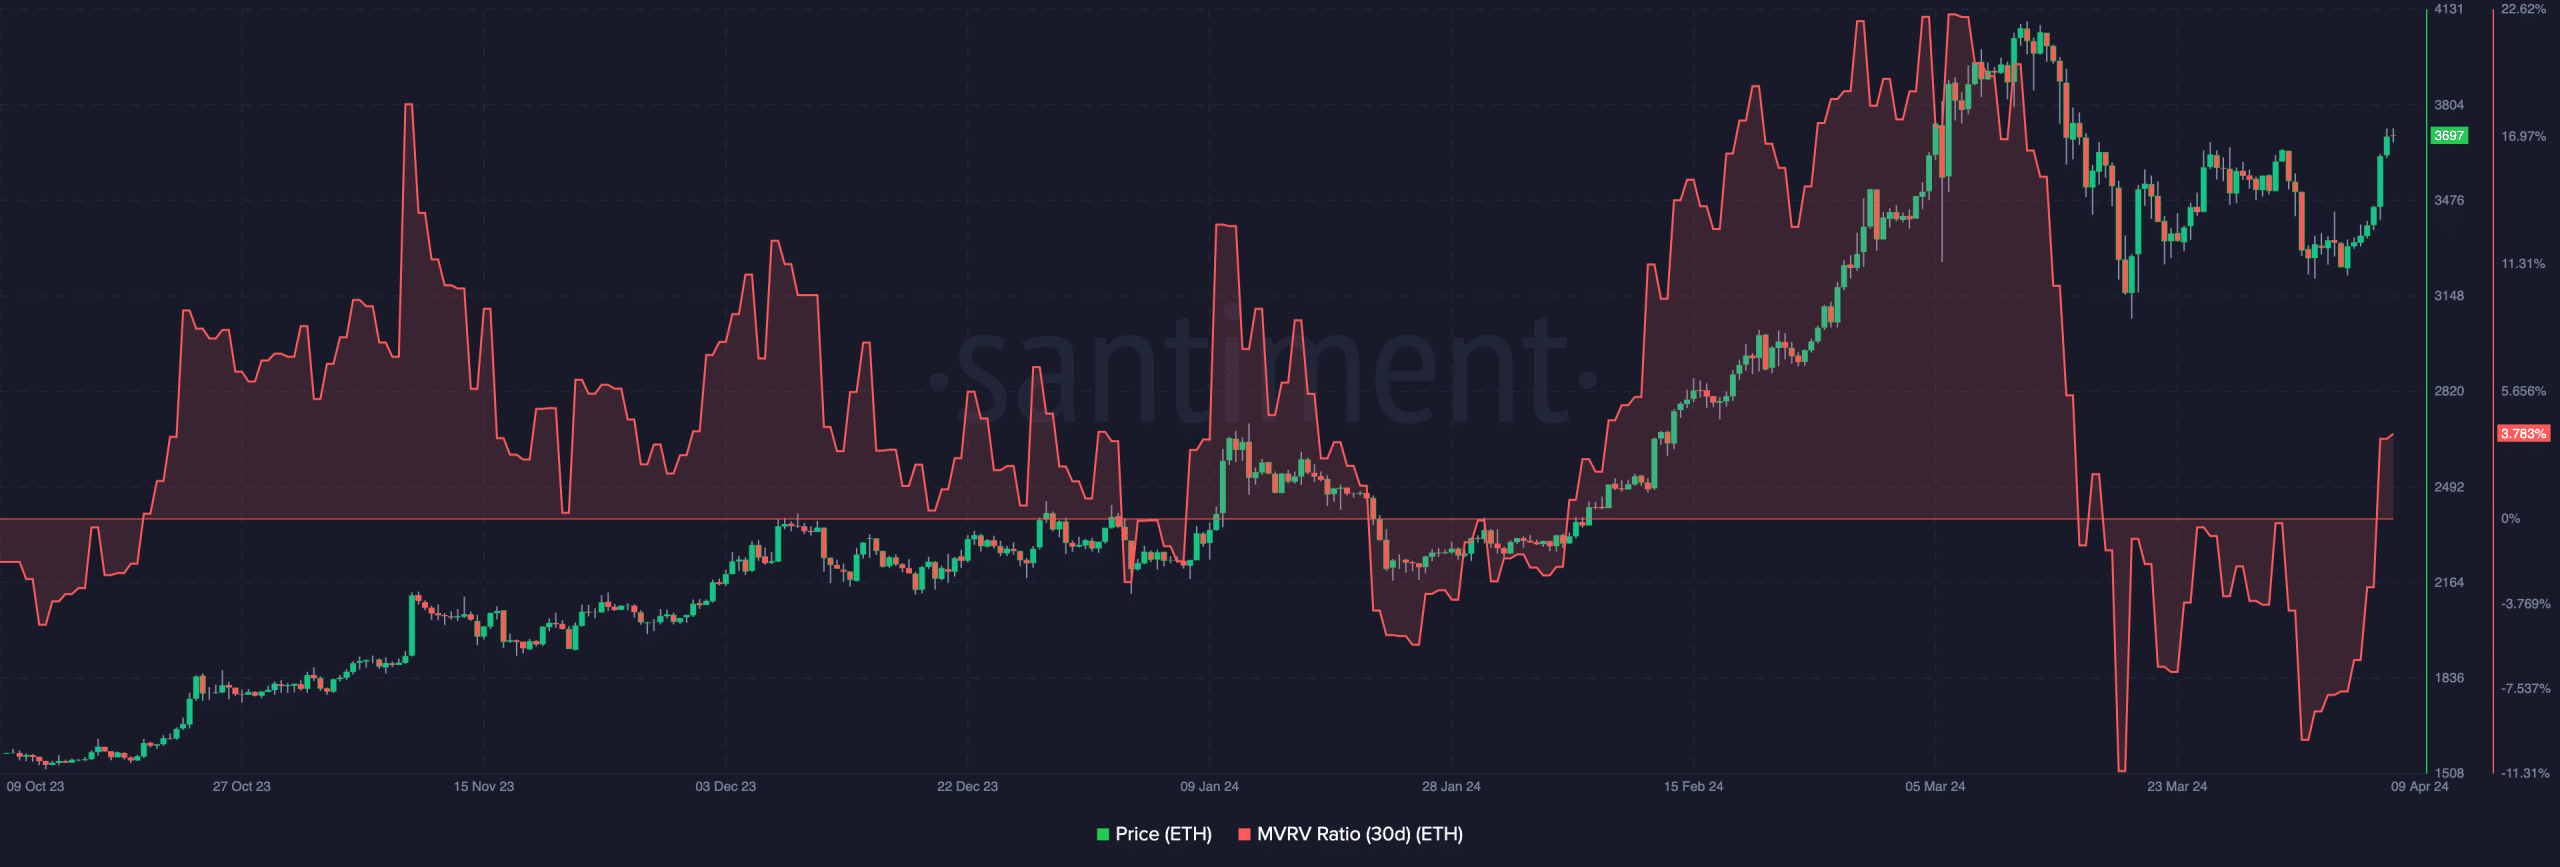
Between the 1st and 7th of April, ETH’s 30-day MVRV ratio was negative, suggesting an unusual buying opportunity in the region. This prediction was based on the cryptocurrency’s history.

Source: Santiment
For instance, the ratio was -4.90 in October 2023 while ETH changed hands at $1,566. Weeks later, the price crossed $2,000. A similar scenario also occurred in January as ETH moved from $2,237 to $4,088.
On both occasions, the price increased by 21.7% and 45.27% respectively. This time, Ethereum has only increased by 7.89%. Should the historical pattern repeat itself, the price could rally toward $4,648 over the next few weeks.
But that might only be the case if the market does not experience extreme volatility that could cause prices to nosedive. If this is the case, then the bullish prediction might be invalidated.
Is it time for surplus gains?
In the meantime, traders took advantage of the price increase to realize some profits. This was something that ETH holders could not boast of in recent weeks.
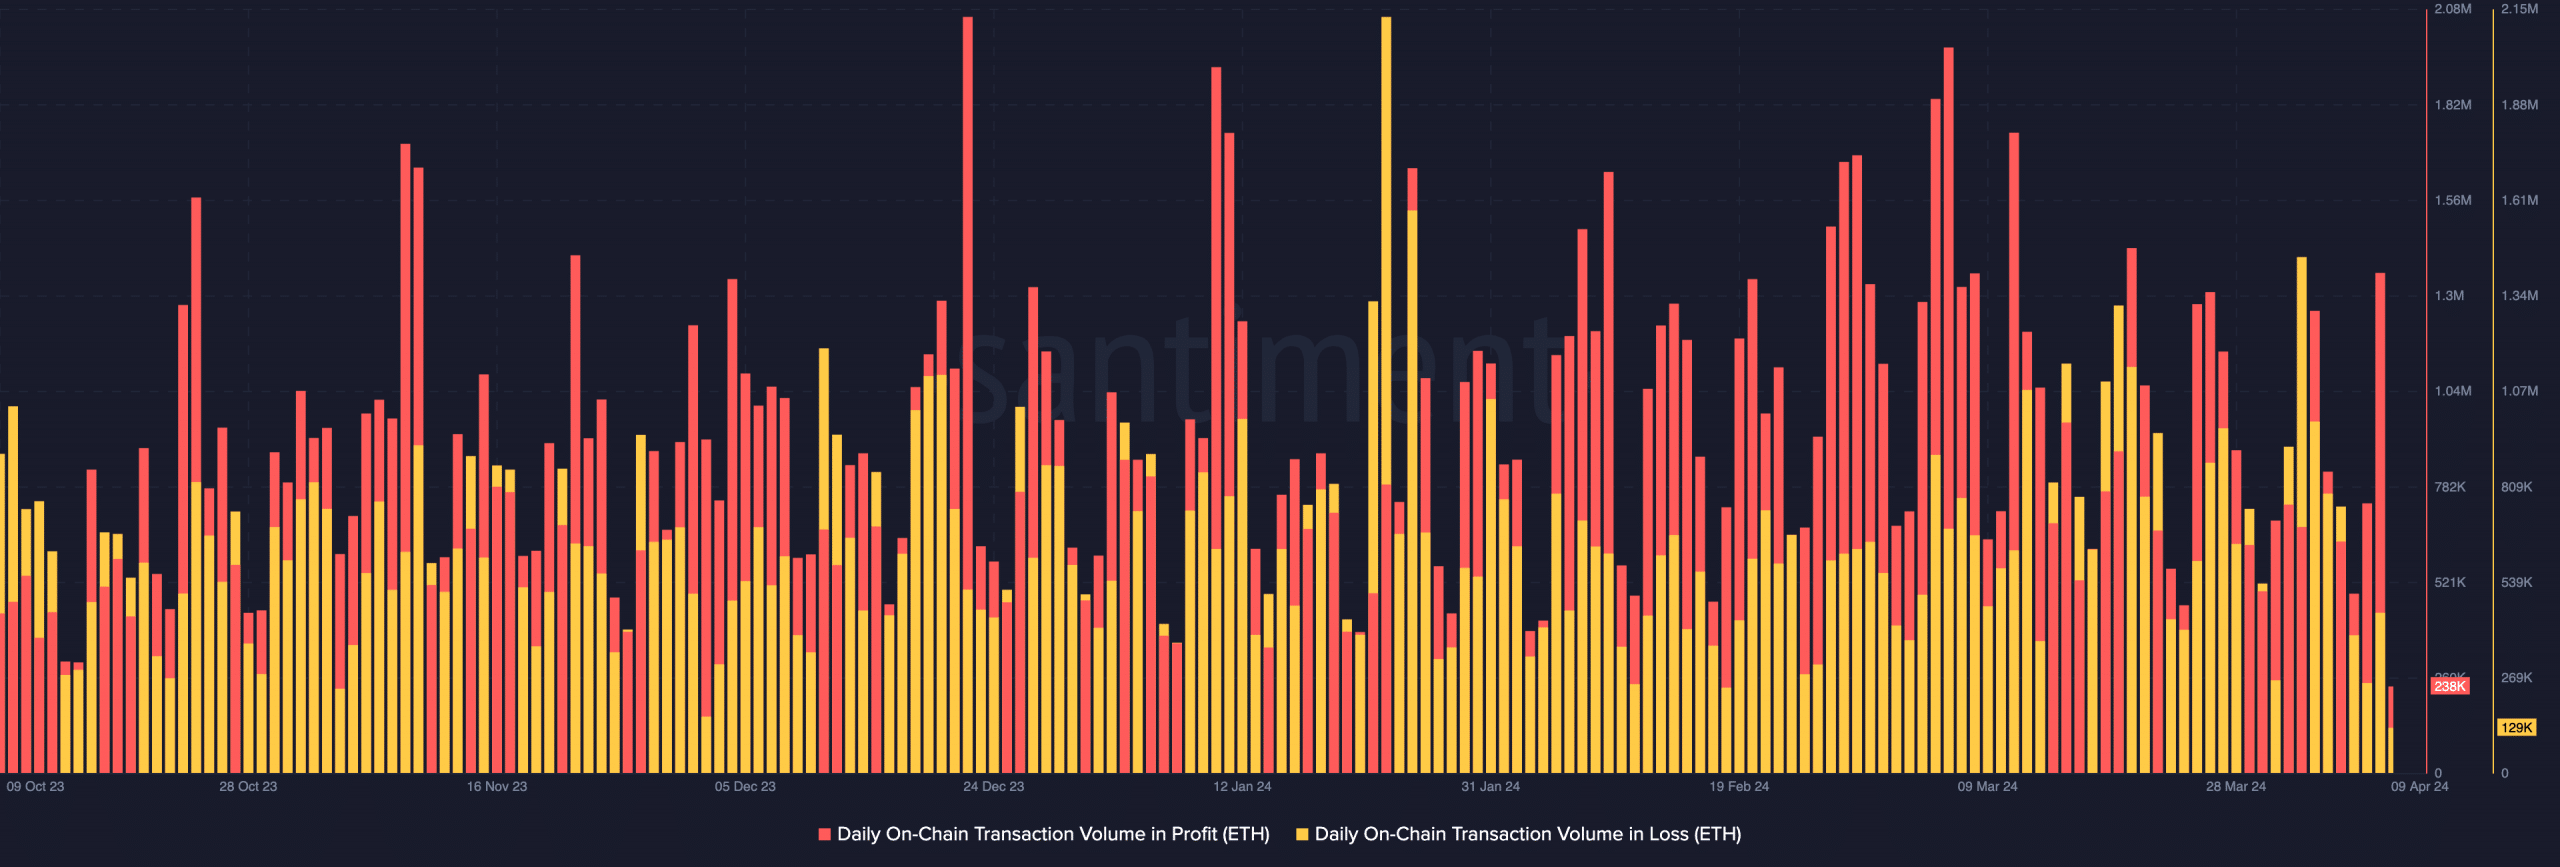
A look at the daily on-chain transaction volume in loss showed that it was $129,000. On the other hand, the on-chain transaction volume in profit was about 238,000.

Source: Santiment
If the price of the cryptocurrency continues to increase, then the volume in profit could be double those in the red. But will Ethereum give in to the rally?
To ascertain this possibility, AMBCrypto looked at the Open Interest (OI). According to data from Coinglass, ETH’s OI jumped to $14.41 billion.
OI measures traders’ activity based on net positioning. If the OI decreases, it implies an increase in positions closed. On the other hand, an increase in the metric suggests a surge in liquidity added to open positions.

Source: Coinglass
Therefore, the increase in the last 24 hours meant that more contracts had been opened, with buyers being the aggressive ones.
Read Ethereum’s [ETH] Price Prediction 2024-2025
Looking at ETH’s price and the OI, it seems that the convergence might trigger a significant price movement.
From a trading perspective, the large OI alongside the rising value might lead to a breakout. Should this be the case, ETH’s rise above $4,000 could be next.
- Historical design shown by the MVRV ratio, led ETH to bounce.
- While traders booked some profits, the OI indicated that more was close.
On the 8th of April, Ethereum [ETH] defied the school of thought that it was a slow move this cycle as its market cap jumped by over 9%. This increase placed its market cap at over $440 billion.
During this time, the altcoin’s price surpassed $3, 700 before its slight drop. But that was not the major highlight.
The past is sometimes the present
AMBCrypto analyzed Ethereum’s on-chain condition and observed the Market Value to Realized Value (MVRV) ratio. This ratio provides insights into traders’ buying and selling behavior. It can also help to spot the bottoms and tops of an asset.
Between the 1st and 7th of April, ETH’s 30-day MVRV ratio was negative, suggesting an unusual buying opportunity in the region. This prediction was based on the cryptocurrency’s history.

Source: Santiment
For instance, the ratio was -4.90 in October 2023 while ETH changed hands at $1,566. Weeks later, the price crossed $2,000. A similar scenario also occurred in January as ETH moved from $2,237 to $4,088.
On both occasions, the price increased by 21.7% and 45.27% respectively. This time, Ethereum has only increased by 7.89%. Should the historical pattern repeat itself, the price could rally toward $4,648 over the next few weeks.
But that might only be the case if the market does not experience extreme volatility that could cause prices to nosedive. If this is the case, then the bullish prediction might be invalidated.
Is it time for surplus gains?
In the meantime, traders took advantage of the price increase to realize some profits. This was something that ETH holders could not boast of in recent weeks.
A look at the daily on-chain transaction volume in loss showed that it was $129,000. On the other hand, the on-chain transaction volume in profit was about 238,000.

Source: Santiment
If the price of the cryptocurrency continues to increase, then the volume in profit could be double those in the red. But will Ethereum give in to the rally?
To ascertain this possibility, AMBCrypto looked at the Open Interest (OI). According to data from Coinglass, ETH’s OI jumped to $14.41 billion.
OI measures traders’ activity based on net positioning. If the OI decreases, it implies an increase in positions closed. On the other hand, an increase in the metric suggests a surge in liquidity added to open positions.

Source: Coinglass
Therefore, the increase in the last 24 hours meant that more contracts had been opened, with buyers being the aggressive ones.
Read Ethereum’s [ETH] Price Prediction 2024-2025
Looking at ETH’s price and the OI, it seems that the convergence might trigger a significant price movement.
From a trading perspective, the large OI alongside the rising value might lead to a breakout. Should this be the case, ETH’s rise above $4,000 could be next.


can you buy cheap clomid without a prescription buy clomid pill how to buy generic clomid tablets cost clomiphene online can i buy cheap clomiphene price how to buy generic clomid without prescription where can i buy generic clomiphene tablets
This is the gentle of literature I truly appreciate.
Thanks on putting this up. It’s evidently done.
order zithromax generic – purchase zithromax sale order metronidazole online
order semaglutide 14 mg generic – semaglutide over the counter buy cyproheptadine 4 mg online
order domperidone 10mg generic – cyclobenzaprine 15mg canada buy flexeril pill
inderal price – methotrexate 5mg sale order methotrexate generic
augmentin 1000mg usa – atbio info buy cheap ampicillin
cheap warfarin 5mg – coumamide order hyzaar online cheap
mobic 7.5mg without prescription – moboxsin.com order mobic sale
order prednisone 20mg generic – corticosteroid prednisone online order
top rated ed pills – fast ed to take site buy ed pills canada
buy amoxil generic – https://combamoxi.com/ cheap amoxicillin
buy diflucan no prescription – https://gpdifluca.com/ fluconazole 200mg for sale
cenforce 50mg brand – cenforce 50mg canada cheap cenforce
cialis manufacturer coupon 2018 – cheap cialis free shipping cialis tadalafil 20mg price
cialis after prostate surgery – click cialis tadalafil 20mg kaufen
generic ranitidine 300mg – https://aranitidine.com/ ranitidine for sale
cheap viagra with prescription – click 100mg viagra cost
I couldn’t resist commenting. Adequately written! efectos secundarios neurontin 300
I couldn’t weather commenting. Profoundly written! over the counter prednisone cream
This is the description of glad I enjoy reading. https://ursxdol.com/ventolin-albuterol/
Thanks for sharing. It’s outstrip quality. https://prohnrg.com/product/rosuvastatin-for-sale/
This is the compassionate of criticism I positively appreciate. https://ondactone.com/product/domperidone/
Thanks on putting this up. It’s well done.
order sumatriptan pill
Greetings! Jolly useful advice within this article! It’s the scarcely changes which will turn the largest changes. Thanks a portion quest of sharing! http://www.fujiapuerbbs.com/home.php?mod=space&uid=3616674
forxiga 10mg cost – https://janozin.com/# buy forxiga 10mg without prescription
where to buy xenical without a prescription – https://asacostat.com/ buy orlistat 60mg generic
The thoroughness in this draft is noteworthy. https://lzdsxxb.com/home.php?mod=space&uid=5112208