


![What Is Asset Tokenization? Types, Why It Matters Now [2025]](https://coininsights.com/wp-content/uploads/2025/05/asset_tokenization-360x180.png)


- Ethereum has a bearish market structure.
- The magnetic zone below $2.9k signaled further losses were likely.
Ethereum [ETH] was again trading at the $2.9k support level. It had previously visited this level on the 5th of July. In the following weeks, the bulls drove prices as high as $3.5k before faltering.
Should we expect a bounce to $3.5k this time? The network activity has dropped in recent months, but smart money activity gave a bullish signal. The technical indicators continued to forecast bearishness.
Potential for short-term volatility and an ETH dip below $2.9k
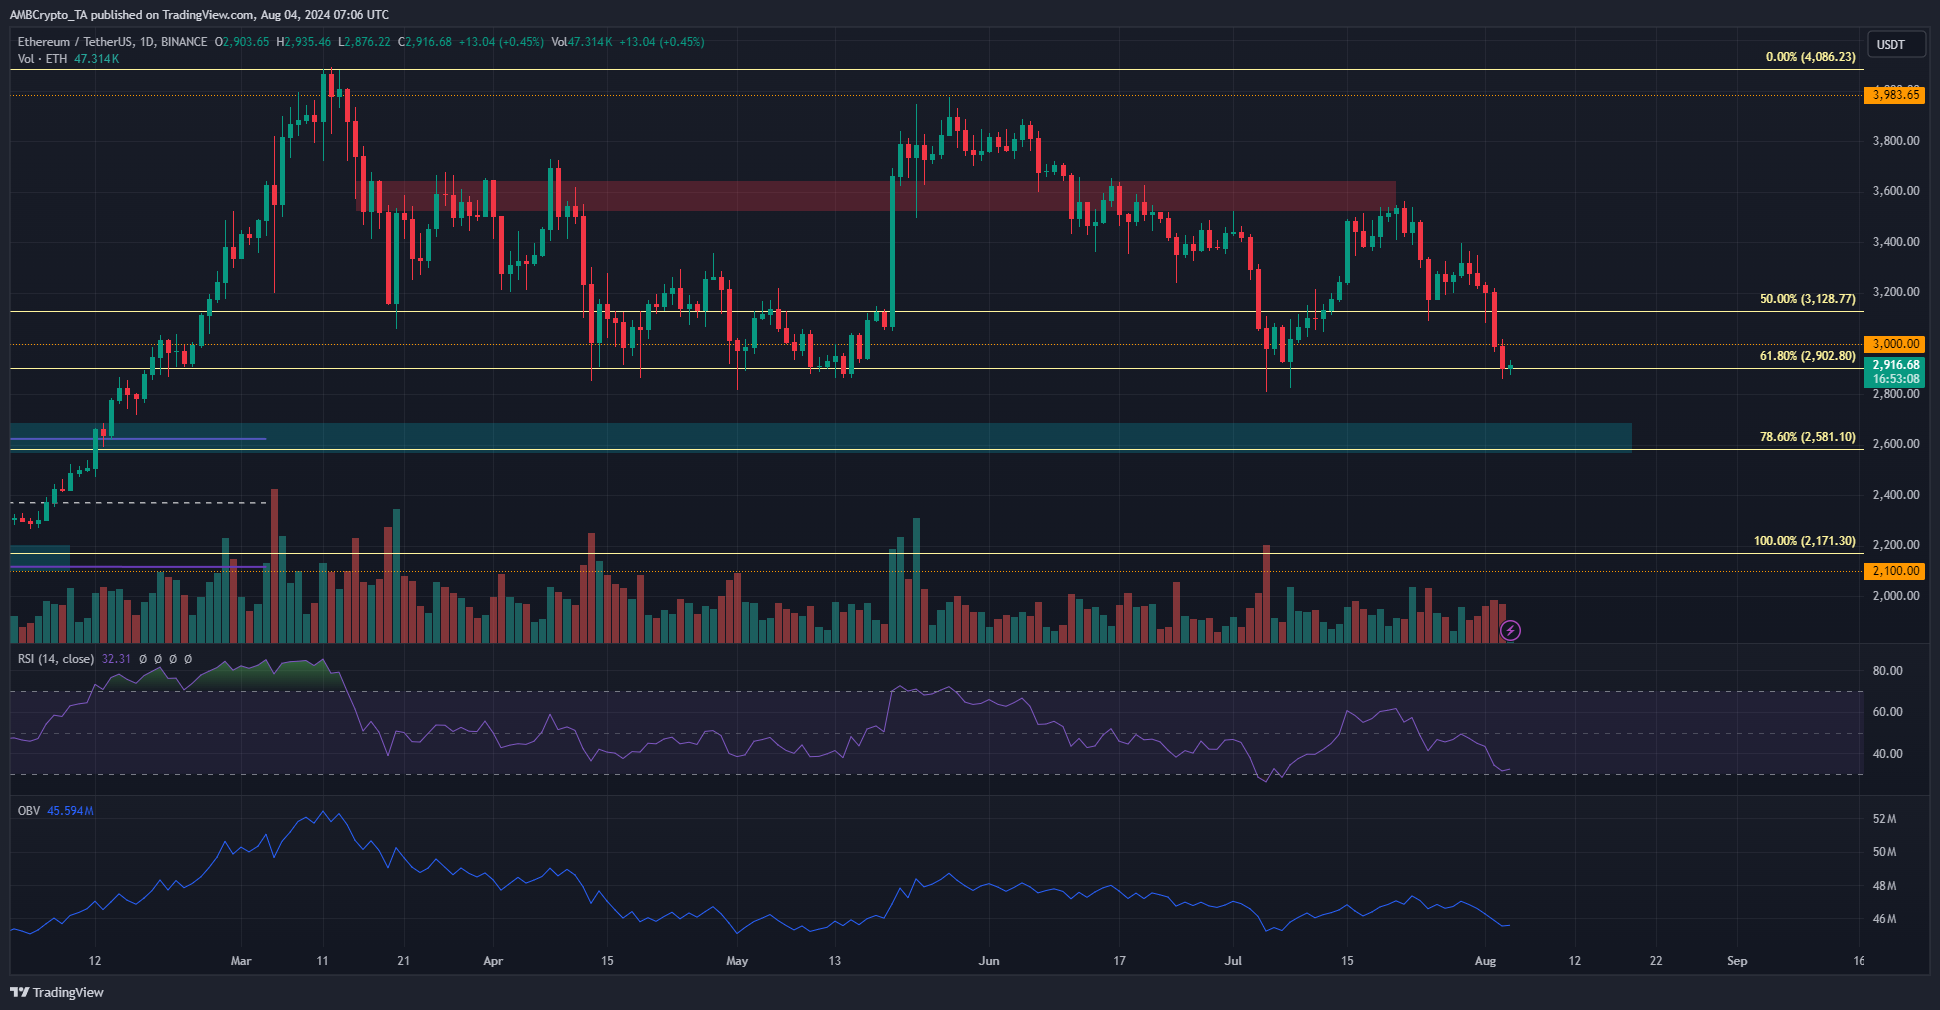
Source: ETH/USDT on TradingView
At press time, Ethereum was trading at $2916. It had a bearish market structure on the daily timeframe. Below the $2.9k level, the next significant support zone is at $2.6k. The price action showed that such a dip is possible.
The daily RSI was just above oversold conditions and the OBV has steadily slid downward since June. Together they indicated further losses were coming.
The $2.9k support is also the 61.8% Fibonacci retracement level and has been defended since April. Hence, there is a good chance that the bulls manage to defend it again.
Potential for volatility due to a liquidation cascade
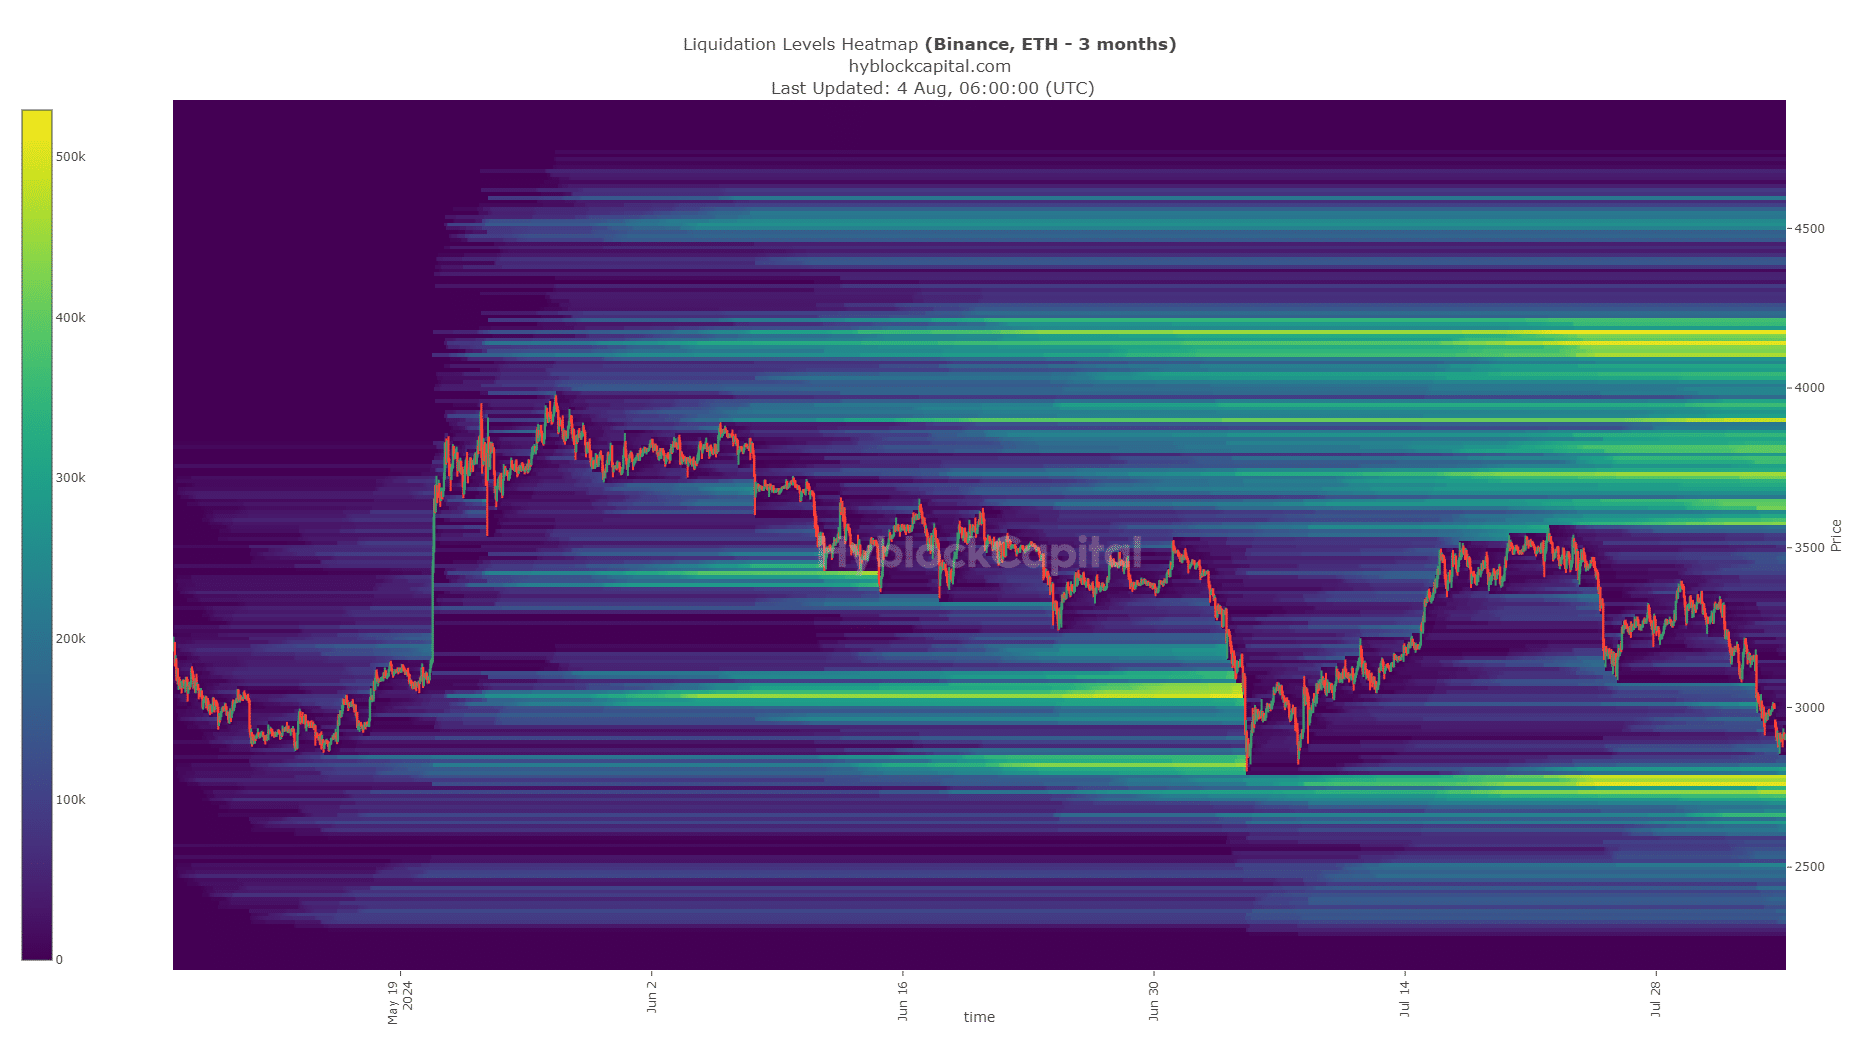
Source: Hyblock
Over the past six weeks, the cluster of liquidation levels at the $2.8k zone has increased. Prices are inevitably attracted to these liquidity pools, making them magnetic zones. Even though $2.9k is a strong support, it is highly likely that the $2740-$2800 region is visited.
Read Ethereum [ETH] Price Prediction 2024-25
A bullish reversal from there is expected, but traders should be wary of lower timeframe volatility.
A day or two of trading to establish $2.7k-$2.8k as support alongside an influx of demand could encourage swing traders to go long.
Disclaimer: The information presented does not constitute financial, investment, trading, or other types of advice and is solely the writer’s opinion.
- Ethereum has a bearish market structure.
- The magnetic zone below $2.9k signaled further losses were likely.
Ethereum [ETH] was again trading at the $2.9k support level. It had previously visited this level on the 5th of July. In the following weeks, the bulls drove prices as high as $3.5k before faltering.
Should we expect a bounce to $3.5k this time? The network activity has dropped in recent months, but smart money activity gave a bullish signal. The technical indicators continued to forecast bearishness.
Potential for short-term volatility and an ETH dip below $2.9k
Source: ETH/USDT on TradingView
At press time, Ethereum was trading at $2916. It had a bearish market structure on the daily timeframe. Below the $2.9k level, the next significant support zone is at $2.6k. The price action showed that such a dip is possible.
The daily RSI was just above oversold conditions and the OBV has steadily slid downward since June. Together they indicated further losses were coming.
The $2.9k support is also the 61.8% Fibonacci retracement level and has been defended since April. Hence, there is a good chance that the bulls manage to defend it again.
Potential for volatility due to a liquidation cascade
Source: Hyblock
Over the past six weeks, the cluster of liquidation levels at the $2.8k zone has increased. Prices are inevitably attracted to these liquidity pools, making them magnetic zones. Even though $2.9k is a strong support, it is highly likely that the $2740-$2800 region is visited.
Read Ethereum [ETH] Price Prediction 2024-25
A bullish reversal from there is expected, but traders should be wary of lower timeframe volatility.
A day or two of trading to establish $2.7k-$2.8k as support alongside an influx of demand could encourage swing traders to go long.
Disclaimer: The information presented does not constitute financial, investment, trading, or other types of advice and is solely the writer’s opinion.


obviously like your website but you need to test the spelling on quite a few of your posts Several of them are rife with spelling problems and I to find it very troublesome to inform the reality on the other hand Ill certainly come back again
order clomiphene online generic clomiphene pill can you buy cheap clomiphene prices clomid pills buying cheap clomiphene how can i get cheap clomid tablets can i order clomiphene without insurance
This is a topic which is in to my heart… Diverse thanks! Faithfully where can I find the contact details an eye to questions?
More articles like this would pretence of the blogosphere richer.
purchase azithromycin for sale – buy tindamax medication flagyl over the counter
semaglutide 14mg for sale – order cyproheptadine cyproheptadine 4mg price
domperidone price – domperidone 10mg uk generic cyclobenzaprine 15mg
buy inderal generic – plavix 150mg usa methotrexate 2.5mg us
amoxicillin tablet – purchase diovan pill combivent 100 mcg cheap