- Whales bought 340,000 ETH in the last 3 days worth more than $1 billion.
- ETH might have completed its correction as the Long Term Trend Directions is strongly bullish.
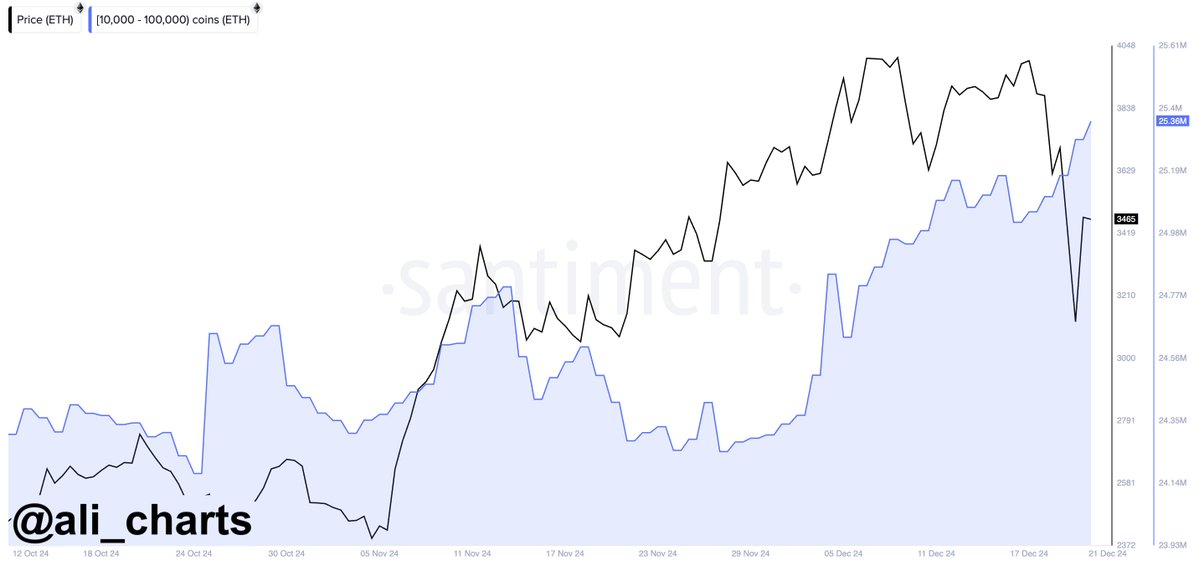
Ethereum’s ([ETH] whale activity contrasted with its price, showing significant buying during the downturn.
Over three days, whales acquired 340,000 ETH, valued over $1 billion, suggesting strategic bulk purchases during price dips.
This pattern against a backdrop of general crypto declines, sparked speculation about potential market rebound.

Source: Ali/X
The activity aligned with historical patterns where substantial buys often precede market recoveries. This hinted that ETH might soon experience a price increase if this trend holds true.
Is correction over amid long term trend directions?
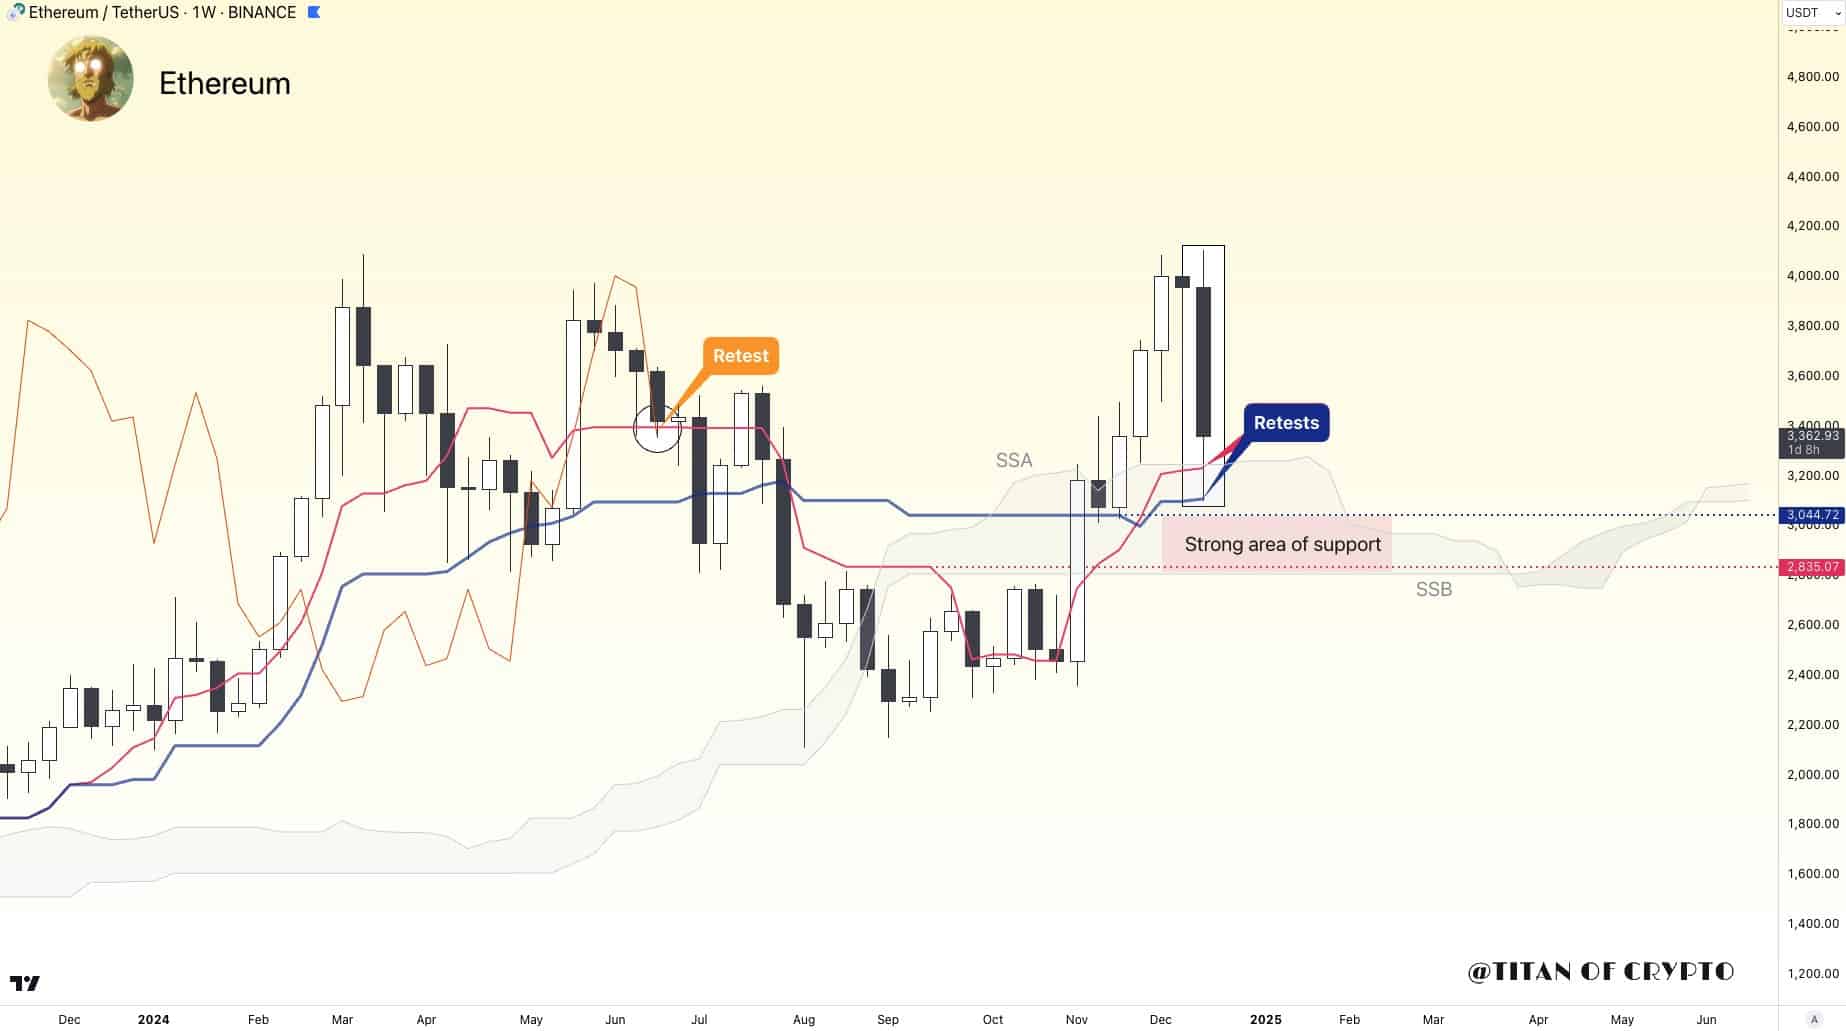
Ethereum weekly chart indicated a potential completion of its correction.
The price successively retested the Tenkan and Kijun lines of the Ichimoku Kinko Hyo indicator, suggesting a stabilization.
Further signs of support were evident as ETH interacted with the Kumo Cloud’s Senkou Span A, seen as a preliminary resistance turned support.

Source: Titan of Crypto/X
Additionally, the lagging span retraced to its Tenkan line, reinforcing the resilience of current price levels. Despite these bullish signals, there remained caution with a possible retest of the Kumo Cloud’s Senkou Span B.
If Ethereum’s price approaches this line, it would likely signify a critical test of market sentiment and strength.
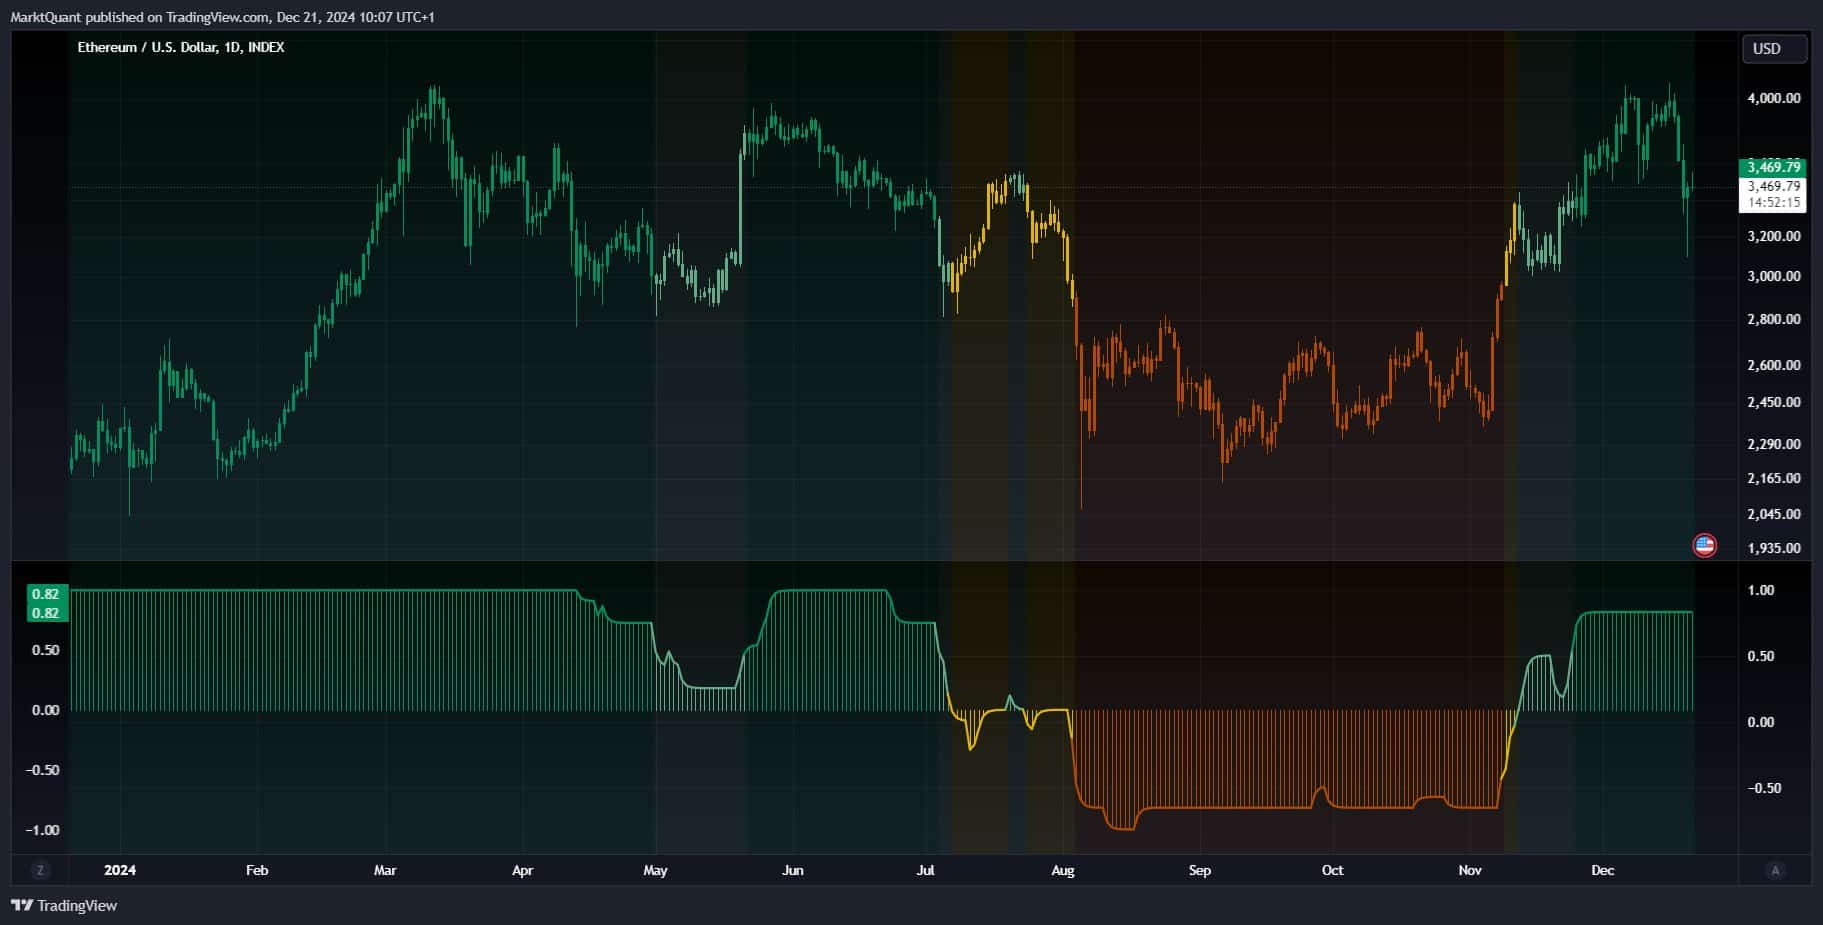
Again, the Long Term Trend Directions (LTTD) score the year could end at a strong bullish level of 0.82, suggesting a positive long-term outlook.
Despite a brief dip in mid-year, the LTTD returned to bullish territory.
Ethereum started a consistent climb, coinciding with the LTTD score maintaining above 0.5, indicating sustained buyer interest.

Source: X
The sharp decline in the LTTD score in July corresponded with a price drop, showing a short-term bearish phase.
However, the quick recovery in LTTD by October and a corresponding price rise suggested the correction phase ended, and ETH was resuming its long-term upward trend.
Spot ETH ETFs flow
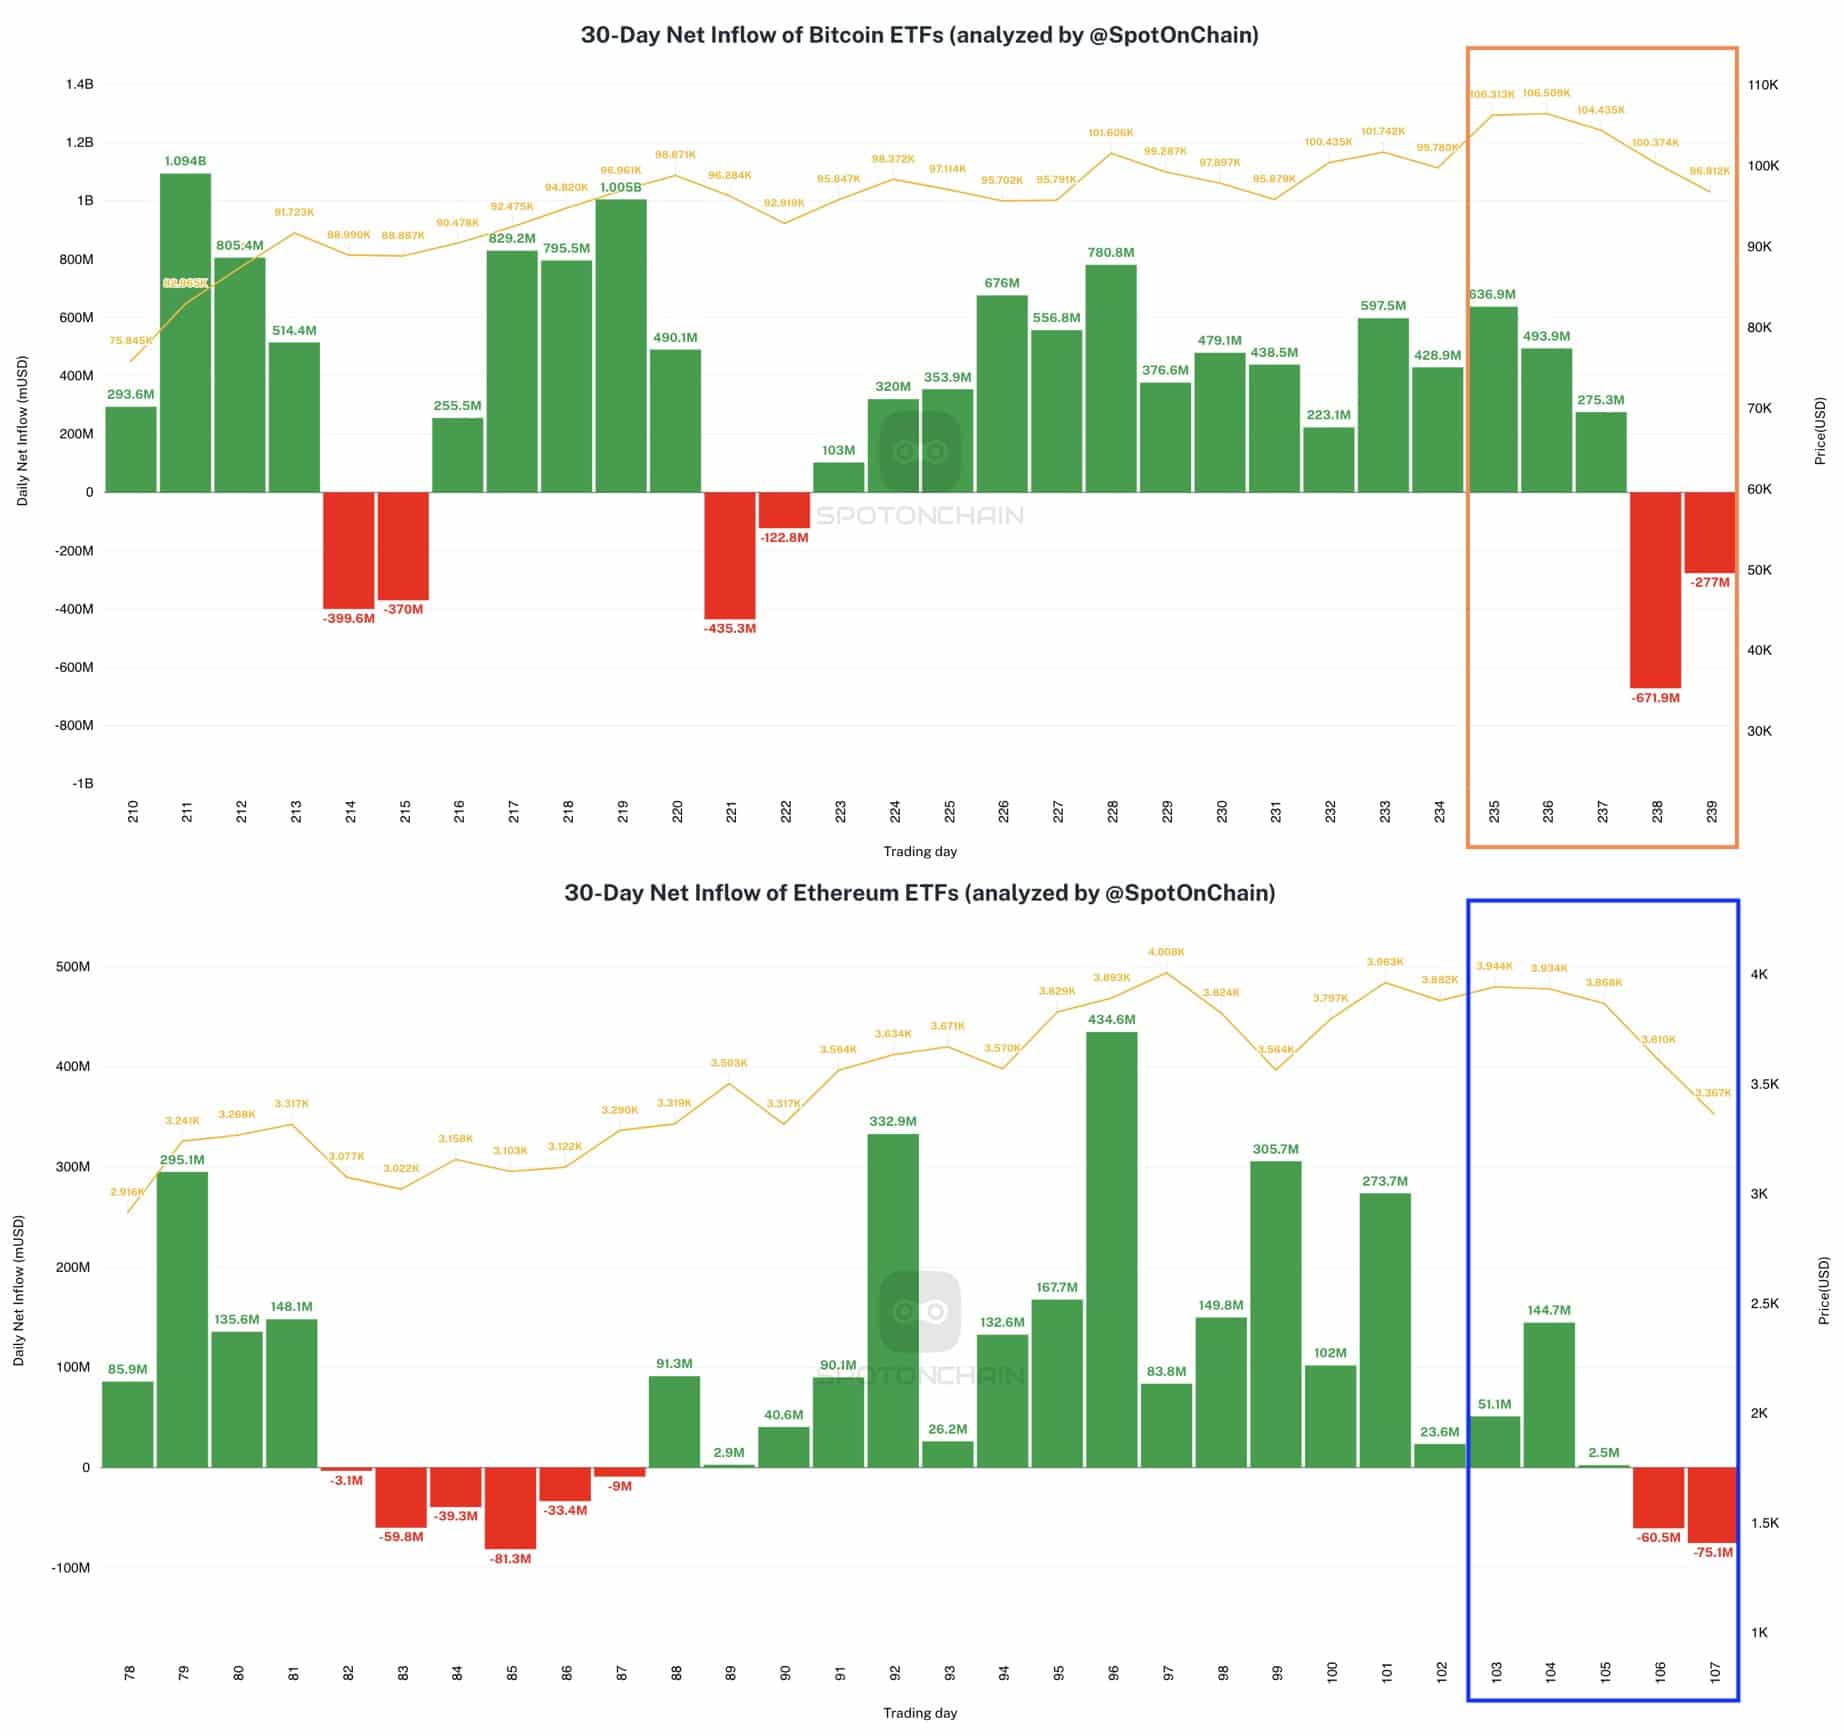
However, Ethereum ETFs experienced notable outflows, with BlackRock’s ETHA seeing the largest ever, around $103.7 million, during a week marked by market declines.
In contrast, Bitcoin ETFs also witnessed their most significant outflow since inception, totaling around $671.9 million.
This reversal ended two consecutive weeks of inflows for both Bitcoin and Ethereum ETFs.

Source: SpotOnChain
Notably, despite the outflows, BlackRock accumulated substantial positions, adding 13.7K BTC valued at $1.45 billion and 33.9K ETH worth $143.7 million.
These movements indicated significant shifts in ETF dynamics, reflecting broader market sentiments and potentially setting the stage for future trends in cryptocurrency investments.
- Whales bought 340,000 ETH in the last 3 days worth more than $1 billion.
- ETH might have completed its correction as the Long Term Trend Directions is strongly bullish.
Ethereum’s ([ETH] whale activity contrasted with its price, showing significant buying during the downturn.
Over three days, whales acquired 340,000 ETH, valued over $1 billion, suggesting strategic bulk purchases during price dips.
This pattern against a backdrop of general crypto declines, sparked speculation about potential market rebound.

Source: Ali/X
The activity aligned with historical patterns where substantial buys often precede market recoveries. This hinted that ETH might soon experience a price increase if this trend holds true.
Is correction over amid long term trend directions?
Ethereum weekly chart indicated a potential completion of its correction.
The price successively retested the Tenkan and Kijun lines of the Ichimoku Kinko Hyo indicator, suggesting a stabilization.
Further signs of support were evident as ETH interacted with the Kumo Cloud’s Senkou Span A, seen as a preliminary resistance turned support.

Source: Titan of Crypto/X
Additionally, the lagging span retraced to its Tenkan line, reinforcing the resilience of current price levels. Despite these bullish signals, there remained caution with a possible retest of the Kumo Cloud’s Senkou Span B.
If Ethereum’s price approaches this line, it would likely signify a critical test of market sentiment and strength.
Again, the Long Term Trend Directions (LTTD) score the year could end at a strong bullish level of 0.82, suggesting a positive long-term outlook.
Despite a brief dip in mid-year, the LTTD returned to bullish territory.
Ethereum started a consistent climb, coinciding with the LTTD score maintaining above 0.5, indicating sustained buyer interest.

Source: X
The sharp decline in the LTTD score in July corresponded with a price drop, showing a short-term bearish phase.
However, the quick recovery in LTTD by October and a corresponding price rise suggested the correction phase ended, and ETH was resuming its long-term upward trend.
Spot ETH ETFs flow
However, Ethereum ETFs experienced notable outflows, with BlackRock’s ETHA seeing the largest ever, around $103.7 million, during a week marked by market declines.
In contrast, Bitcoin ETFs also witnessed their most significant outflow since inception, totaling around $671.9 million.
This reversal ended two consecutive weeks of inflows for both Bitcoin and Ethereum ETFs.

Source: SpotOnChain
Notably, despite the outflows, BlackRock accumulated substantial positions, adding 13.7K BTC valued at $1.45 billion and 33.9K ETH worth $143.7 million.
These movements indicated significant shifts in ETF dynamics, reflecting broader market sentiments and potentially setting the stage for future trends in cryptocurrency investments.


can you buy cheap clomid without insurance can i get cheap clomiphene pill can i buy cheap clomiphene without dr prescription get generic clomid without rx where buy generic clomid tablets can you buy cheap clomiphene without a prescription where to buy clomiphene no prescription
The depth in this piece is exceptional.
Greetings! Very useful suggestion within this article! It’s the little changes which liking espy the largest changes. Thanks a a quantity towards sharing!
order azithromycin pill – floxin oral flagyl price
buy domperidone cheap – cyclobenzaprine 15mg without prescription buy flexeril paypal
inderal for sale – clopidogrel 75mg generic methotrexate 5mg pill
buy generic amoxil – cheap amoxicillin without prescription ipratropium 100 mcg brand
buy zithromax 500mg online – buy tindamax 300mg for sale nebivolol canada
buy augmentin 375mg pills – at bio info buy ampicillin tablets
nexium pills – nexiumtous order nexium 40mg
order warfarin 5mg – https://coumamide.com/ order generic cozaar 50mg
mobic generic – mobo sin mobic online
deltasone 20mg brand – https://apreplson.com/ buy deltasone generic
generic ed drugs – https://fastedtotake.com/ best over the counter ed pills
order amoxicillin online cheap – order amoxicillin pills cheap amoxicillin generic
fluconazole drug – https://gpdifluca.com/ buy forcan medication
cheap cenforce 100mg – cenforce 50mg cheap cenforce us
cialis side effect – cialis for sale brand cialis erection
ranitidine oral – zantac 300mg cost buy ranitidine 150mg pill
cialis black 800 to buy in the uk one pill – https://strongtadafl.com/# cialis price canada
More articles like this would pretence of the blogosphere richer. click
cheap genuine viagra uk – https://strongvpls.com/# viagra cialis levitra buy online
This is the compassionate of writing I truly appreciate. https://buyfastonl.com/gabapentin.html
I am actually thrilled to glitter at this blog posts which consists of tons of of use facts, thanks towards providing such data. Levitra or sildenafil
The thoroughness in this break down is noteworthy. https://prohnrg.com/product/acyclovir-pills/
More content pieces like this would insinuate the web better. https://aranitidine.com/fr/sibelium/
This is the make of enter I find helpful. https://ondactone.com/product/domperidone/
More articles like this would remedy the blogosphere richer.
order levofloxacin 500mg without prescription
I couldn’t hold back commenting. Warmly written! http://bbs.51pinzhi.cn/home.php?mod=space&uid=7053893
buy dapagliflozin 10 mg – https://janozin.com/ forxiga cheap
xenical usa – https://asacostat.com/# order xenical 60mg pill
More delight pieces like this would create the web better. http://zgyhsj.com/space-uid-979364.html