


- The on-chain metrics showed bulls were eager to go long.
- The age consumed metric signaled caution while other metrics showed.
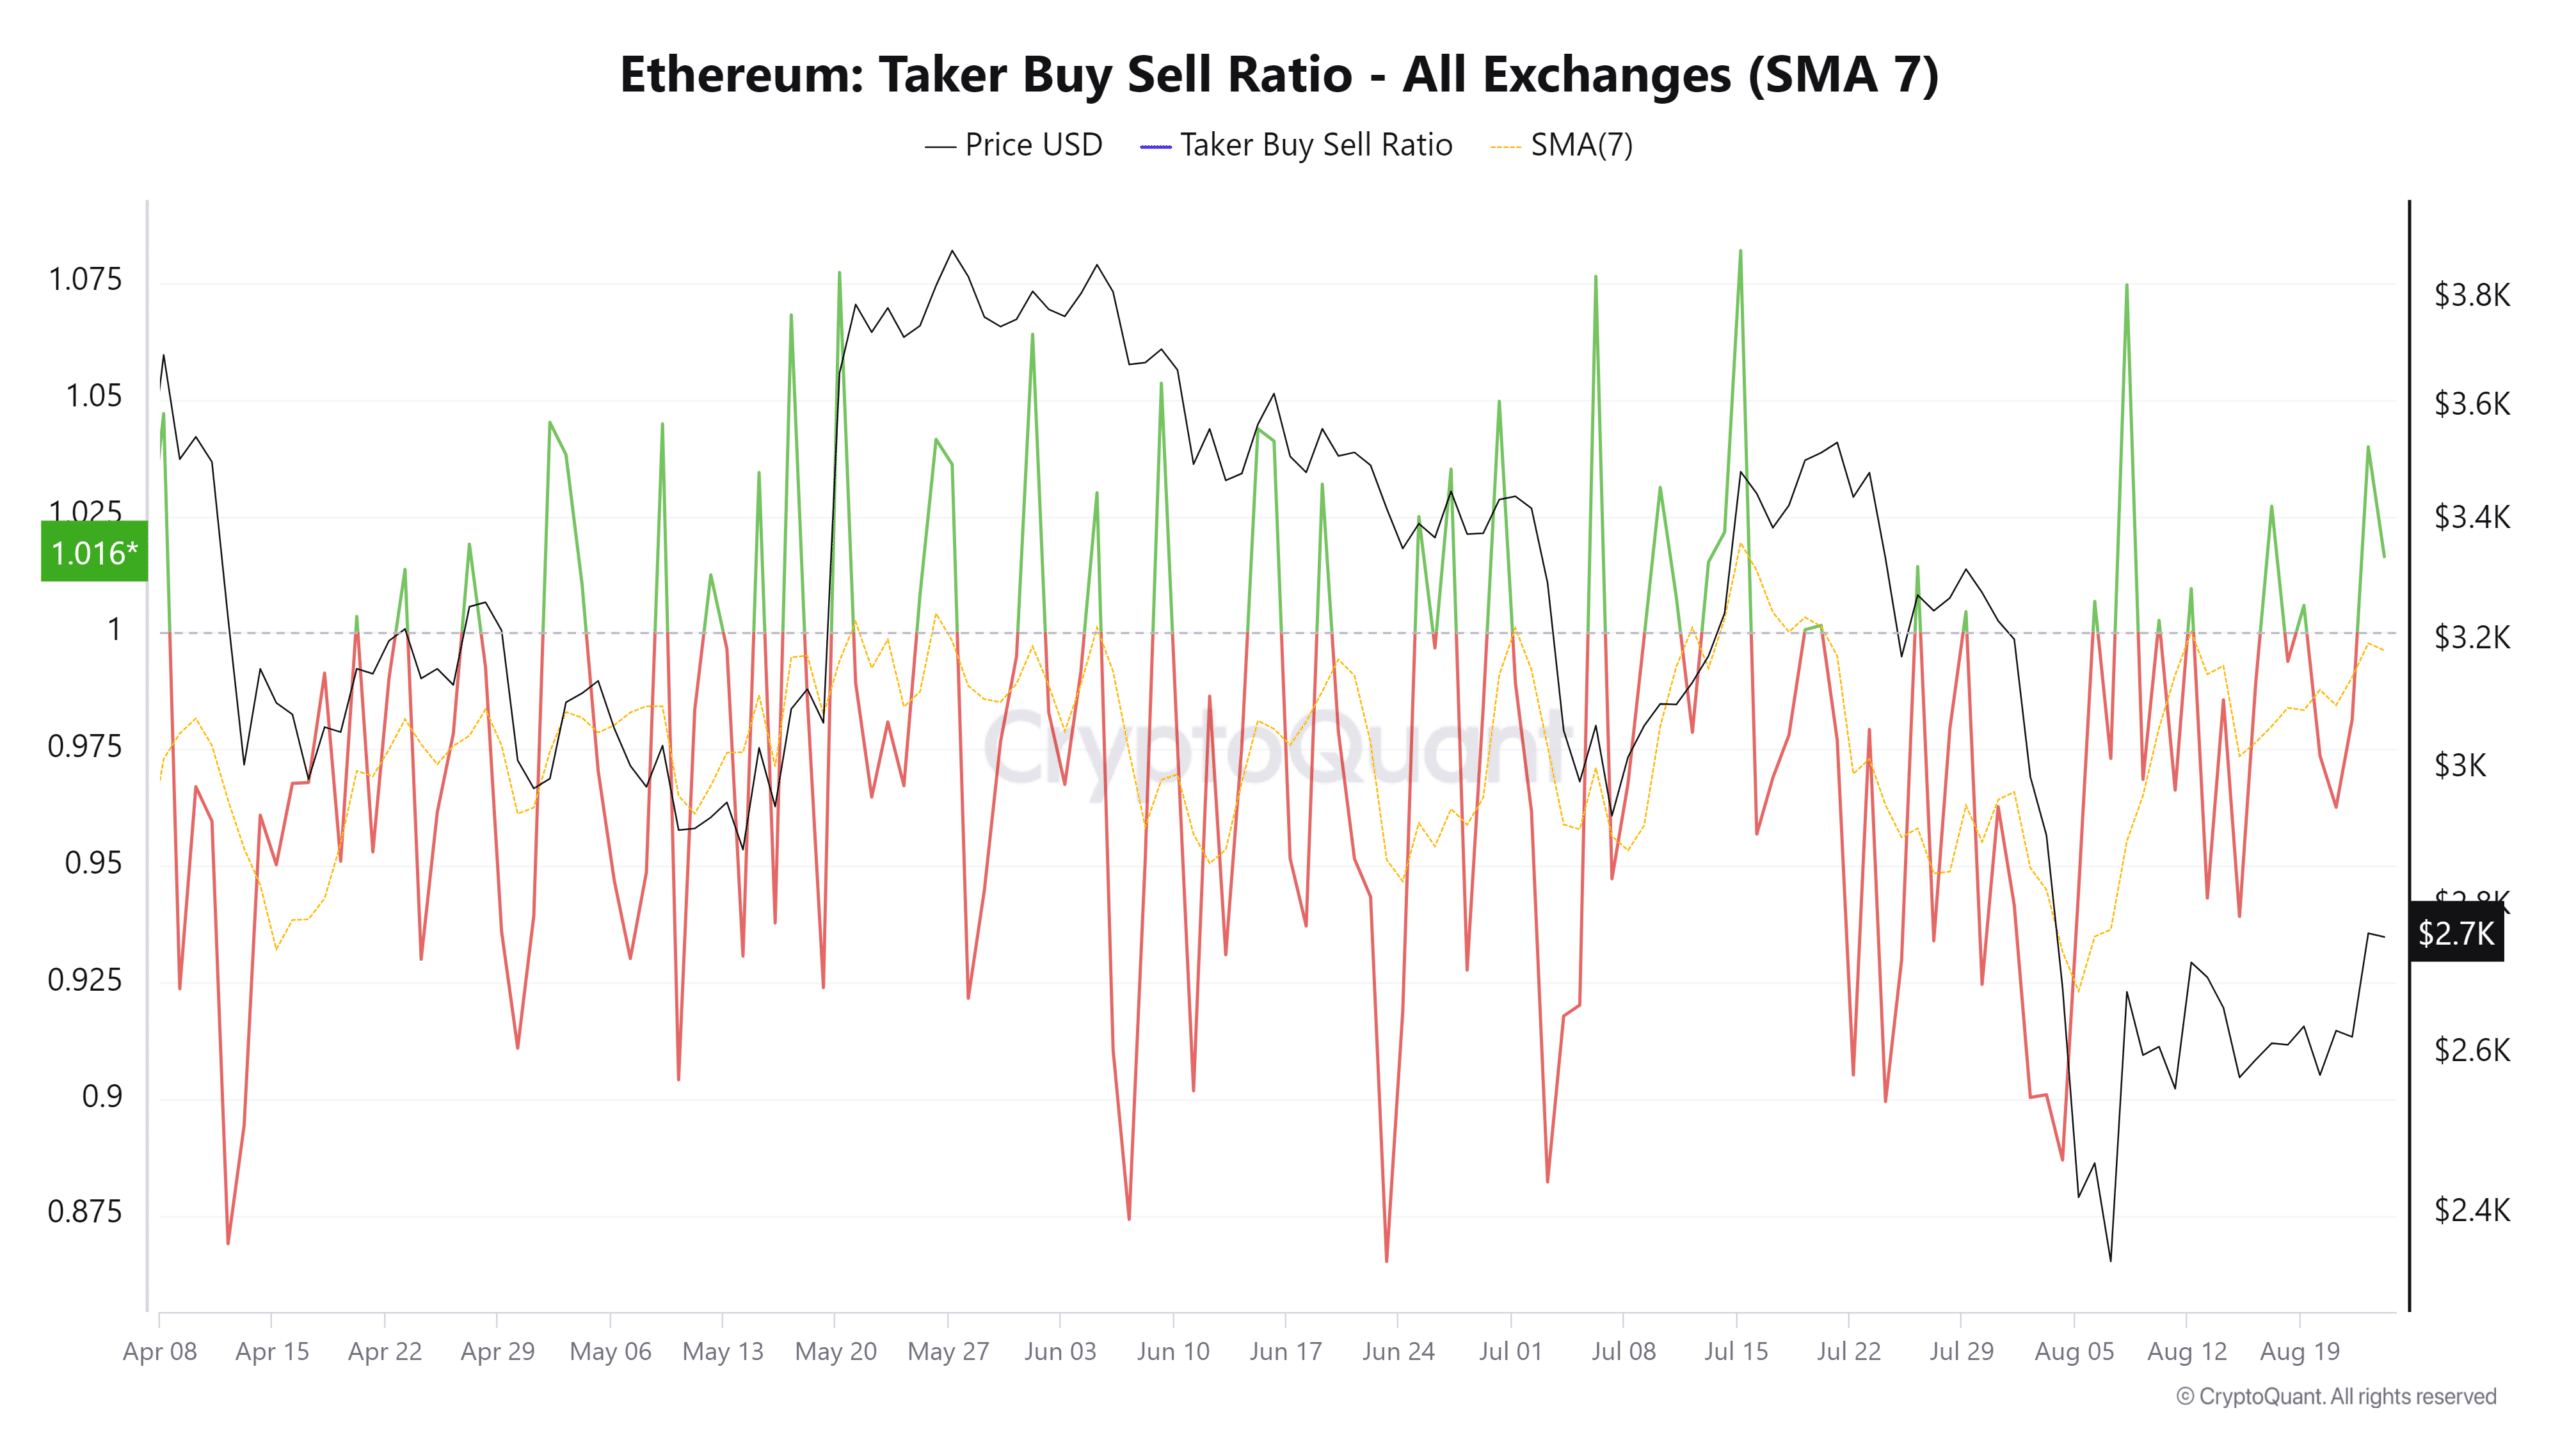
The taker buy/sell ratio shot skyward for Ethereum [ETH] over the past couple of days. This metric tracks the taker buy volume to sell volume ratio. Values below 1 indicate bearish sentiment.
Source: CryptoQuant
Taker refers to the nature of the order placed, being a market order rather than a limit order. This means these traders are willing to pay a slight premium to execute the trade at market prices. Hence, this ratio helps gauge sentiment.
Ethereum on the way to recovery
On the 31st of July, Ethereum was trading at $3.2k. Since the 20th of July, the taker buy/sell ratio has been negative, showing bearish sentiment was dominant. After the dump on the 5th of August, the market bounce encouraged long positions.
The metric’s spikes on the 8th of August and on the 23rd of August, while bullish, might not be indicative of a sustained recovery.
Source: CryptoQuant
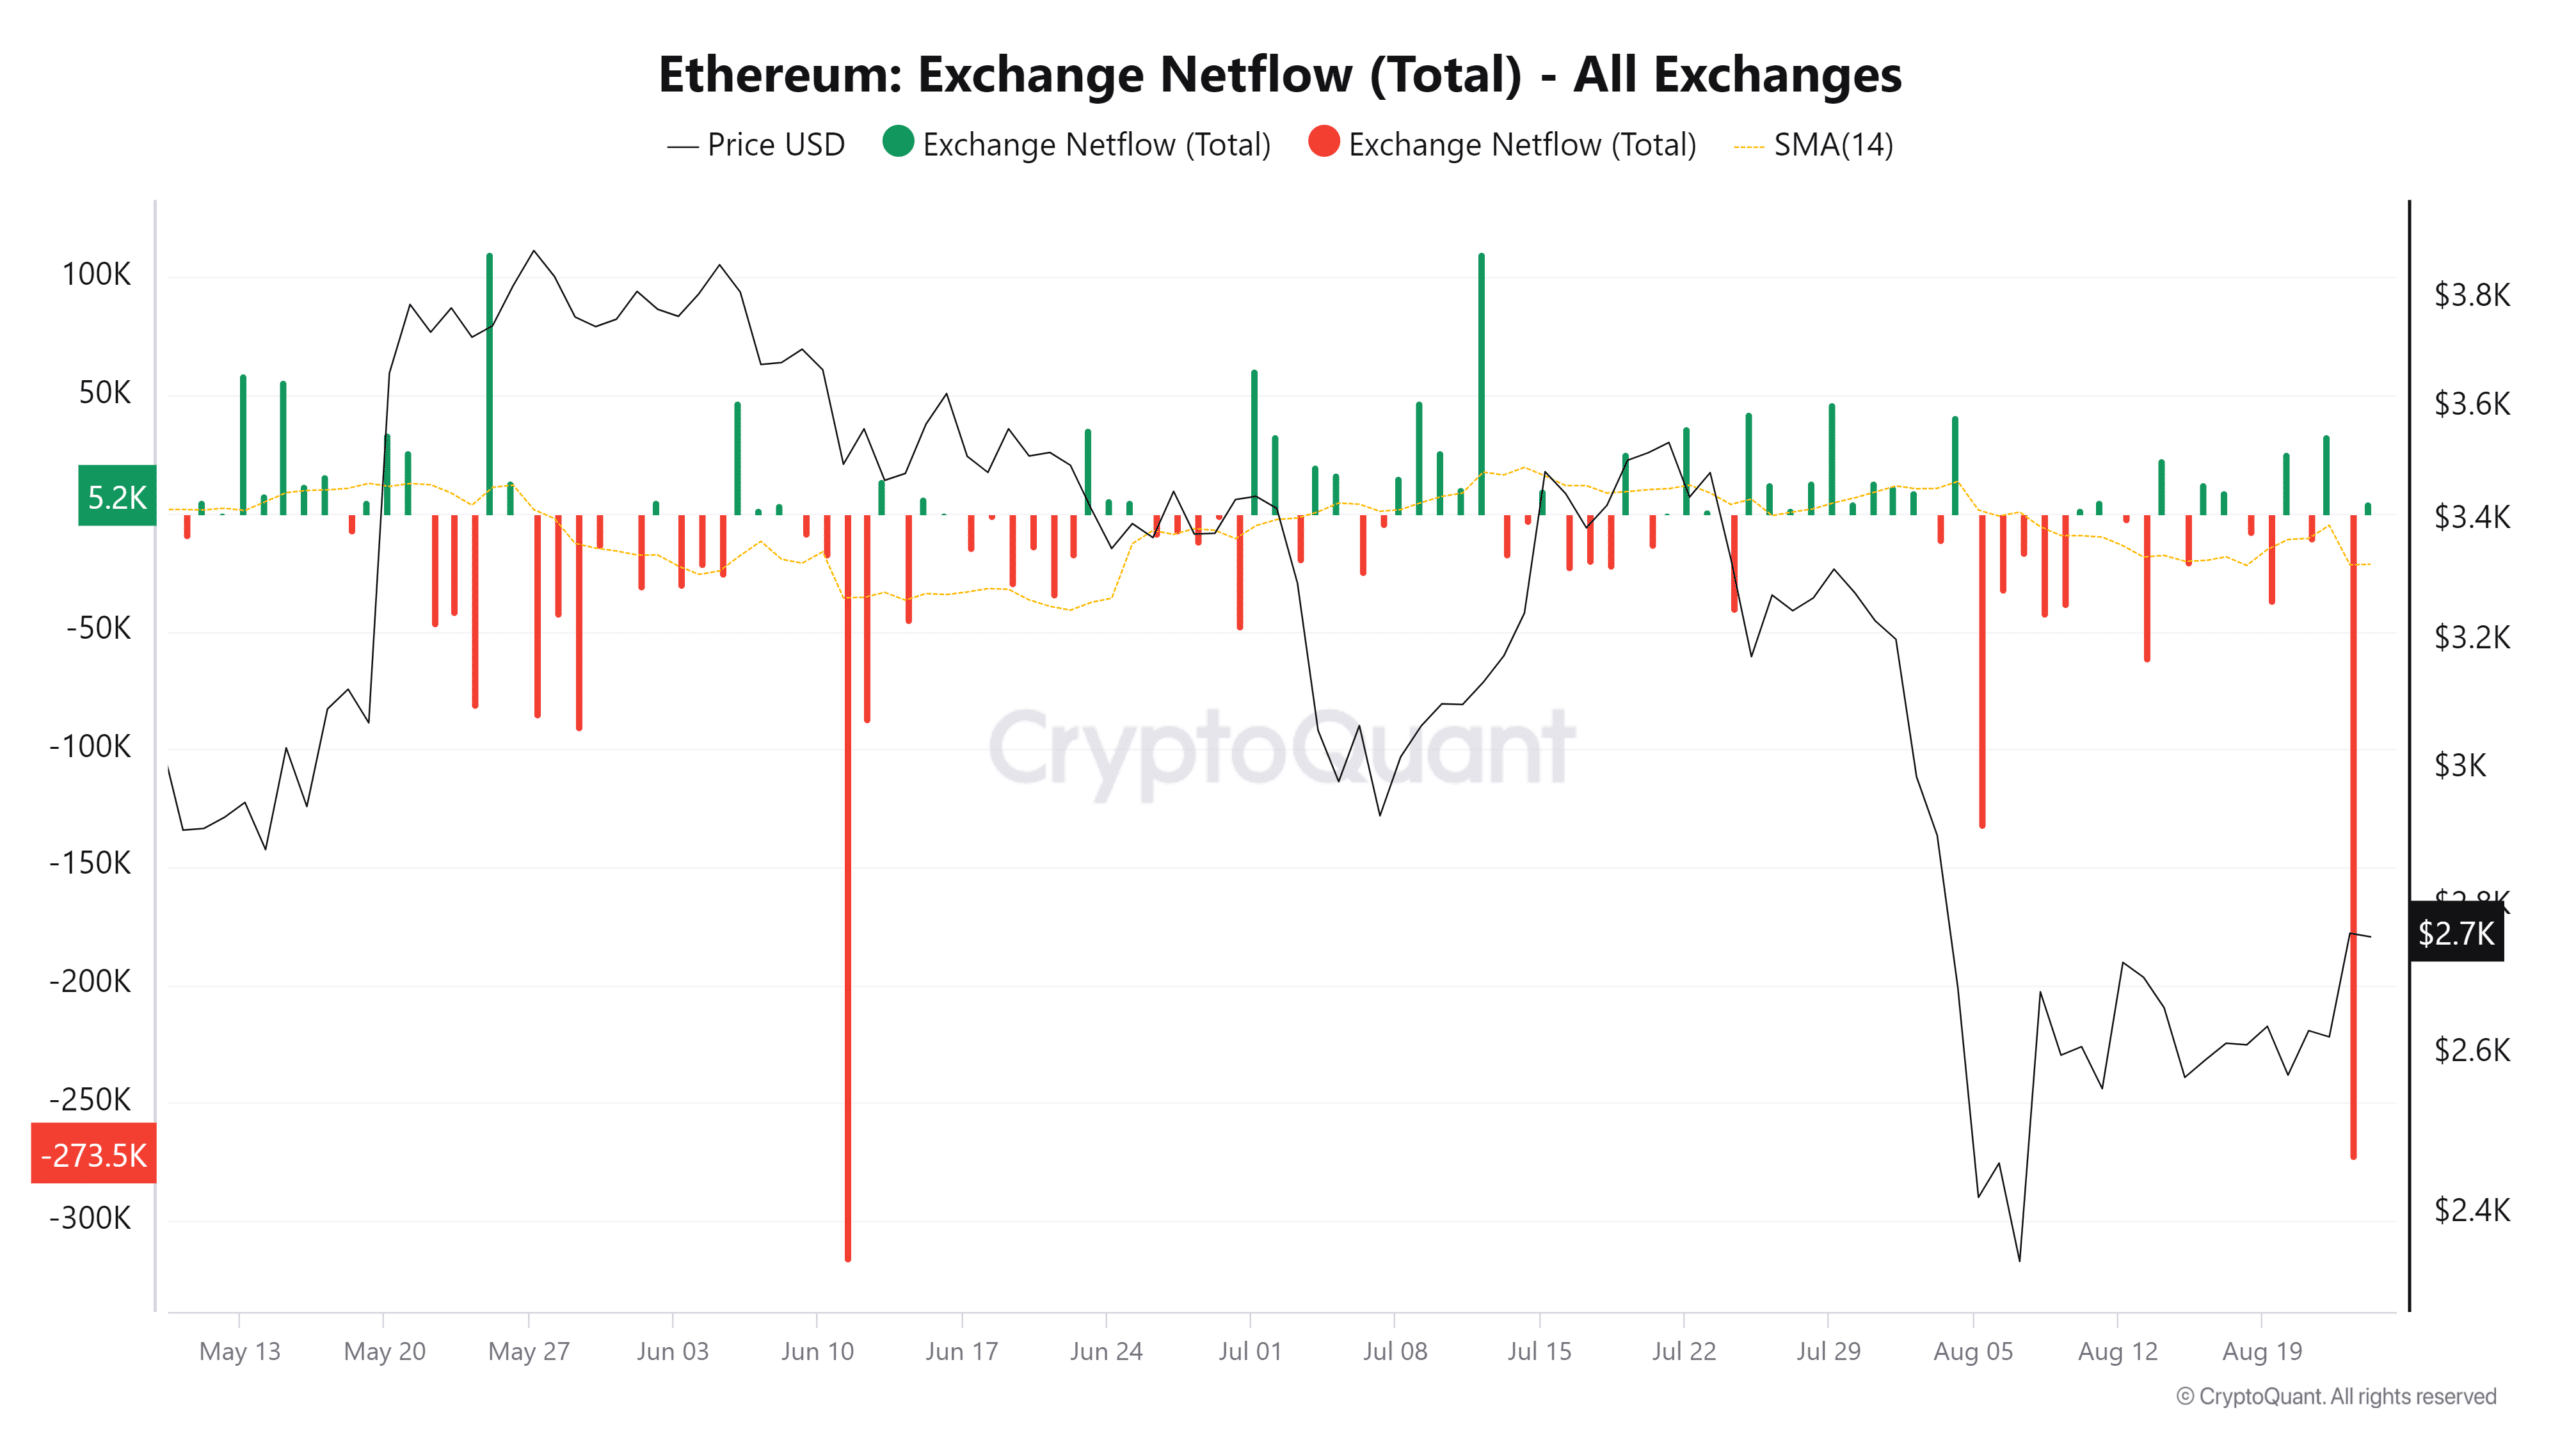
The flow of Ethereum from exchanges could shed more light on this. On the 23rd, there was a huge outflow of ETH that indicated accumulation. The 14-day simple moving average has resumed the downtrend it was on after the early August price drop.
This was an encouraging sign and could push prices toward the $3k resistance zone.
Should traders anticipate a breakout past $3k?
Source: Santiment
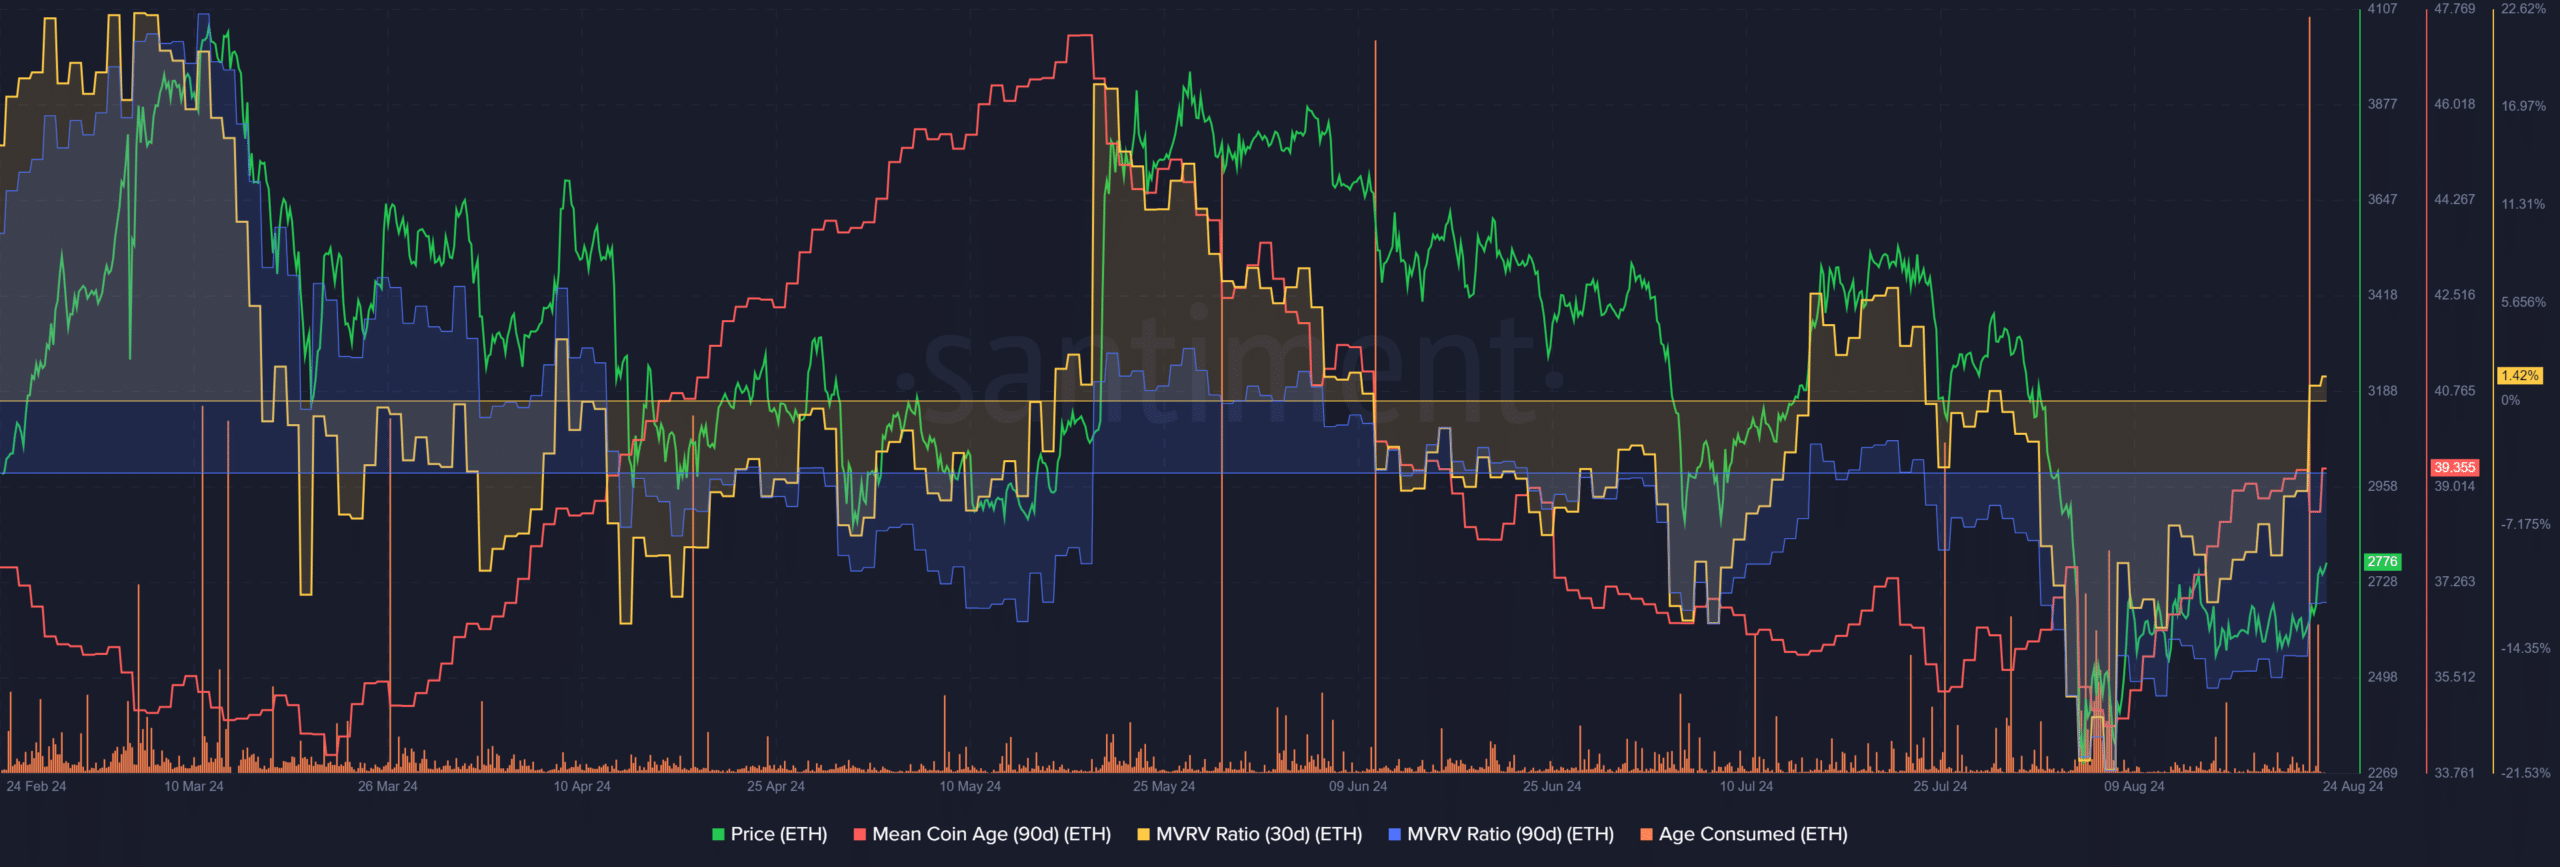
The 30-day MVRV stepped into the positive territory to indicate short-term holders at a marginal profit. The 90-day MVRV was still deeply negative. Meanwhile, the mean coin age has trended higher over the past three weeks.
This signaled network-wide accumulation, reinforcing the bullish idea from the netflows metric. However, the age-consumed metric saw a massive spike to show increased token movement.
Is your portfolio green? Check the Ethereum Profit Calculator
The drop in the network gas fee meant the ETH supply could turn inflationary over time, and could negatively impact ETH over the long term.
Such movements generally signal a wave of selling. Traders should be wary of selling pressure over the weekend and exercise caution during Monday’s trading session.
- The on-chain metrics showed bulls were eager to go long.
- The age consumed metric signaled caution while other metrics showed.
The taker buy/sell ratio shot skyward for Ethereum [ETH] over the past couple of days. This metric tracks the taker buy volume to sell volume ratio. Values below 1 indicate bearish sentiment.
Source: CryptoQuant
Taker refers to the nature of the order placed, being a market order rather than a limit order. This means these traders are willing to pay a slight premium to execute the trade at market prices. Hence, this ratio helps gauge sentiment.
Ethereum on the way to recovery
On the 31st of July, Ethereum was trading at $3.2k. Since the 20th of July, the taker buy/sell ratio has been negative, showing bearish sentiment was dominant. After the dump on the 5th of August, the market bounce encouraged long positions.
The metric’s spikes on the 8th of August and on the 23rd of August, while bullish, might not be indicative of a sustained recovery.
Source: CryptoQuant
The flow of Ethereum from exchanges could shed more light on this. On the 23rd, there was a huge outflow of ETH that indicated accumulation. The 14-day simple moving average has resumed the downtrend it was on after the early August price drop.
This was an encouraging sign and could push prices toward the $3k resistance zone.
Should traders anticipate a breakout past $3k?
Source: Santiment
The 30-day MVRV stepped into the positive territory to indicate short-term holders at a marginal profit. The 90-day MVRV was still deeply negative. Meanwhile, the mean coin age has trended higher over the past three weeks.
This signaled network-wide accumulation, reinforcing the bullish idea from the netflows metric. However, the age-consumed metric saw a massive spike to show increased token movement.
Is your portfolio green? Check the Ethereum Profit Calculator
The drop in the network gas fee meant the ETH supply could turn inflationary over time, and could negatively impact ETH over the long term.
Such movements generally signal a wave of selling. Traders should be wary of selling pressure over the weekend and exercise caution during Monday’s trading session.


Вам нужен займ под 0%? Нет проблем! Быстрые займы на карту в новых МФО предлагают займы без проверки кредитной истории и отказов для новых клиентов. Получите деньги мгновенно, просто заполнив заявку онлайн. Эта возможность доступна каждому, кто достиг 18 лет. Быстрый процесс, моментальный перевод на карту – и никаких лишних вопросов. Воспользуйтесь шансом получить займ под 0% прямо сейчас!
Wow superb blog layout How long have you been blogging for you make blogging look easy The overall look of your site is magnificent as well as the content
Techno rozen Good post! We will be linking to this particularly great post on our site. Keep up the great writing
can i buy cheap clomiphene cost generic clomiphene pills where to buy generic clomiphene without dr prescription where can i get clomid tablets where buy generic clomiphene without dr prescription cheapest clomiphene pills order generic clomid online
I couldn’t resist commenting. Well written!
More articles like this would make the blogosphere richer.
order azithromycin 500mg without prescription – buy cheap generic azithromycin order generic flagyl 400mg
buy amoxil sale – generic combivent 100mcg order ipratropium 100mcg generic
buy generic zithromax 250mg – azithromycin tablet nebivolol price
buy clavulanate for sale – https://atbioinfo.com/ ampicillin without prescription
buy esomeprazole 40mg sale – https://anexamate.com/ buy generic nexium for sale
buy coumadin without a prescription – https://coumamide.com/ buy cozaar generic
meloxicam generic – mobo sin order mobic online
oral prednisone 20mg – https://apreplson.com/ order prednisone 10mg without prescription
free ed pills – erection pills male ed drugs
order amoxicillin generic – buy amoxil generic amoxil cheap
buy diflucan 200mg without prescription – this purchase fluconazole pill
cenforce 50mg price – https://cenforcers.com/ buy cenforce 100mg generic
cialis for daily use reviews – click cialis online no prescription australia
zantac 150mg for sale – online purchase ranitidine pills
More articles like this would remedy the blogosphere richer. sitio web
With thanks. Loads of expertise! neurontin 100mg over the counter
This website positively has all of the information and facts I needed to this subject and didn’t know who to ask. https://ursxdol.com/cenforce-100-200-mg-ed/
I couldn’t resist commenting. Profoundly written! https://prohnrg.com/product/acyclovir-pills/
The thoroughness in this piece is noteworthy. https://aranitidine.com/fr/en_france_xenical/