


- The short-term Ethereum price prediction was a bounce toward $2,000.
- In the coming weeks, more losses appeared likely as bulls had little strength to hold the sellers back.
Ethereum [ETH] has fallen below the November 2024 lows. At press time, it was trading below the $2,000 psychological level that it had last tested in November 2023. This was worrisome for holders. ETH/BTC reached a low not seen since December 2020.
The technical indicators showed that the downtrend has not eased into a consolidation phase yet. Bearish targets to the south were highlighted- how likely is Ethereum to reach these support levels?
ETH retests $1,950 as resistance, time to go short?

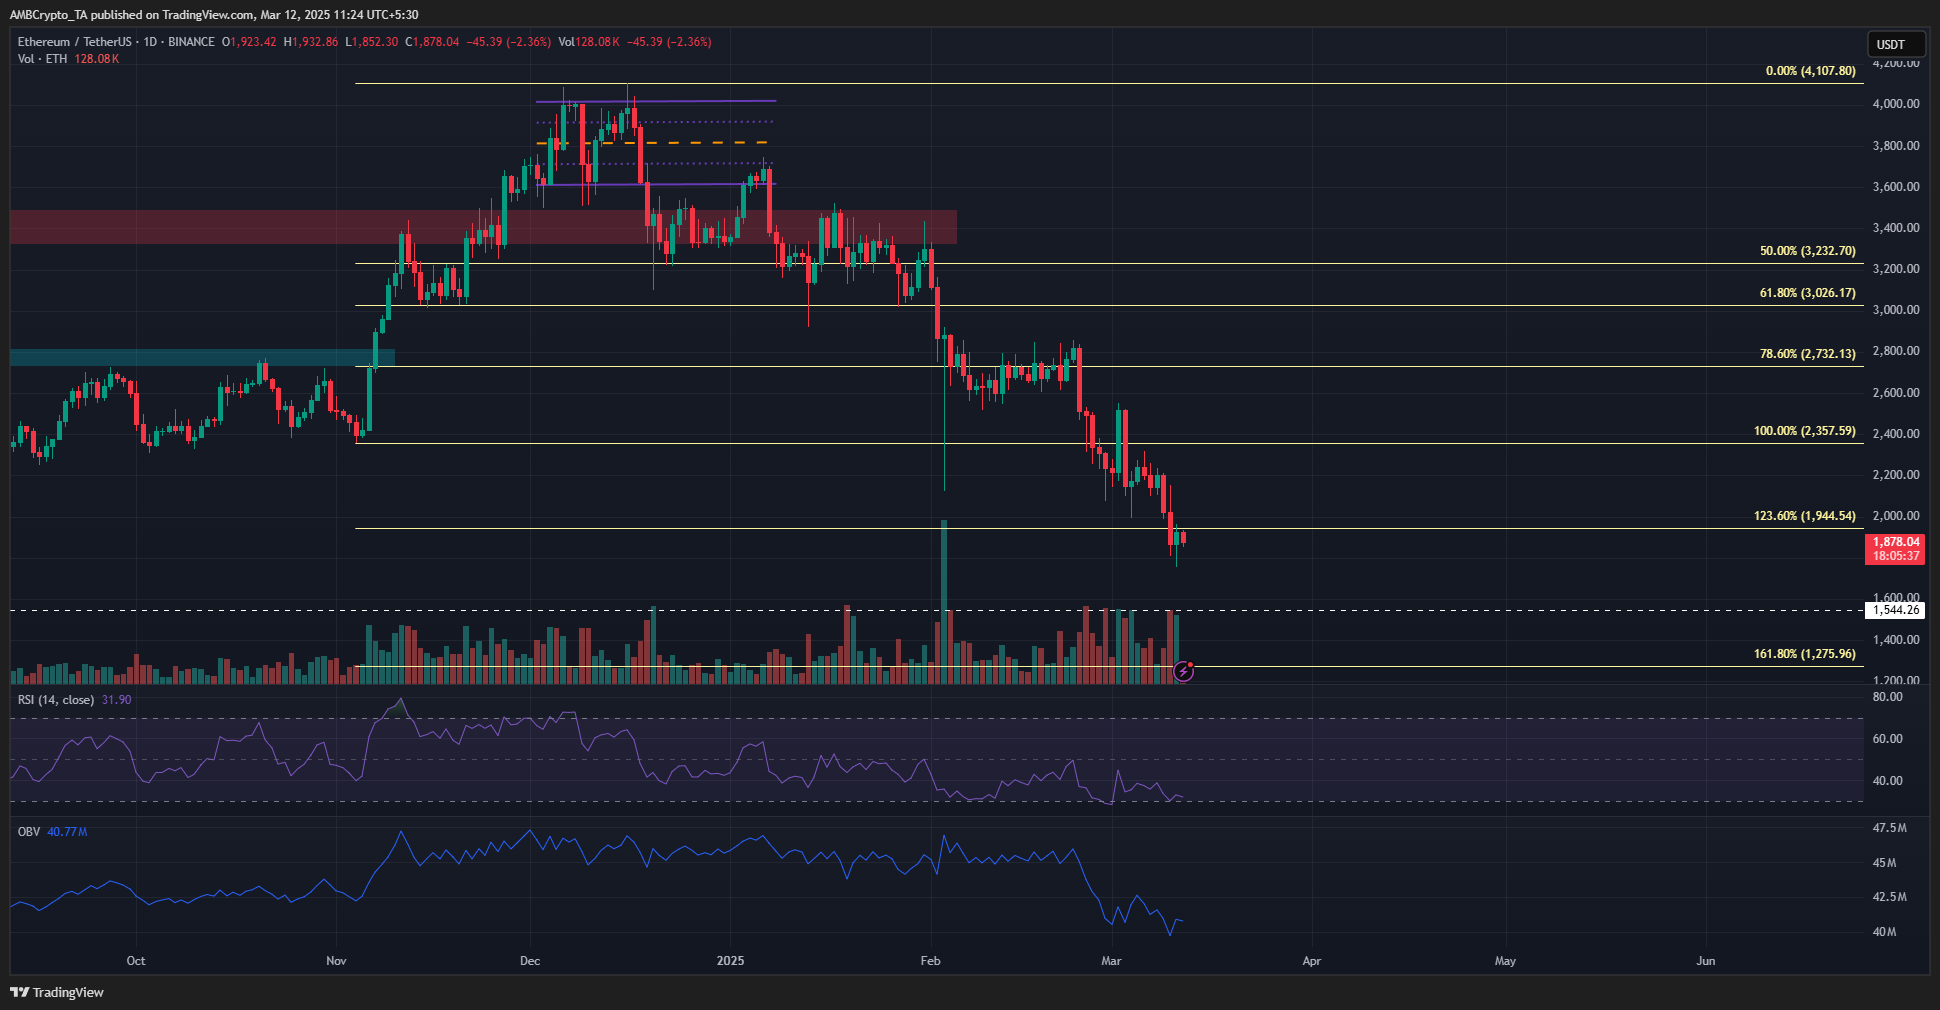
Source: ETH/USDT on TradingView
The daily chart reveals a firmly bearish market structure. The 23.6% southward Fibonacci extension level at $1,944 has been broken and retested as resistance.
The OBV continues to decline, indicating heightened selling pressure, while the RSI remains below the neutral 50 mark. However, over the past two weeks, a bullish divergence has formed on the RSI, suggesting the potential for a price bounce.
If a bounce occurs, the $2,100 area could serve as a short-term target before encountering resistance.
The declining OBV and price trend indicate that a consolidation phase has not yet begun. A range formation, accompanied by a rising OBV, would signal accumulation, but Ethereum bears still hold control.
As a result, Ethereum is likely to continue its downtrend in the coming weeks, with the next support level at $1,544.

Source: Coinglass
The 6-month liquidation heatmap showed that the $1.6k-$1.8k region was filled with a dense cluster of liquidation levels. This made it a good price target and also a prime candidate for a bullish reversal.
To the north, a strong magnetic zone was spotted at $2,872 and a less intense one at $2,360.

Source: Coinglass
To gauge the short-term trends, the 1-week liquidation heatmap was analyzed. It showed that a potential short-term range formation between $1,840 and $1,960.
Hence, traders need to be on their toes if the price bounce appears to stall near the $2k mark.
Disclaimer: The information presented does not constitute financial, investment, trading, or other types of advice and is solely the writer’s opinion
- The short-term Ethereum price prediction was a bounce toward $2,000.
- In the coming weeks, more losses appeared likely as bulls had little strength to hold the sellers back.
Ethereum [ETH] has fallen below the November 2024 lows. At press time, it was trading below the $2,000 psychological level that it had last tested in November 2023. This was worrisome for holders. ETH/BTC reached a low not seen since December 2020.
The technical indicators showed that the downtrend has not eased into a consolidation phase yet. Bearish targets to the south were highlighted- how likely is Ethereum to reach these support levels?
ETH retests $1,950 as resistance, time to go short?
Source: ETH/USDT on TradingView
The daily chart reveals a firmly bearish market structure. The 23.6% southward Fibonacci extension level at $1,944 has been broken and retested as resistance.
The OBV continues to decline, indicating heightened selling pressure, while the RSI remains below the neutral 50 mark. However, over the past two weeks, a bullish divergence has formed on the RSI, suggesting the potential for a price bounce.
If a bounce occurs, the $2,100 area could serve as a short-term target before encountering resistance.
The declining OBV and price trend indicate that a consolidation phase has not yet begun. A range formation, accompanied by a rising OBV, would signal accumulation, but Ethereum bears still hold control.
As a result, Ethereum is likely to continue its downtrend in the coming weeks, with the next support level at $1,544.
Source: Coinglass
The 6-month liquidation heatmap showed that the $1.6k-$1.8k region was filled with a dense cluster of liquidation levels. This made it a good price target and also a prime candidate for a bullish reversal.
To the north, a strong magnetic zone was spotted at $2,872 and a less intense one at $2,360.
Source: Coinglass
To gauge the short-term trends, the 1-week liquidation heatmap was analyzed. It showed that a potential short-term range formation between $1,840 and $1,960.
Hence, traders need to be on their toes if the price bounce appears to stall near the $2k mark.
Disclaimer: The information presented does not constitute financial, investment, trading, or other types of advice and is solely the writer’s opinion


buy clomid without dr prescription can i purchase cheap clomiphene without insurance get clomiphene without rx can i purchase clomiphene online can i get cheap clomid without prescription buy clomid without dr prescription buy cheap clomiphene
Thanks for sharing. It’s acme quality.
Proof blog you procure here.. It’s hard to on strong quality writing like yours these days. I really comprehend individuals like you! Go through vigilance!!
buy generic domperidone for sale – order motilium 10mg sale buy generic cyclobenzaprine for sale
augmentin 375mg pill – atbio info ampicillin sale
nexium ca – https://anexamate.com/ nexium 20mg pills
buy medex sale – blood thinner cost cozaar 50mg
buy generic meloxicam for sale – https://moboxsin.com/ buy mobic 15mg online
deltasone 20mg over the counter – https://apreplson.com/ generic deltasone 40mg
purchase diflucan for sale – diflucan 100mg us diflucan 200mg brand
order generic escitalopram 10mg – https://escitapro.com/ buy escitalopram 20mg generic
cenforce 100mg cost – cenforce canada buy generic cenforce
buy generic cialiss – https://ciltadgn.com/ cialis vs flomax
cialis for ed – https://strongtadafl.com/# cialis experience
zantac canada – https://aranitidine.com/# buy zantac 150mg sale
buy 50 mg viagra online – click buy sildenafil citrate tablets 100mg
This is a question which is near to my heart… Diverse thanks! Faithfully where can I find the contact details an eye to questions? does prednisone cause muscle spasms
More content pieces like this would make the web better. https://gnolvade.com/
This is the gentle of literature I truly appreciate. https://ursxdol.com/doxycycline-antibiotic/
More articles like this would remedy the blogosphere richer. https://prohnrg.com/product/atenolol-50-mg-online/