- A close above $3,700 could help the price back to $4,000.
- The Pi Cycle Top indicator revealed that the ETH might rally.
Ethereum [ETH] seemed to have become a shadow of its former self after the price collapsed from $3,633 to $3,22o in the last 24 hours.
Despite the decline, AMBCrypto agrees that the value of the altcoin might retest $4,000. However, this prediction might not come cheap or easy.
This is because of the number of addresses that accumulated ETH around $3,700. This has made it a key resistance zone.
According to IntoTheBlock, ETH’s previous rise above $4,000 placed 89% of its holders in profit.

Source: X
Who decided what’s next?
However, the recent decline meant that there was a sell wall at $3,700 where 991,000 ETH addresses purchased 4.35 million coins.
With ETH trading below the region, the holders have an opportunity to break even if the price climbs.
If the participants decide to book profits, the altcoin might find it challenging to revisit the psychological $4,000 mark.
On the other hand, if buying pressure outweighs the on-chain sell volume, then ETH might cruise above $3,700.
But whether the cryptocurrency would continue to languish in the red does not depend on the on-chain outlook alone.
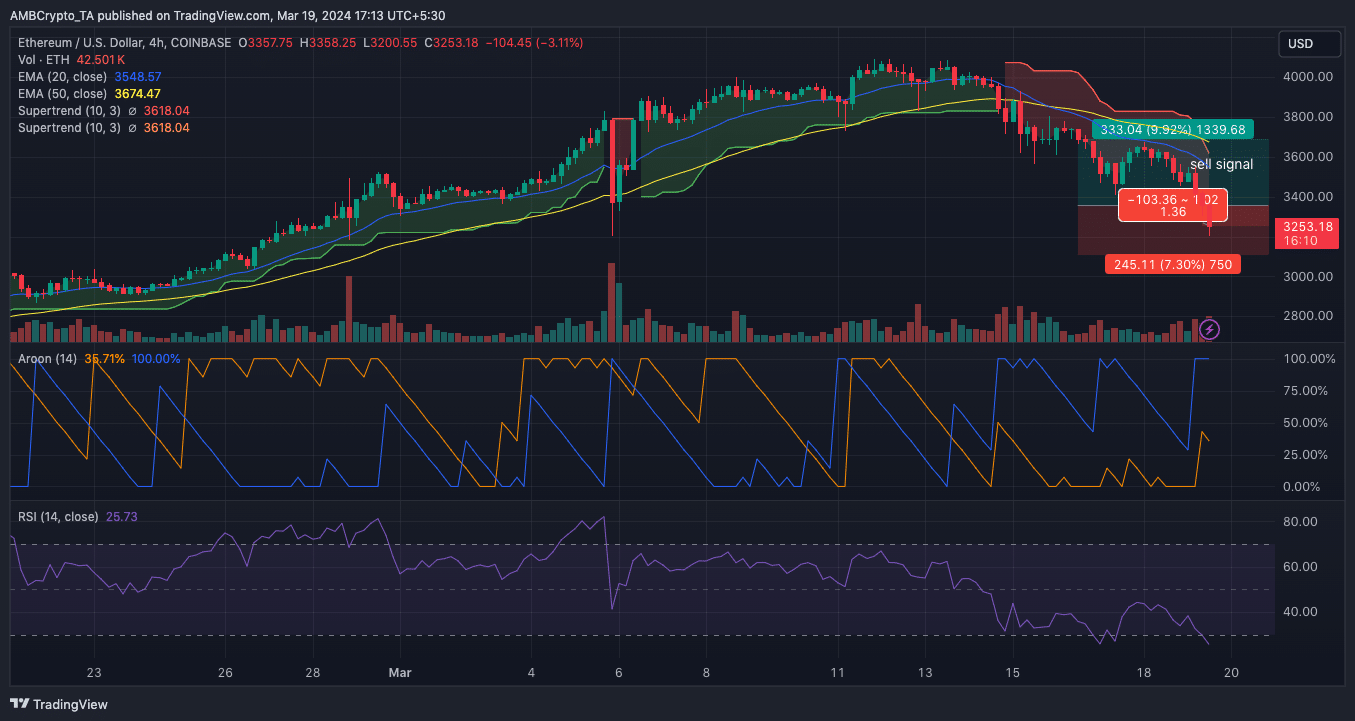
Therefore, AMBCrypto gauged the price action from a technical perspective. According to the 4-hour ETH/USD chart, the Exponential Moving Average (EMA) depicted a short-term bearish trend for the altcoin.
At press time, the 20 EMA (blue) crossed below the 50 EMA (yellow). With this trend, the price of the cryptocurrency might drop by another 7.30%. Should this happen, the value could hit $3,112.
A look at the Aroon Indicator also reinforced the bearish bias. As of this writing, the Aroon Down (blue) was 100% while the Aroon Up (orange) was 35.71%. This indicates that sellers were in control of the price action.

Source: TradingView
ETH is oversold
Furthermore, an assessment of the Supertrend indicated that ETH has not yet flashed a buy signal. But there was an earlier sell signal at $3,780.
Meanwhile, the Relative Strength Index (RSI) was in the oversold region. If the reading continues to decrease, then the chances of a harder bounce might also increase.
In a highly bullish case, ETH might climb to $4,500 when the market turbulence fizzles.
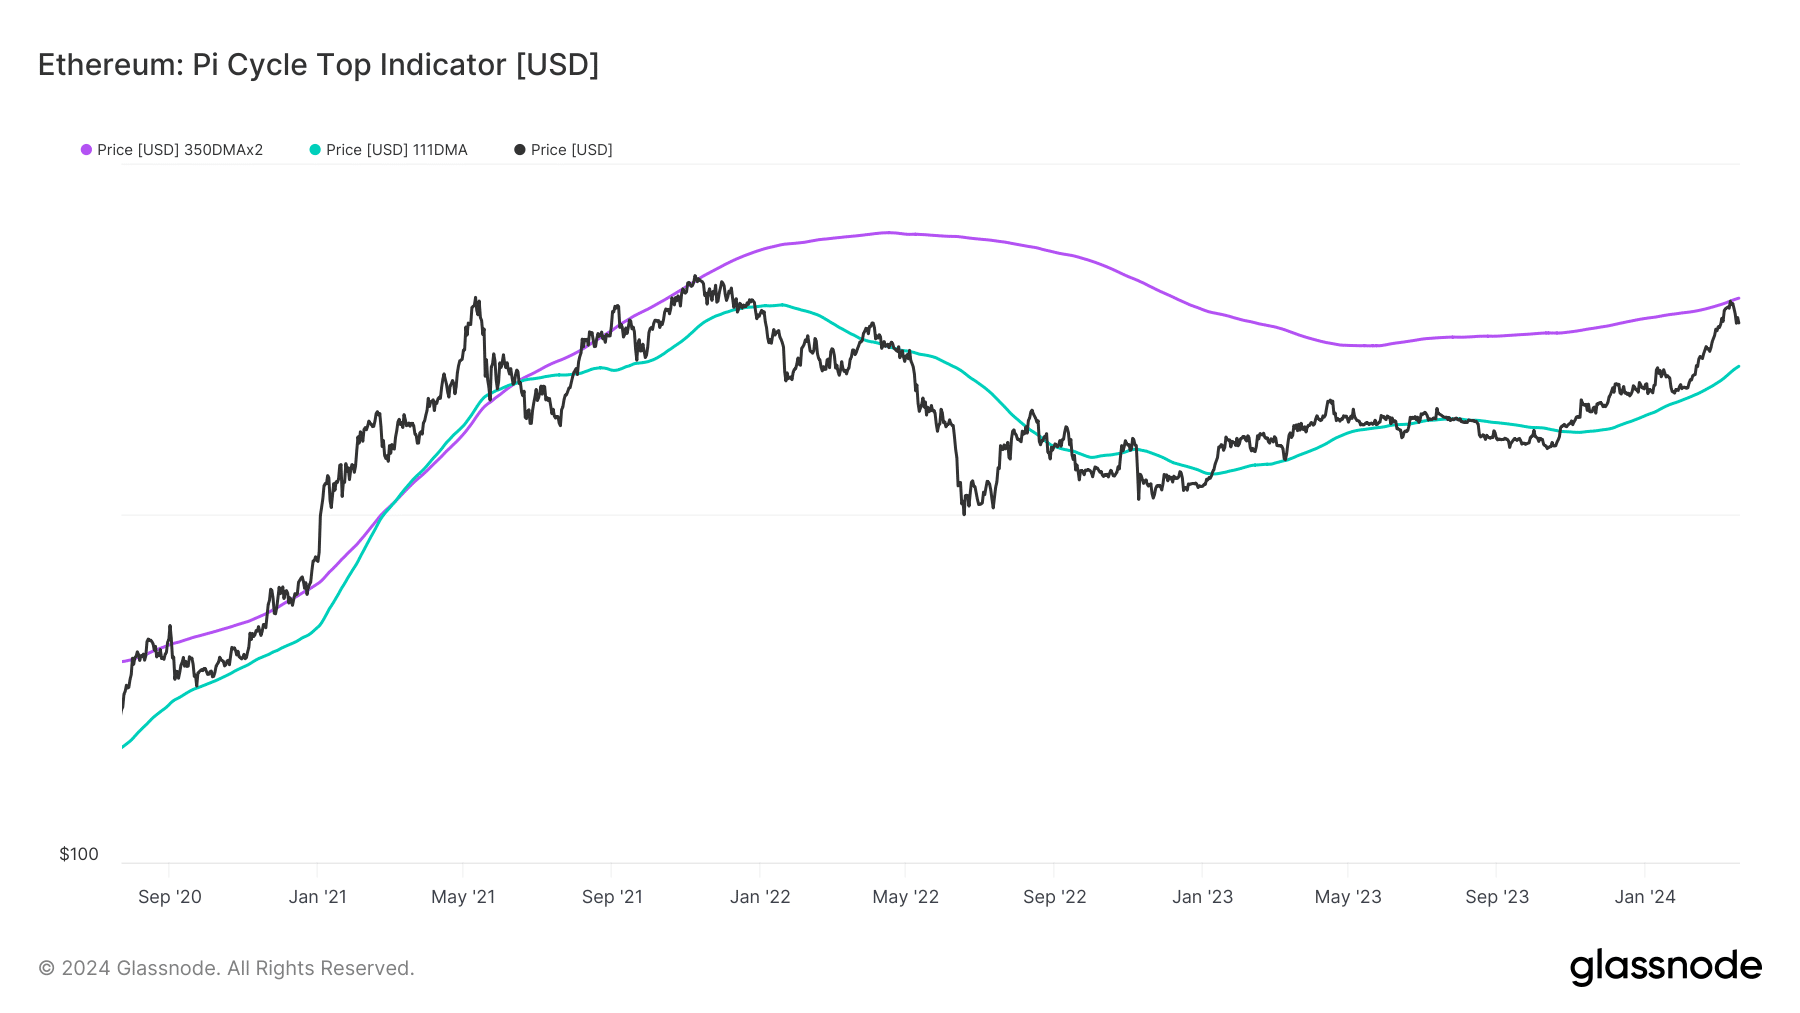
While the short-term outlook looked gloomy for ETH, the Pi Cycle Top indicated otherwise for the mid to long-term.
Historically, the indicator tells when a cryptocurrency is close to the bottom or has hit the market top.
How much are 1,10,100 ETHs worth today?
If the 111-day moving average (MA), in green hits the same region as the 350-day MA (purple), then Ethereum would have hit the top of this cycle.

Source: Glassnode
But that was not the case, as the 111-day MA was lower than its opposite number. Thus, the price of ETH might have a lot of upside potential over the forthcoming months.
- A close above $3,700 could help the price back to $4,000.
- The Pi Cycle Top indicator revealed that the ETH might rally.
Ethereum [ETH] seemed to have become a shadow of its former self after the price collapsed from $3,633 to $3,22o in the last 24 hours.
Despite the decline, AMBCrypto agrees that the value of the altcoin might retest $4,000. However, this prediction might not come cheap or easy.
This is because of the number of addresses that accumulated ETH around $3,700. This has made it a key resistance zone.
According to IntoTheBlock, ETH’s previous rise above $4,000 placed 89% of its holders in profit.

Source: X
Who decided what’s next?
However, the recent decline meant that there was a sell wall at $3,700 where 991,000 ETH addresses purchased 4.35 million coins.
With ETH trading below the region, the holders have an opportunity to break even if the price climbs.
If the participants decide to book profits, the altcoin might find it challenging to revisit the psychological $4,000 mark.
On the other hand, if buying pressure outweighs the on-chain sell volume, then ETH might cruise above $3,700.
But whether the cryptocurrency would continue to languish in the red does not depend on the on-chain outlook alone.
Therefore, AMBCrypto gauged the price action from a technical perspective. According to the 4-hour ETH/USD chart, the Exponential Moving Average (EMA) depicted a short-term bearish trend for the altcoin.
At press time, the 20 EMA (blue) crossed below the 50 EMA (yellow). With this trend, the price of the cryptocurrency might drop by another 7.30%. Should this happen, the value could hit $3,112.
A look at the Aroon Indicator also reinforced the bearish bias. As of this writing, the Aroon Down (blue) was 100% while the Aroon Up (orange) was 35.71%. This indicates that sellers were in control of the price action.

Source: TradingView
ETH is oversold
Furthermore, an assessment of the Supertrend indicated that ETH has not yet flashed a buy signal. But there was an earlier sell signal at $3,780.
Meanwhile, the Relative Strength Index (RSI) was in the oversold region. If the reading continues to decrease, then the chances of a harder bounce might also increase.
In a highly bullish case, ETH might climb to $4,500 when the market turbulence fizzles.
While the short-term outlook looked gloomy for ETH, the Pi Cycle Top indicated otherwise for the mid to long-term.
Historically, the indicator tells when a cryptocurrency is close to the bottom or has hit the market top.
How much are 1,10,100 ETHs worth today?
If the 111-day moving average (MA), in green hits the same region as the 350-day MA (purple), then Ethereum would have hit the top of this cycle.

Source: Glassnode
But that was not the case, as the 111-day MA was lower than its opposite number. Thus, the price of ETH might have a lot of upside potential over the forthcoming months.


![[PART 3] The Ethereum Layer-2 Wars (Here’s How They’ll End)](https://coininsights.com/wp-content/uploads/2024/03/unnamed-14-75x75.png)


clomiphene tablets can i buy cheap clomiphene without dr prescription clomiphene tablets uses in urdu clomiphene tablets cost of clomiphene price get cheap clomiphene without a prescription where can i buy generic clomid
More peace pieces like this would urge the web better.
More peace pieces like this would make the интернет better.
buy azithromycin generic – tindamax cost buy metronidazole 200mg pills
rybelsus 14mg over the counter – purchase semaglutide for sale cyproheptadine 4 mg pill
domperidone pill – tetracycline 250mg usa brand cyclobenzaprine
order inderal 10mg generic – cost plavix order methotrexate pills
oral zithromax 250mg – order azithromycin online buy bystolic 20mg generic
order augmentin 625mg online cheap – https://atbioinfo.com/ buy acillin pills for sale
nexium 40mg cost – https://anexamate.com/ order esomeprazole sale
how to buy warfarin – blood thinner hyzaar us
meloxicam 7.5mg pill – moboxsin purchase meloxicam for sale
prednisone 40mg ca – https://apreplson.com/ prednisone 40mg us
erection problems – erection pills that work free ed pills
buy amoxicillin without prescription – combamoxi generic amoxicillin
oral diflucan – fluconazole online order diflucan usa
cenforce 100mg pill – this cost cenforce 100mg
cialis dosage for ed – https://ciltadgn.com/ generic tadalafil 40 mg
ranitidine 300mg sale – https://aranitidine.com/# buy generic ranitidine for sale
u.s. pharmacy prices for cialis – https://strongtadafl.com/# reliable source cialis
This is the stripe of content I take advantage of reading. comprar provigil espana
buy viagra thailand – https://strongvpls.com/# viagra women sale australia
Thanks on sharing. It’s first quality. neurontin 800mg pill
This website positively has all of the low-down and facts I needed adjacent to this thesis and didn’t identify who to ask. https://ursxdol.com/sildenafil-50-mg-in/
More posts like this would bring about the blogosphere more useful. https://prohnrg.com/product/rosuvastatin-for-sale/
This is a question which is virtually to my verve… Many thanks! Exactly where can I upon the acquaintance details an eye to questions? viagra homme sans prescription
This website really has all of the tidings and facts I needed about this thesis and didn’t positive who to ask. https://ondactone.com/product/domperidone/
The depth in this serving is exceptional.
https://doxycyclinege.com/pro/losartan/
This website exceedingly has all of the low-down and facts I needed there this subject and didn’t comprehend who to ask. http://www.gtcm.info/home.php?mod=space&uid=1158214
buy dapagliflozin online – on this site dapagliflozin for sale
buy generic orlistat over the counter – xenical over the counter order orlistat 120mg for sale