


![]()
Journalist
Posted:
- The Market Value to Realized Value (MVRV) ratio hinted at a possible historic pattern repeat for Ethereum.
- A declining supply of ETH on exchanges and high buying volume may also contribute to this rally.
Ethereum’s [ETH] is regaining market strength following a month-long decline of 16.81%. Over the past 24 hours, the asset has seen a bullish 2.87% gain, at press time, bringing its price to $2,718.88.
On-chain metrics reveal high buying volumes, particularly from U.S. retail investors. Coupled with historic patterns, this hints at a developing bullish move.
Historic pattern taking shape
A crypto analyst observed that Ethereum’s Market Value to Realized Value (MVRV-z) score on Glassnode is forming a pattern similar to previous movements that preceded major rallies.
The MVRV-z score helps identify potential points of overvaluation or undervaluation for an asset based on its chart position.
According to the analyst:
“Ethereum is yet to enter a bull market this cycle.”

Source: Glassnode
This conclusion was drawn from previous rallies that followed when ETH entered the green zone on the chart.
With ETH recently trading in this zone and beginning to move upward, historical trends suggest the potential for an extended rally.
Supply decreases as retail investors buy
CryptoQuant data shows a declining ETH exchange reserve. From the 2nd of February to press time, available ETH on exchanges has dropped by approximately 714,129.
This significant decline suggests growing demand among investors purchasing ETH in large quantities and moving it into private wallets.
Exchange Reserves quantify the amount of an asset available across cryptocurrency exchanges.
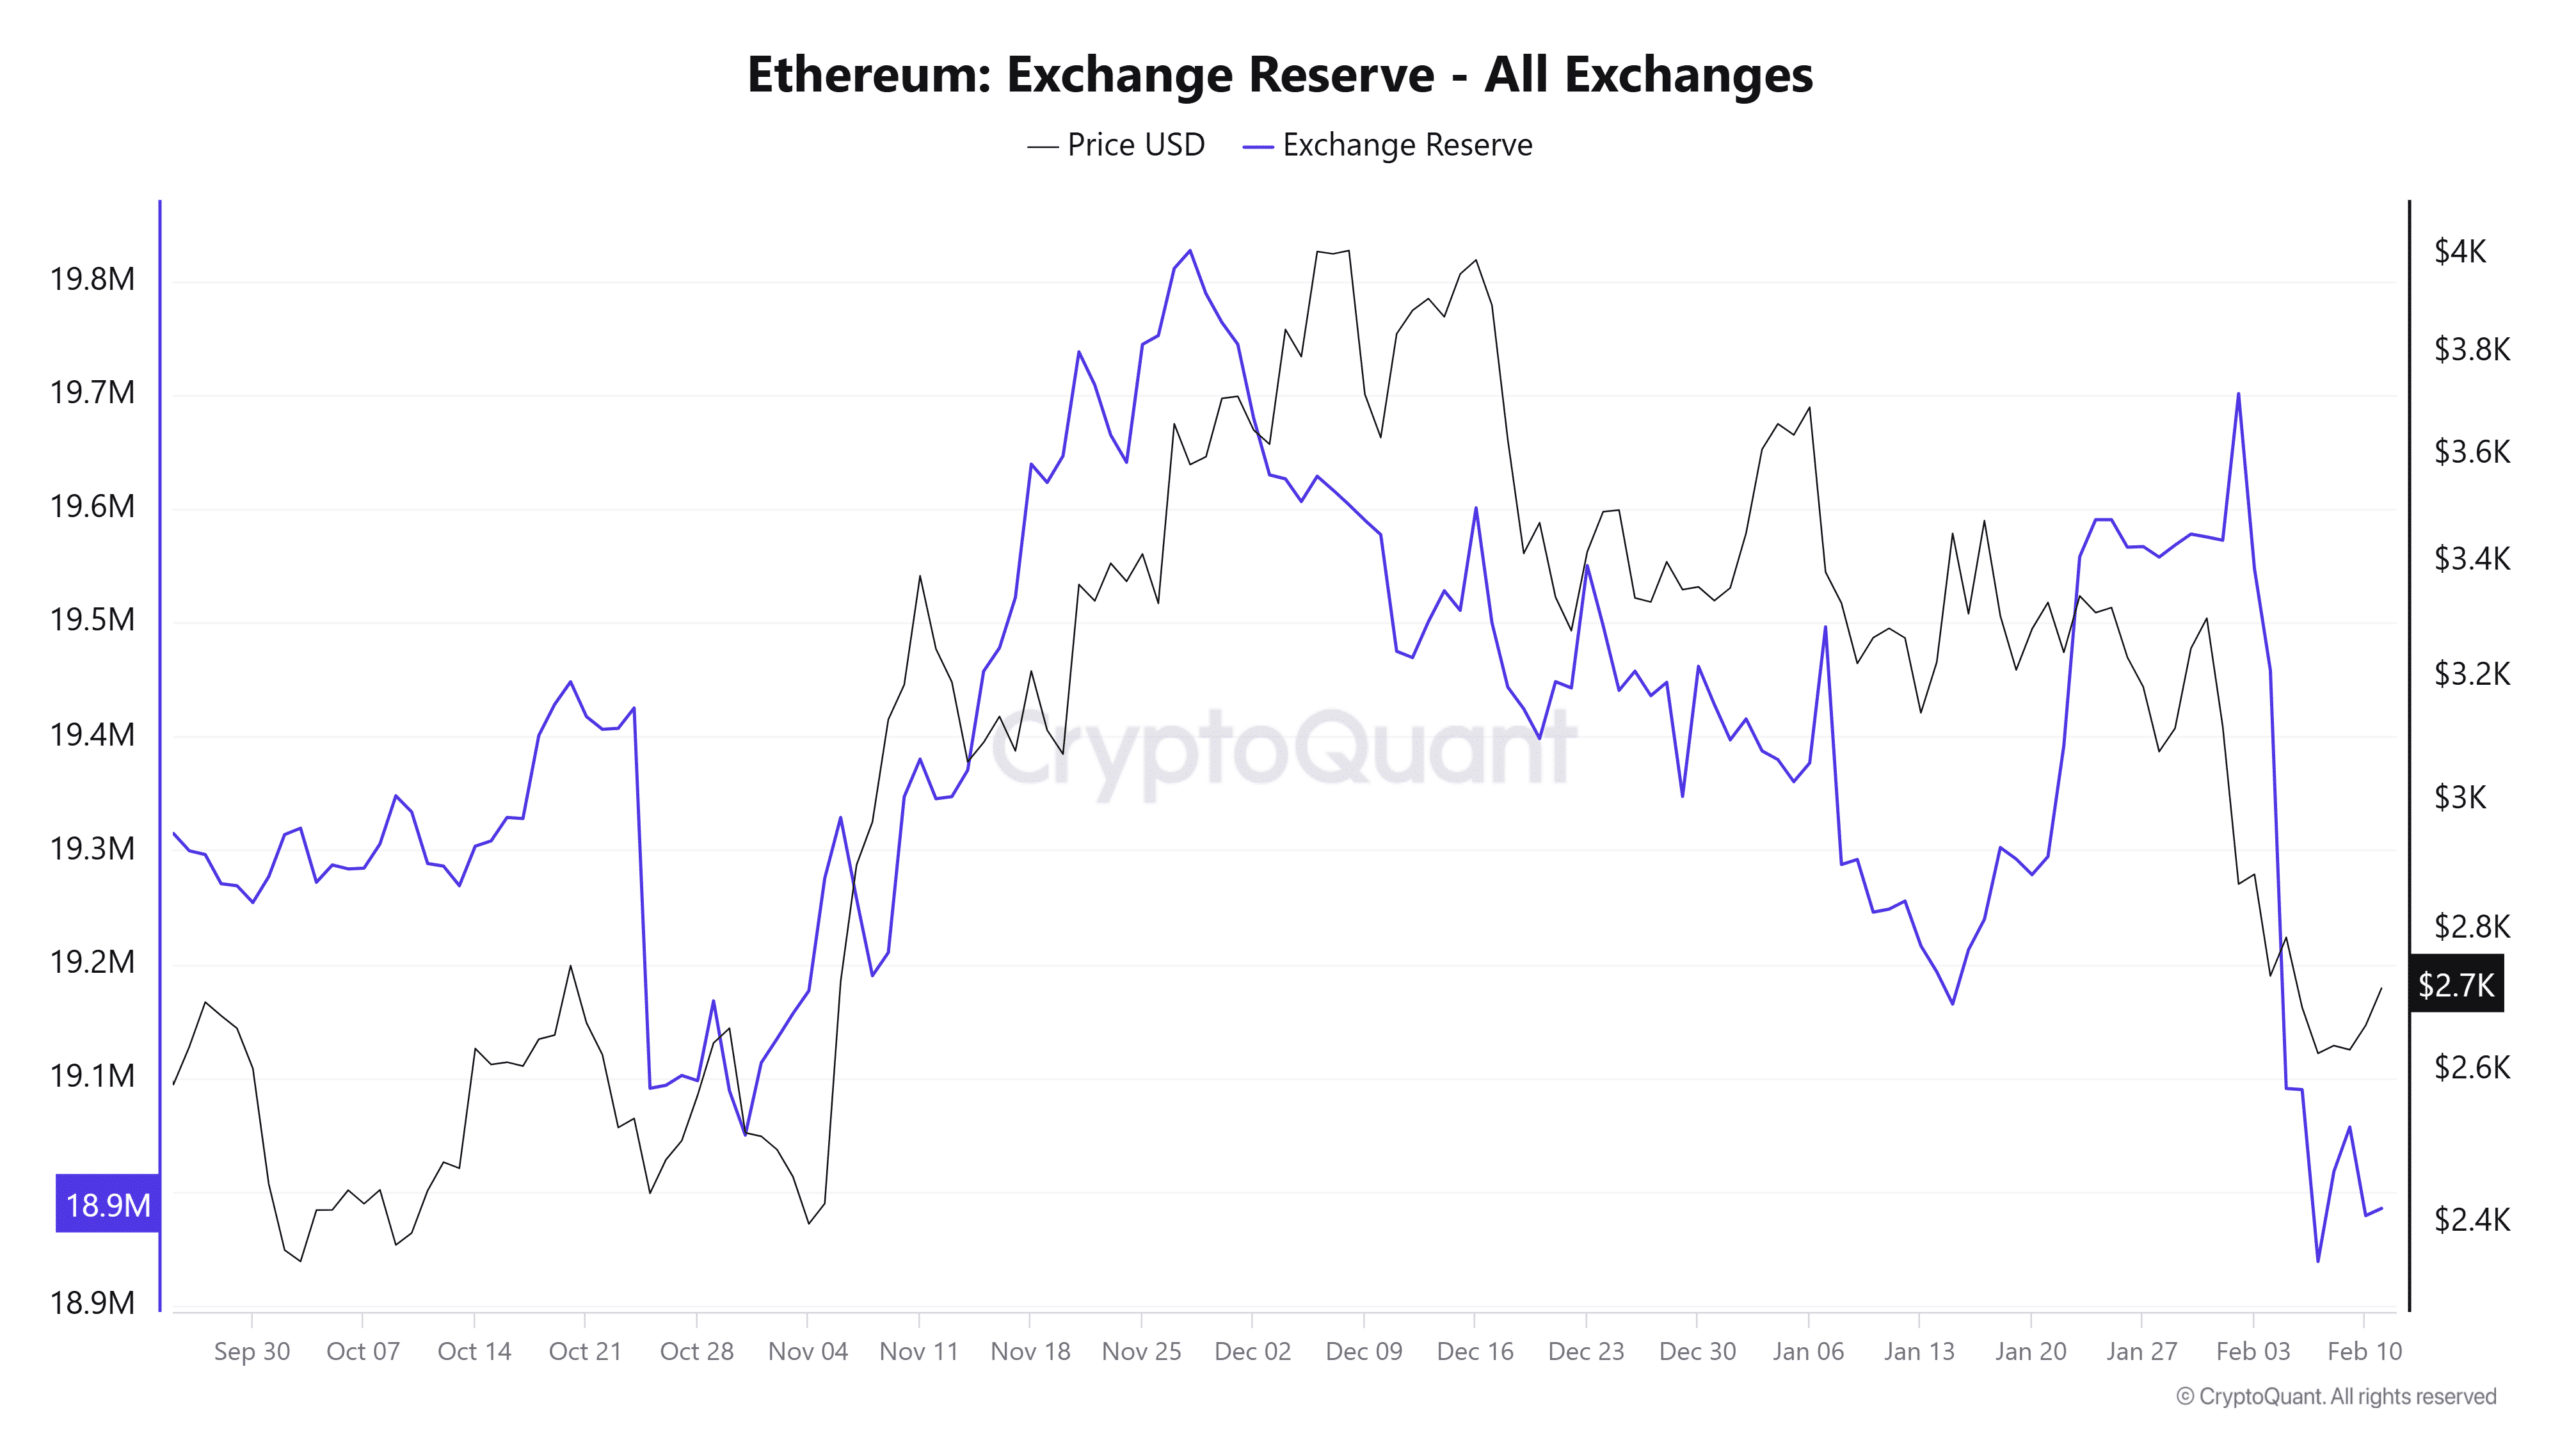
Source: CryptoQuant
AMBCrypto traced recent demand to U.S. retail investors, identified through the Coinbase Premium Index. This index measures buying and selling activity on Coinbase compared to Binance.
A positive reading indicates increased accumulation by U.S. investors. The current index value stands at 0.0255 in the green region.
If U.S. investors continue accumulating alongside other market participants, ETH’s price may continue to rise.
Buying volume surge
The Taker Buy Sell Ratio jumped from 0.967 the previous day to a high of 1.084 — a level last seen on the 3rd of January.
When the ratio is above 1, it signals more buying activity in the derivatives market than selling, reinforcing bullish sentiment.
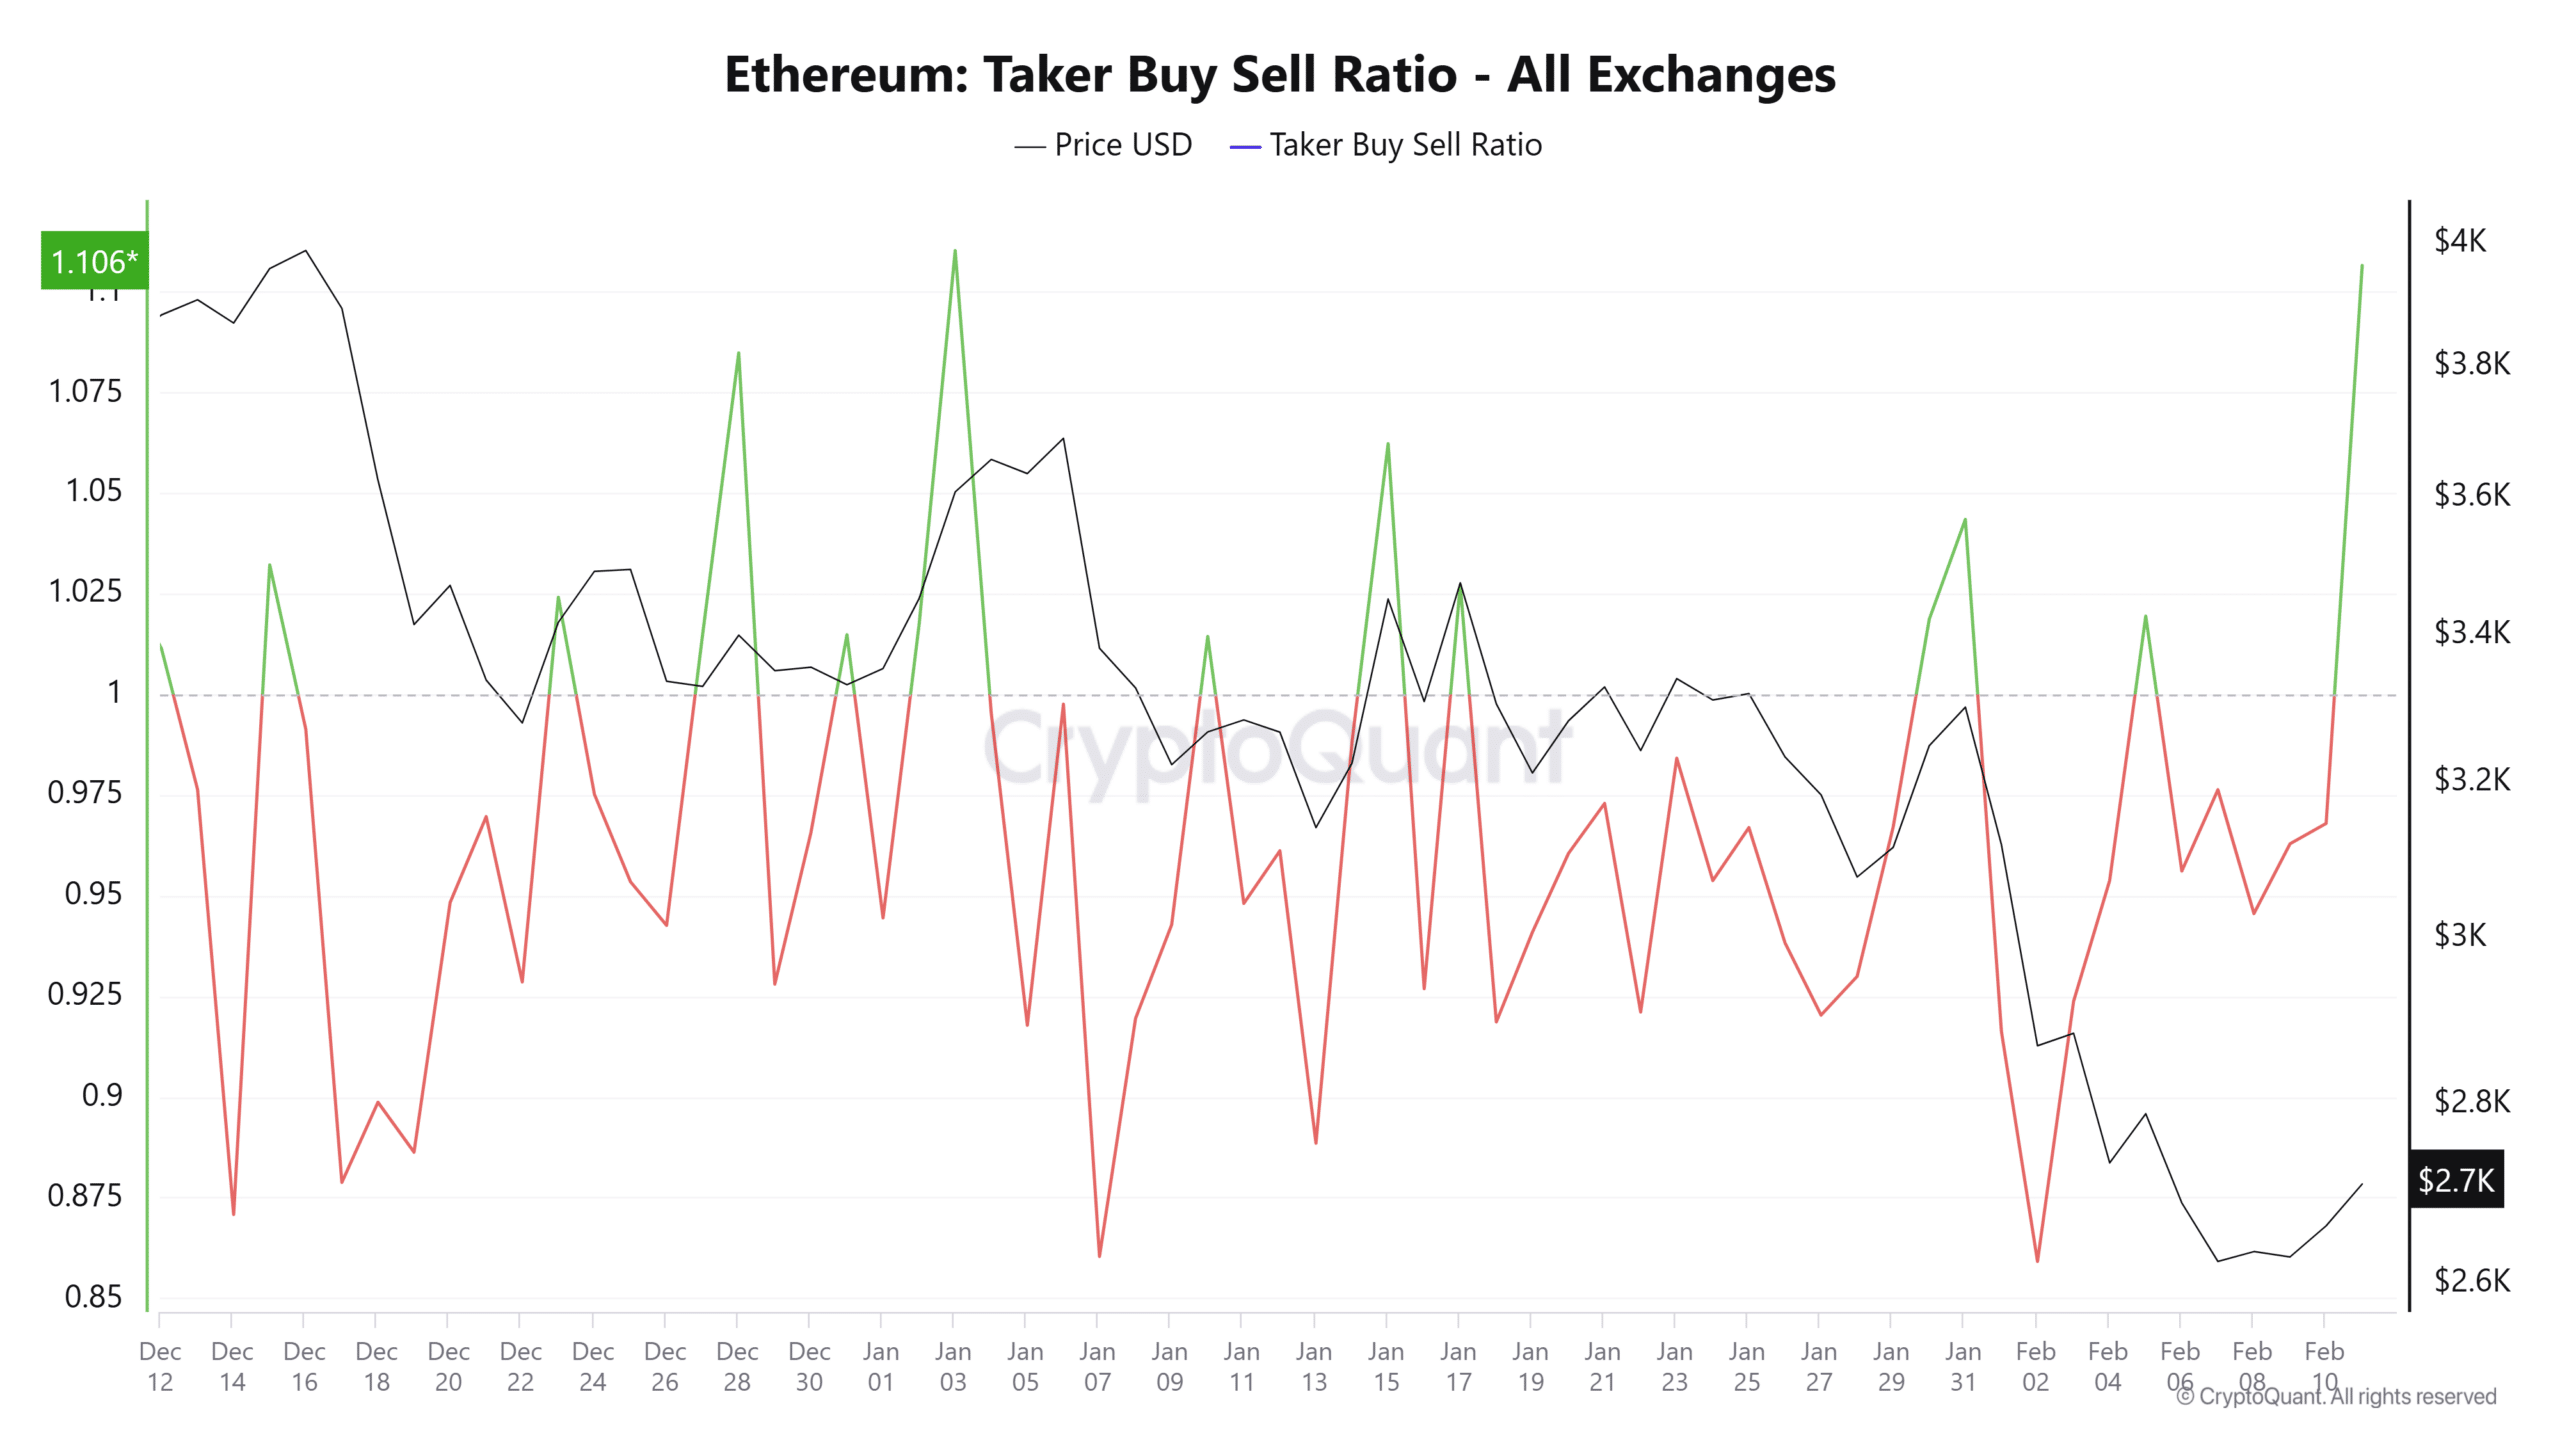
Source: CryptoQuant
Read Ethereum’s [ETH] Price Prediction 2025–2026
With U.S. investors actively purchasing in the spot market and bullish sentiment building in the derivatives market, ETH’s rally appears to be gaining momentum.
![]()
Journalist
Posted:
- The Market Value to Realized Value (MVRV) ratio hinted at a possible historic pattern repeat for Ethereum.
- A declining supply of ETH on exchanges and high buying volume may also contribute to this rally.
Ethereum’s [ETH] is regaining market strength following a month-long decline of 16.81%. Over the past 24 hours, the asset has seen a bullish 2.87% gain, at press time, bringing its price to $2,718.88.
On-chain metrics reveal high buying volumes, particularly from U.S. retail investors. Coupled with historic patterns, this hints at a developing bullish move.
Historic pattern taking shape
A crypto analyst observed that Ethereum’s Market Value to Realized Value (MVRV-z) score on Glassnode is forming a pattern similar to previous movements that preceded major rallies.
The MVRV-z score helps identify potential points of overvaluation or undervaluation for an asset based on its chart position.
According to the analyst:
“Ethereum is yet to enter a bull market this cycle.”
Source: Glassnode
This conclusion was drawn from previous rallies that followed when ETH entered the green zone on the chart.
With ETH recently trading in this zone and beginning to move upward, historical trends suggest the potential for an extended rally.
Supply decreases as retail investors buy
CryptoQuant data shows a declining ETH exchange reserve. From the 2nd of February to press time, available ETH on exchanges has dropped by approximately 714,129.
This significant decline suggests growing demand among investors purchasing ETH in large quantities and moving it into private wallets.
Exchange Reserves quantify the amount of an asset available across cryptocurrency exchanges.
Source: CryptoQuant
AMBCrypto traced recent demand to U.S. retail investors, identified through the Coinbase Premium Index. This index measures buying and selling activity on Coinbase compared to Binance.
A positive reading indicates increased accumulation by U.S. investors. The current index value stands at 0.0255 in the green region.
If U.S. investors continue accumulating alongside other market participants, ETH’s price may continue to rise.
Buying volume surge
The Taker Buy Sell Ratio jumped from 0.967 the previous day to a high of 1.084 — a level last seen on the 3rd of January.
When the ratio is above 1, it signals more buying activity in the derivatives market than selling, reinforcing bullish sentiment.
Source: CryptoQuant
Read Ethereum’s [ETH] Price Prediction 2025–2026
With U.S. investors actively purchasing in the spot market and bullish sentiment building in the derivatives market, ETH’s rally appears to be gaining momentum.


clomiphene cycle clomiphene order where to get cheap clomid pill can i buy clomiphene without prescription order clomiphene pills where buy cheap clomiphene pill buy cheap clomiphene pill
Good blog you be undergoing here.. It’s obdurate to assign strong quality script like yours these days. I honestly appreciate individuals like you! Take vigilance!!
The thoroughness in this draft is noteworthy.
buy cheap generic zithromax – tindamax 500mg us metronidazole pills
order rybelsus generic – rybelsus 14mg without prescription periactin 4 mg over the counter
motilium generic – buy flexeril 15mg generic flexeril medication
buy generic clavulanate online – https://atbioinfo.com/ buy ampicillin pills
esomeprazole 40mg for sale – anexa mate brand nexium 40mg
order coumadin 5mg pills – https://coumamide.com/ order hyzaar online
mobic tablet – https://moboxsin.com/ mobic 15mg price
cost deltasone 5mg – adrenal deltasone 20mg pills
cheap ed drugs – site buy ed pills cheap
amoxicillin medication – cheap amoxil amoxicillin canada
generic fluconazole 100mg – https://gpdifluca.com/ fluconazole order online
buy cenforce generic – cenforce rs cost cenforce 100mg
tadalafil tablets 20 mg side effects – where can i buy cialis online cheap cialis dapoxitine cheap online
when will teva’s generic tadalafil be available in pharmacies – https://strongtadafl.com/# cialis and cocaine
order ranitidine 150mg online – on this site generic zantac 300mg
viagra 100mg price per pill – https://strongvpls.com/ sildenafil 100 mg
More posts like this would create the online time more useful. buy azithromycin no prescription
This website really has all of the information and facts I needed there this participant and didn’t know who to ask. gnolvade.com
This is the kind of enter I find helpful. https://prohnrg.com/product/orlistat-pills-di/
Thanks on putting this up. It’s evidently done. https://aranitidine.com/fr/acheter-cialis-5mg/