


![]()
Journalist
Posted:
- Ethereum’s $2,800 surge triggered short liquidations, contrasting with Bitcoin’s stagnant price
- Geopolitical factors and ETF inflows contributed to the growing divergence between Ethereum and Bitcoin
Ethereum’s [ETH] recent surge toward $2,800 has sparked significant attention in the crypto markets, with traders rushing to liquidate short positions.
However, despite Ethereum’s rally, Bitcoin has failed to mirror this momentum, adding volatility to the market.
As a result, a new $2,600 liquidation pool has formed, heightening the unpredictability of the current price action.
ETH’s price surge: Short position liquidations and key levels
ETH’s price surged to nearly $2,800, sparking significant liquidations of short positions. Short interest increased over 40% in a week and more than 500% since November 2024, indicating strong bearish sentiment among traders.
If ETH fails to sustain its upward movement, the $2,600 level will likely serve as a key support zone.
This could lead to further liquidations and consolidation. The high short interest may amplify selling pressure if the price revisits this level.
Ethereum: Divergence with Bitcoin
While ETH surged, Bitcoin’s price remained stagnant, highlighting a divergence between the two assets.
Geopolitical factors, such as the Trump administration’s tariffs, have driven investors toward Bitcoin, perceived as a safe-haven asset.
Ethereum, with its broader use cases, is seen as more vulnerable to regulatory scrutiny. Furthermore, Bitcoin ETFs have seen over $40 billion in institutional investments, compared to Ethereum’s lower inflows.
This has contributed to Bitcoin’s increasing dominance and Ethereum’s shrinking market share.
The aggregated liquidations heatmap
The ETH aggregated liquidations heatmap reveals significant liquidation clusters near $2,800, aligning with Ethereum’s recent surge.
Short positions were quickly liquidated as the price moved upward. On the downside, the $2,600 liquidation pool remains a critical support area to watch.
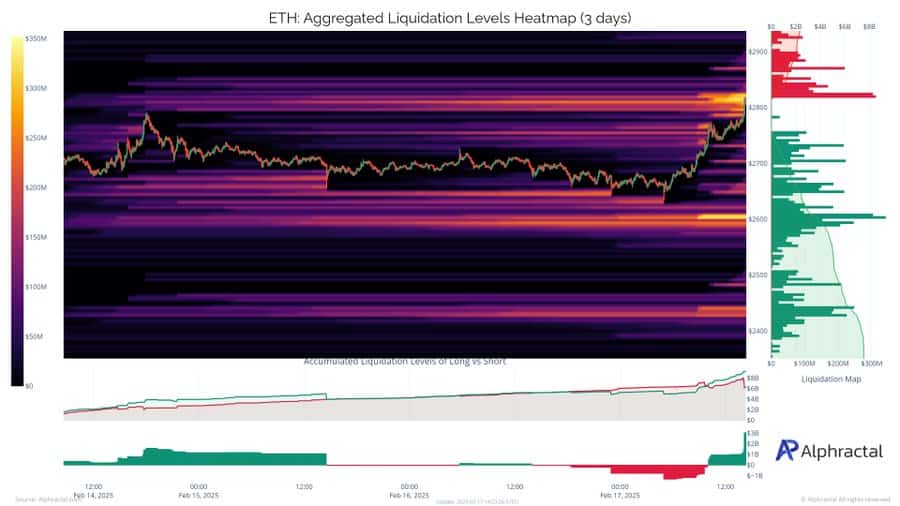
Source: Alphractal
Key technical indicators signal caution
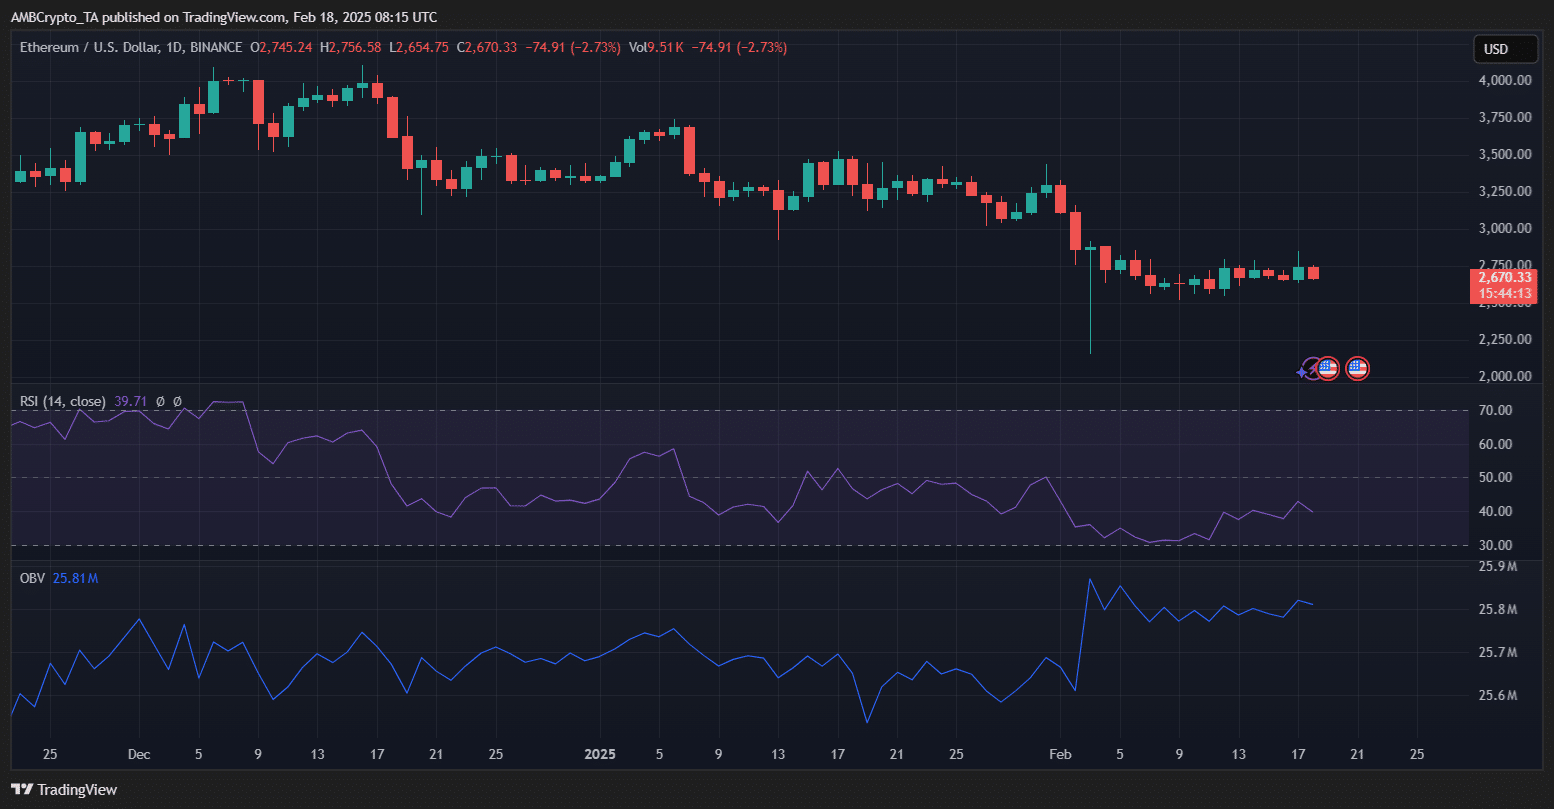
Source: TradingView
Ethereum’s daily price chart shows a bearish bias, with ETH trading at $2,670, after a 2.73% drop, at press time. The RSI stood at 39.71, signaling potential buying interest if the trend persists.
However, the OBV at 25.81 million suggested limited buying momentum, leaving selling pressure in control.
The coin’s consolidation around $2,670 reflects market indecision. A break below this level could bring ETH to test the $2,600 liquidation pool, while a rebound would require a strong volume breach of the $2,800 resistance.
![]()
Journalist
Posted:
- Ethereum’s $2,800 surge triggered short liquidations, contrasting with Bitcoin’s stagnant price
- Geopolitical factors and ETF inflows contributed to the growing divergence between Ethereum and Bitcoin
Ethereum’s [ETH] recent surge toward $2,800 has sparked significant attention in the crypto markets, with traders rushing to liquidate short positions.
However, despite Ethereum’s rally, Bitcoin has failed to mirror this momentum, adding volatility to the market.
As a result, a new $2,600 liquidation pool has formed, heightening the unpredictability of the current price action.
ETH’s price surge: Short position liquidations and key levels
ETH’s price surged to nearly $2,800, sparking significant liquidations of short positions. Short interest increased over 40% in a week and more than 500% since November 2024, indicating strong bearish sentiment among traders.
If ETH fails to sustain its upward movement, the $2,600 level will likely serve as a key support zone.
This could lead to further liquidations and consolidation. The high short interest may amplify selling pressure if the price revisits this level.
Ethereum: Divergence with Bitcoin
While ETH surged, Bitcoin’s price remained stagnant, highlighting a divergence between the two assets.
Geopolitical factors, such as the Trump administration’s tariffs, have driven investors toward Bitcoin, perceived as a safe-haven asset.
Ethereum, with its broader use cases, is seen as more vulnerable to regulatory scrutiny. Furthermore, Bitcoin ETFs have seen over $40 billion in institutional investments, compared to Ethereum’s lower inflows.
This has contributed to Bitcoin’s increasing dominance and Ethereum’s shrinking market share.
The aggregated liquidations heatmap
The ETH aggregated liquidations heatmap reveals significant liquidation clusters near $2,800, aligning with Ethereum’s recent surge.
Short positions were quickly liquidated as the price moved upward. On the downside, the $2,600 liquidation pool remains a critical support area to watch.
Source: Alphractal
Key technical indicators signal caution
Source: TradingView
Ethereum’s daily price chart shows a bearish bias, with ETH trading at $2,670, after a 2.73% drop, at press time. The RSI stood at 39.71, signaling potential buying interest if the trend persists.
However, the OBV at 25.81 million suggested limited buying momentum, leaving selling pressure in control.
The coin’s consolidation around $2,670 reflects market indecision. A break below this level could bring ETH to test the $2,600 liquidation pool, while a rebound would require a strong volume breach of the $2,800 resistance.


can i purchase generic clomid online where buy cheap clomiphene can i get generic clomiphene without rx can i buy generic clomiphene pill how to buy clomid tablets where can i buy cheap clomid no prescription where can i buy cheap clomiphene
The thoroughness in this section is noteworthy.
With thanks. Loads of expertise!
order zithromax generic – order tetracycline for sale buy flagyl online cheap
semaglutide pill – cyproheptadine over the counter buy cyproheptadine tablets
buy generic domperidone for sale – purchase sumycin sale oral flexeril 15mg
buy augmentin 625mg generic – https://atbioinfo.com/ order ampicillin online
order esomeprazole 20mg generic – https://anexamate.com/ where can i buy nexium
coumadin 2mg tablet – https://coumamide.com/ cheap losartan
order meloxicam – https://moboxsin.com/ buy meloxicam online
order deltasone 40mg without prescription – https://apreplson.com/ cost deltasone 5mg
buy ed medications online – https://fastedtotake.com/ non prescription ed drugs
purchase amoxicillin pill – combamoxi amoxil drug
diflucan order online – click purchase forcan
buy escitalopram pills for sale – https://escitapro.com/ order lexapro
buy cenforce online cheap – https://cenforcers.com/# buy cenforce 50mg online cheap
what does cialis treat – https://ciltadgn.com/ cialis online without perscription
no prescription female cialis – https://strongtadafl.com/ cialis leg pain
zantac 150mg for sale – https://aranitidine.com/ buy generic zantac for sale
order viagra in south africa – strong vpls buy viagra hyderabad india
I couldn’t hold back commenting. Warmly written! cialis que es
The reconditeness in this piece is exceptional. https://buyfastonl.com/furosemide.html
More posts like this would make the online space more useful. https://ursxdol.com/ventolin-albuterol/
I’ll certainly return to skim more. https://prohnrg.com/product/atenolol-50-mg-online/
The depth in this ruined is exceptional. https://aranitidine.com/fr/ciagra-professional-20-mg/
The sagacity in this tune is exceptional. https://ondactone.com/spironolactone/
Thanks towards putting this up. It’s understandably done.
https://doxycyclinege.com/pro/tamsulosin/
This is the compassionate of criticism I positively appreciate. https://sportavesti.ru/forums/users/lvkqv-2/
forxiga 10 mg brand – buy dapagliflozin how to get forxiga without a prescription
order orlistat for sale – https://asacostat.com/# purchase xenical pills
This is the kind of post I recoup helpful. http://seafishzone.com/home.php?mod=space&uid=2331054