


Ethereum (ETH), the second-largest cryptocurrency by market capitalization, has recently seen its price fall below the 4-hour Simple Moving Average (SMA). This technical development is noteworthy for traders and investors, as the 4-hour SMA is often used to gauge short-term market momentum.
When a cryptocurrency’s price drops below this moving average, it can signal a potential shift in market sentiment from bullish to bearish. This could imply increased selling pressure and a possible downward trend continuation. The implications of this price movement extend beyond technical analysis, as broader market conditions, investor behavior, and fundamental factors also play a crucial role in shaping Ethereum’s future trajectory.
In this article, we will be exploring ETH’s potential price action with the help of technical indicators.
Ethereum Price Condition On The 4-Hour Chart
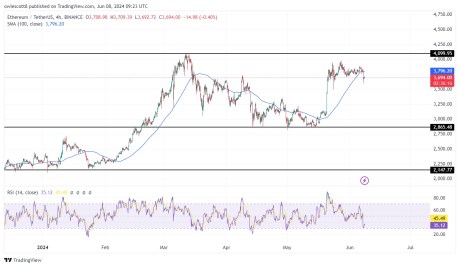
Firstly, it can be observed that ETH’s price in the 4-hour timeframe has experienced a drop below the 100-day SMA after moving in a consolidation manner for a while. It should be noted that most times when an asset drops below SMA, it could indicate a short or long-term move in that direction.

Additionally, the Relative Strength Index (RSI) indicator also confirms that Ethereum might move in the downward direction for a while as the RSI line has crossed below 50% and could trend there for a while.
From the daily chart, it can be noticed that Ethereum is attempting to make a move toward the 100-day SMA after dropping a bearish candlestick on the previous day. At this point, it can be suggested ETH dropped to test the 100-day SMA before making an upward move again.

Finally, the RSI line from the RSI indication is currently dropping out of the overbought zone toward 50% indicating that there is still room for ETH to move downward.
ETH Price Projection
As of right now, Ethereum is attempting to move downward toward the daily SMA, If it drops below, it will continue to move downward toward the $2,865 support level. Furthermore, it can drop even more to test the $2,147 support level if it drops below the aforementioned level.
However, if ETH’s price touches the SMA and bounces back, it will move upward toward the $4,099 resistance level. Also, should it break below this resistance level, it will continue to move up to test the $4,863 level. ETH may move to create a new high if it rises above the $4,863 level.
As of the time of writing, ETH’s price was trading at around $3,694 and was up by 0.41% with a market capitalization of over $443 billion and a 24-hour trading volume of over $18 billion. Its market capitalization is down by 2.97%, while its trading volume is up by 39.28% in the past day.
Featured image from iStock, chart from Tradingview.com
Ethereum (ETH), the second-largest cryptocurrency by market capitalization, has recently seen its price fall below the 4-hour Simple Moving Average (SMA). This technical development is noteworthy for traders and investors, as the 4-hour SMA is often used to gauge short-term market momentum.
When a cryptocurrency’s price drops below this moving average, it can signal a potential shift in market sentiment from bullish to bearish. This could imply increased selling pressure and a possible downward trend continuation. The implications of this price movement extend beyond technical analysis, as broader market conditions, investor behavior, and fundamental factors also play a crucial role in shaping Ethereum’s future trajectory.
In this article, we will be exploring ETH’s potential price action with the help of technical indicators.
Ethereum Price Condition On The 4-Hour Chart
Firstly, it can be observed that ETH’s price in the 4-hour timeframe has experienced a drop below the 100-day SMA after moving in a consolidation manner for a while. It should be noted that most times when an asset drops below SMA, it could indicate a short or long-term move in that direction.
Additionally, the Relative Strength Index (RSI) indicator also confirms that Ethereum might move in the downward direction for a while as the RSI line has crossed below 50% and could trend there for a while.
From the daily chart, it can be noticed that Ethereum is attempting to make a move toward the 100-day SMA after dropping a bearish candlestick on the previous day. At this point, it can be suggested ETH dropped to test the 100-day SMA before making an upward move again.
Finally, the RSI line from the RSI indication is currently dropping out of the overbought zone toward 50% indicating that there is still room for ETH to move downward.
ETH Price Projection
As of right now, Ethereum is attempting to move downward toward the daily SMA, If it drops below, it will continue to move downward toward the $2,865 support level. Furthermore, it can drop even more to test the $2,147 support level if it drops below the aforementioned level.
However, if ETH’s price touches the SMA and bounces back, it will move upward toward the $4,099 resistance level. Also, should it break below this resistance level, it will continue to move up to test the $4,863 level. ETH may move to create a new high if it rises above the $4,863 level.
As of the time of writing, ETH’s price was trading at around $3,694 and was up by 0.41% with a market capitalization of over $443 billion and a 24-hour trading volume of over $18 billion. Its market capitalization is down by 2.97%, while its trading volume is up by 39.28% in the past day.
Featured image from iStock, chart from Tradingview.com


where buy cheap clomid pill can i order generic clomiphene prices cost of clomiphene for men where can i buy clomiphene pill where to buy cheap clomid no prescription says: cost generic clomiphene without rx where to get generic clomiphene pill
This is the type of post I unearth helpful.
Thanks for sharing. It’s first quality.
azithromycin 250mg ca – floxin generic metronidazole cost
buy cheap generic rybelsus – order periactin generic cyproheptadine 4 mg canada
motilium over the counter – flexeril online order cyclobenzaprine 15mg over the counter
buy amoxiclav pills – atbio info buy cheap ampicillin
nexium capsules – anexamate.com order esomeprazole 20mg online
medex price – anticoagulant losartan 50mg cost
buy mobic 7.5mg pills – tenderness order meloxicam online
prednisone 5mg canada – https://apreplson.com/ buy generic deltasone 5mg
ed pills where to buy – ed pills otc best ed pill for diabetics
amoxil brand – https://combamoxi.com/ amoxicillin brand
cenforce 50mg over the counter – cenforce order where to buy cenforce without a prescription
side effects of cialis – https://ciltadgn.com/ cialis dosages
buying cialis without prescription – https://strongtadafl.com/# canadian online pharmacy cialis
buy zantac 300mg for sale – https://aranitidine.com/ order zantac 300mg generic
buy viagra online now – https://strongvpls.com/ red pill like viagra
I am in truth happy to coup d’oeil at this blog posts which consists of tons of worthwhile facts, thanks representing providing such data. https://buyfastonl.com/isotretinoin.html
This is the kind of scribble literary works I rightly appreciate. https://ursxdol.com/furosemide-diuretic/
I couldn’t weather commenting. Warmly written! https://prohnrg.com/product/priligy-dapoxetine-pills/
I’ll certainly return to be familiar with more. https://ondactone.com/spironolactone/
More articles like this would pretence of the blogosphere richer.
buy generic gloperba
The reconditeness in this serving is exceptional. http://iawbs.com/home.php?mod=space&uid=915032
forxiga 10mg pill – cost dapagliflozin dapagliflozin 10mg without prescription
buy orlistat paypal – https://asacostat.com/ order xenical 120mg
I’ll certainly bring to be familiar with more. https://www.forum-joyingauto.com/member.php?action=profile&uid=49445