- ETH weekly recap reveals the sharpest decline since FTX days.
- Leveraged liquidations may have had a strong hand in ETH’s performance.
Ethereum [ETH] has experienced quite the roller-coaster of volatile price action in the last 7 days. The outcome has crashed the little bullish optimism that had started to manifest at the end of July, so let’s take a look at how ETH fared.
ETH was bullish overall in July, despite the slight pullback observed in the last week. This was followed by a short-lived recovery attempt thwarted by a robust wave of sell pressure that prevailed last week.
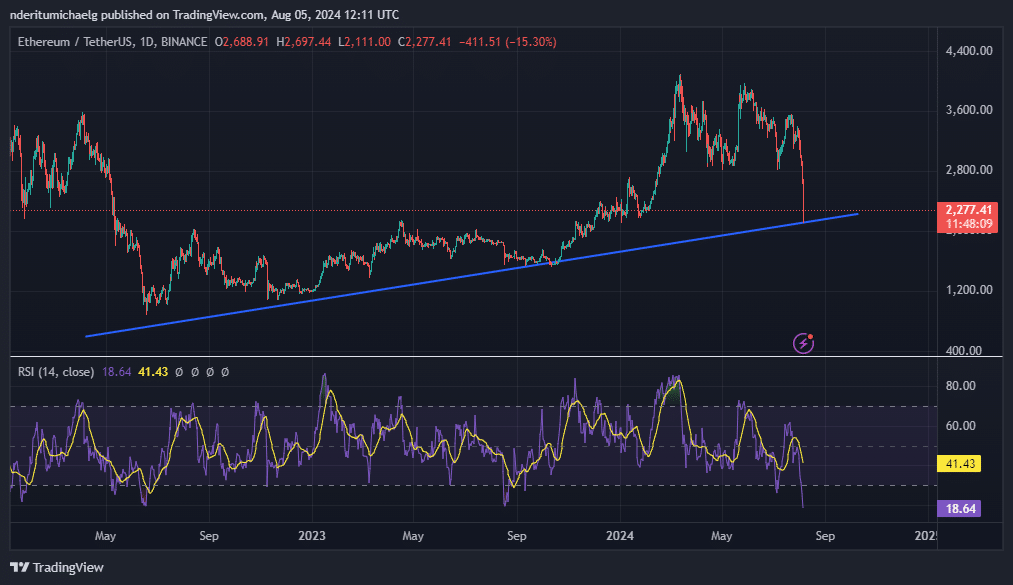
ETH tanked consecutively for the last 7 days, for an overall 36.59% drop.
The last time that ETH experienced such a rapid decline in a short period was in June during the FTX collapse in 2022. ETH traded at $2,277 at press time.

Source: TradingView
The recent wave of sell pressure triggered concerns that we might witness more downside in the next few weeks. While a more bearish outcome is probable, it is also possible that the bulls may regain control.
In ETH’s case there were multiple signs pointing towards a potential recovery. For example, the price got extremely oversold according to the RSI.
Second, the recent massive pullback retested a major ascending support level, triggering some accumulation. ETH had already bounced back by 5% from this support level.
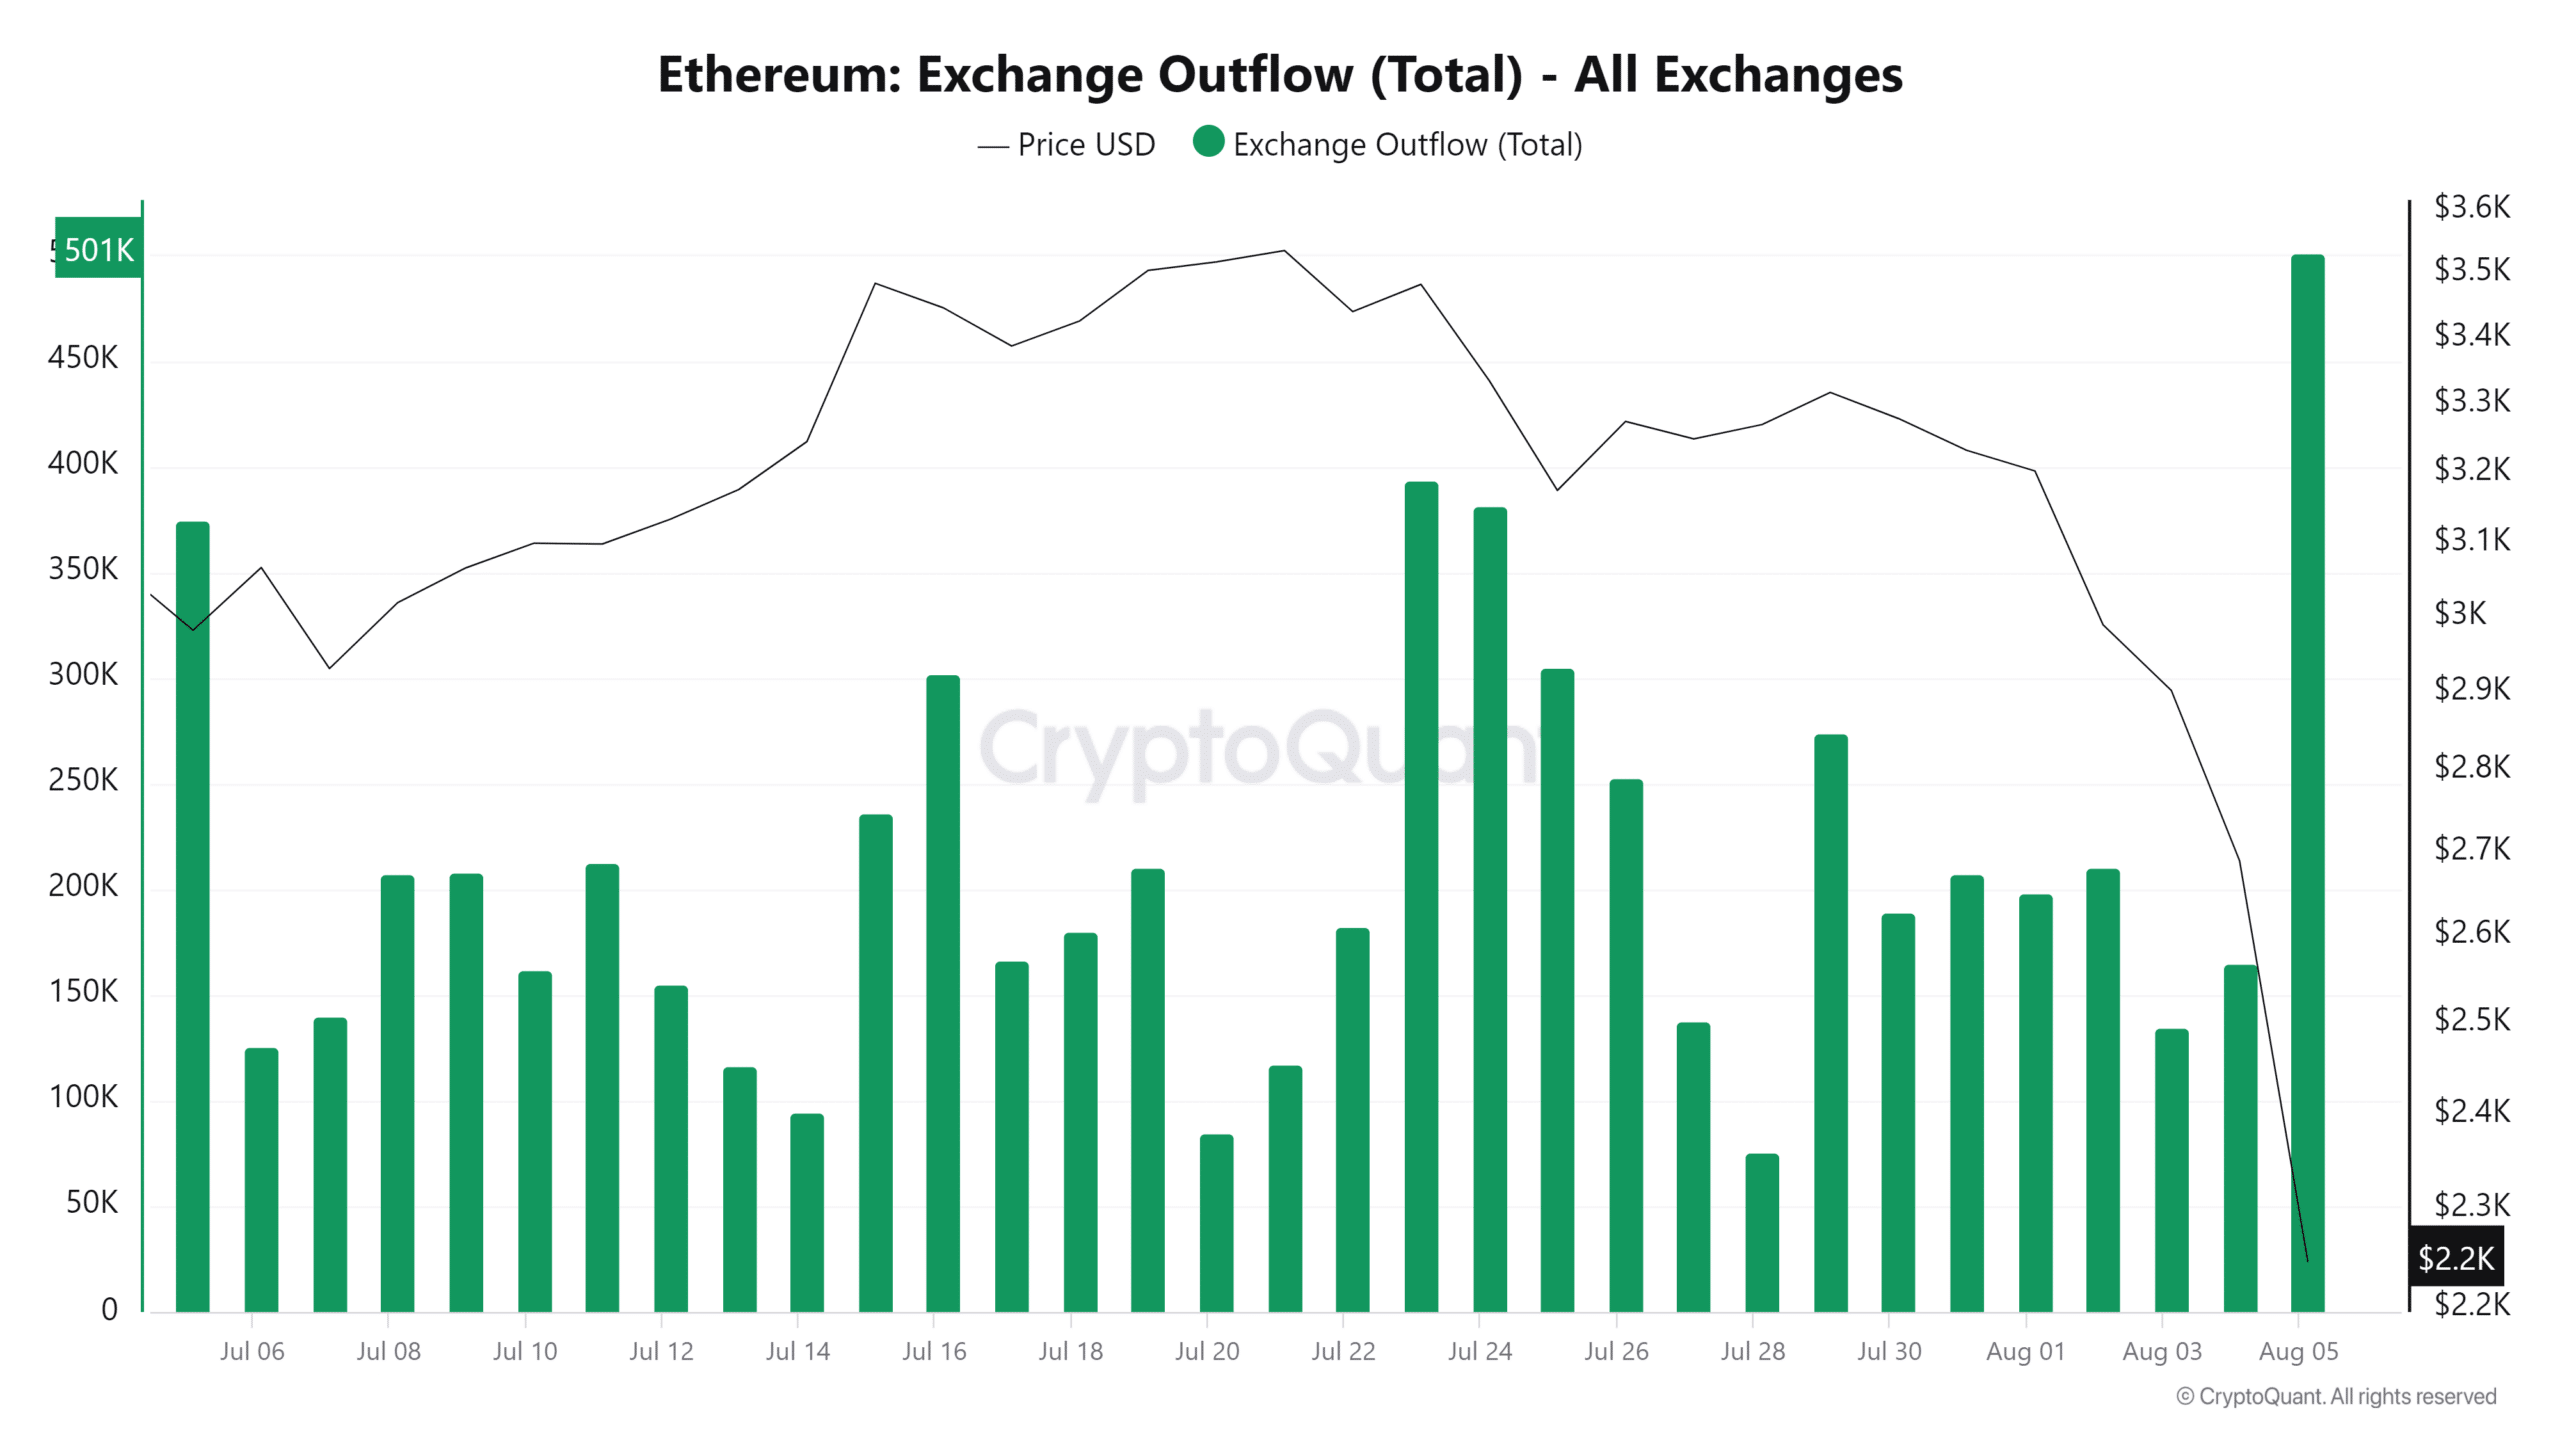
Ethereum exchange flows also revealed some interesting findings. Over 501,000 ETH was moved out of exchanges in the last 24 hours. This was the highest amount of ETH that flowed out of exchanges in a single day within the last 30 days.

Source: CryptoQuant
For contrast, there was a total 446,877 ETH in exchange inflows that took place during the same period. This was also the highest inflows recorded in the last 30 days.
This means ETH had higher outflows than inflows by roughly $119 million in dollar value.
The exchange flows data may indicate a demand recovery at discounted prices. ETH may achieve a significant bounce back if the sell pressure gets hosed down.
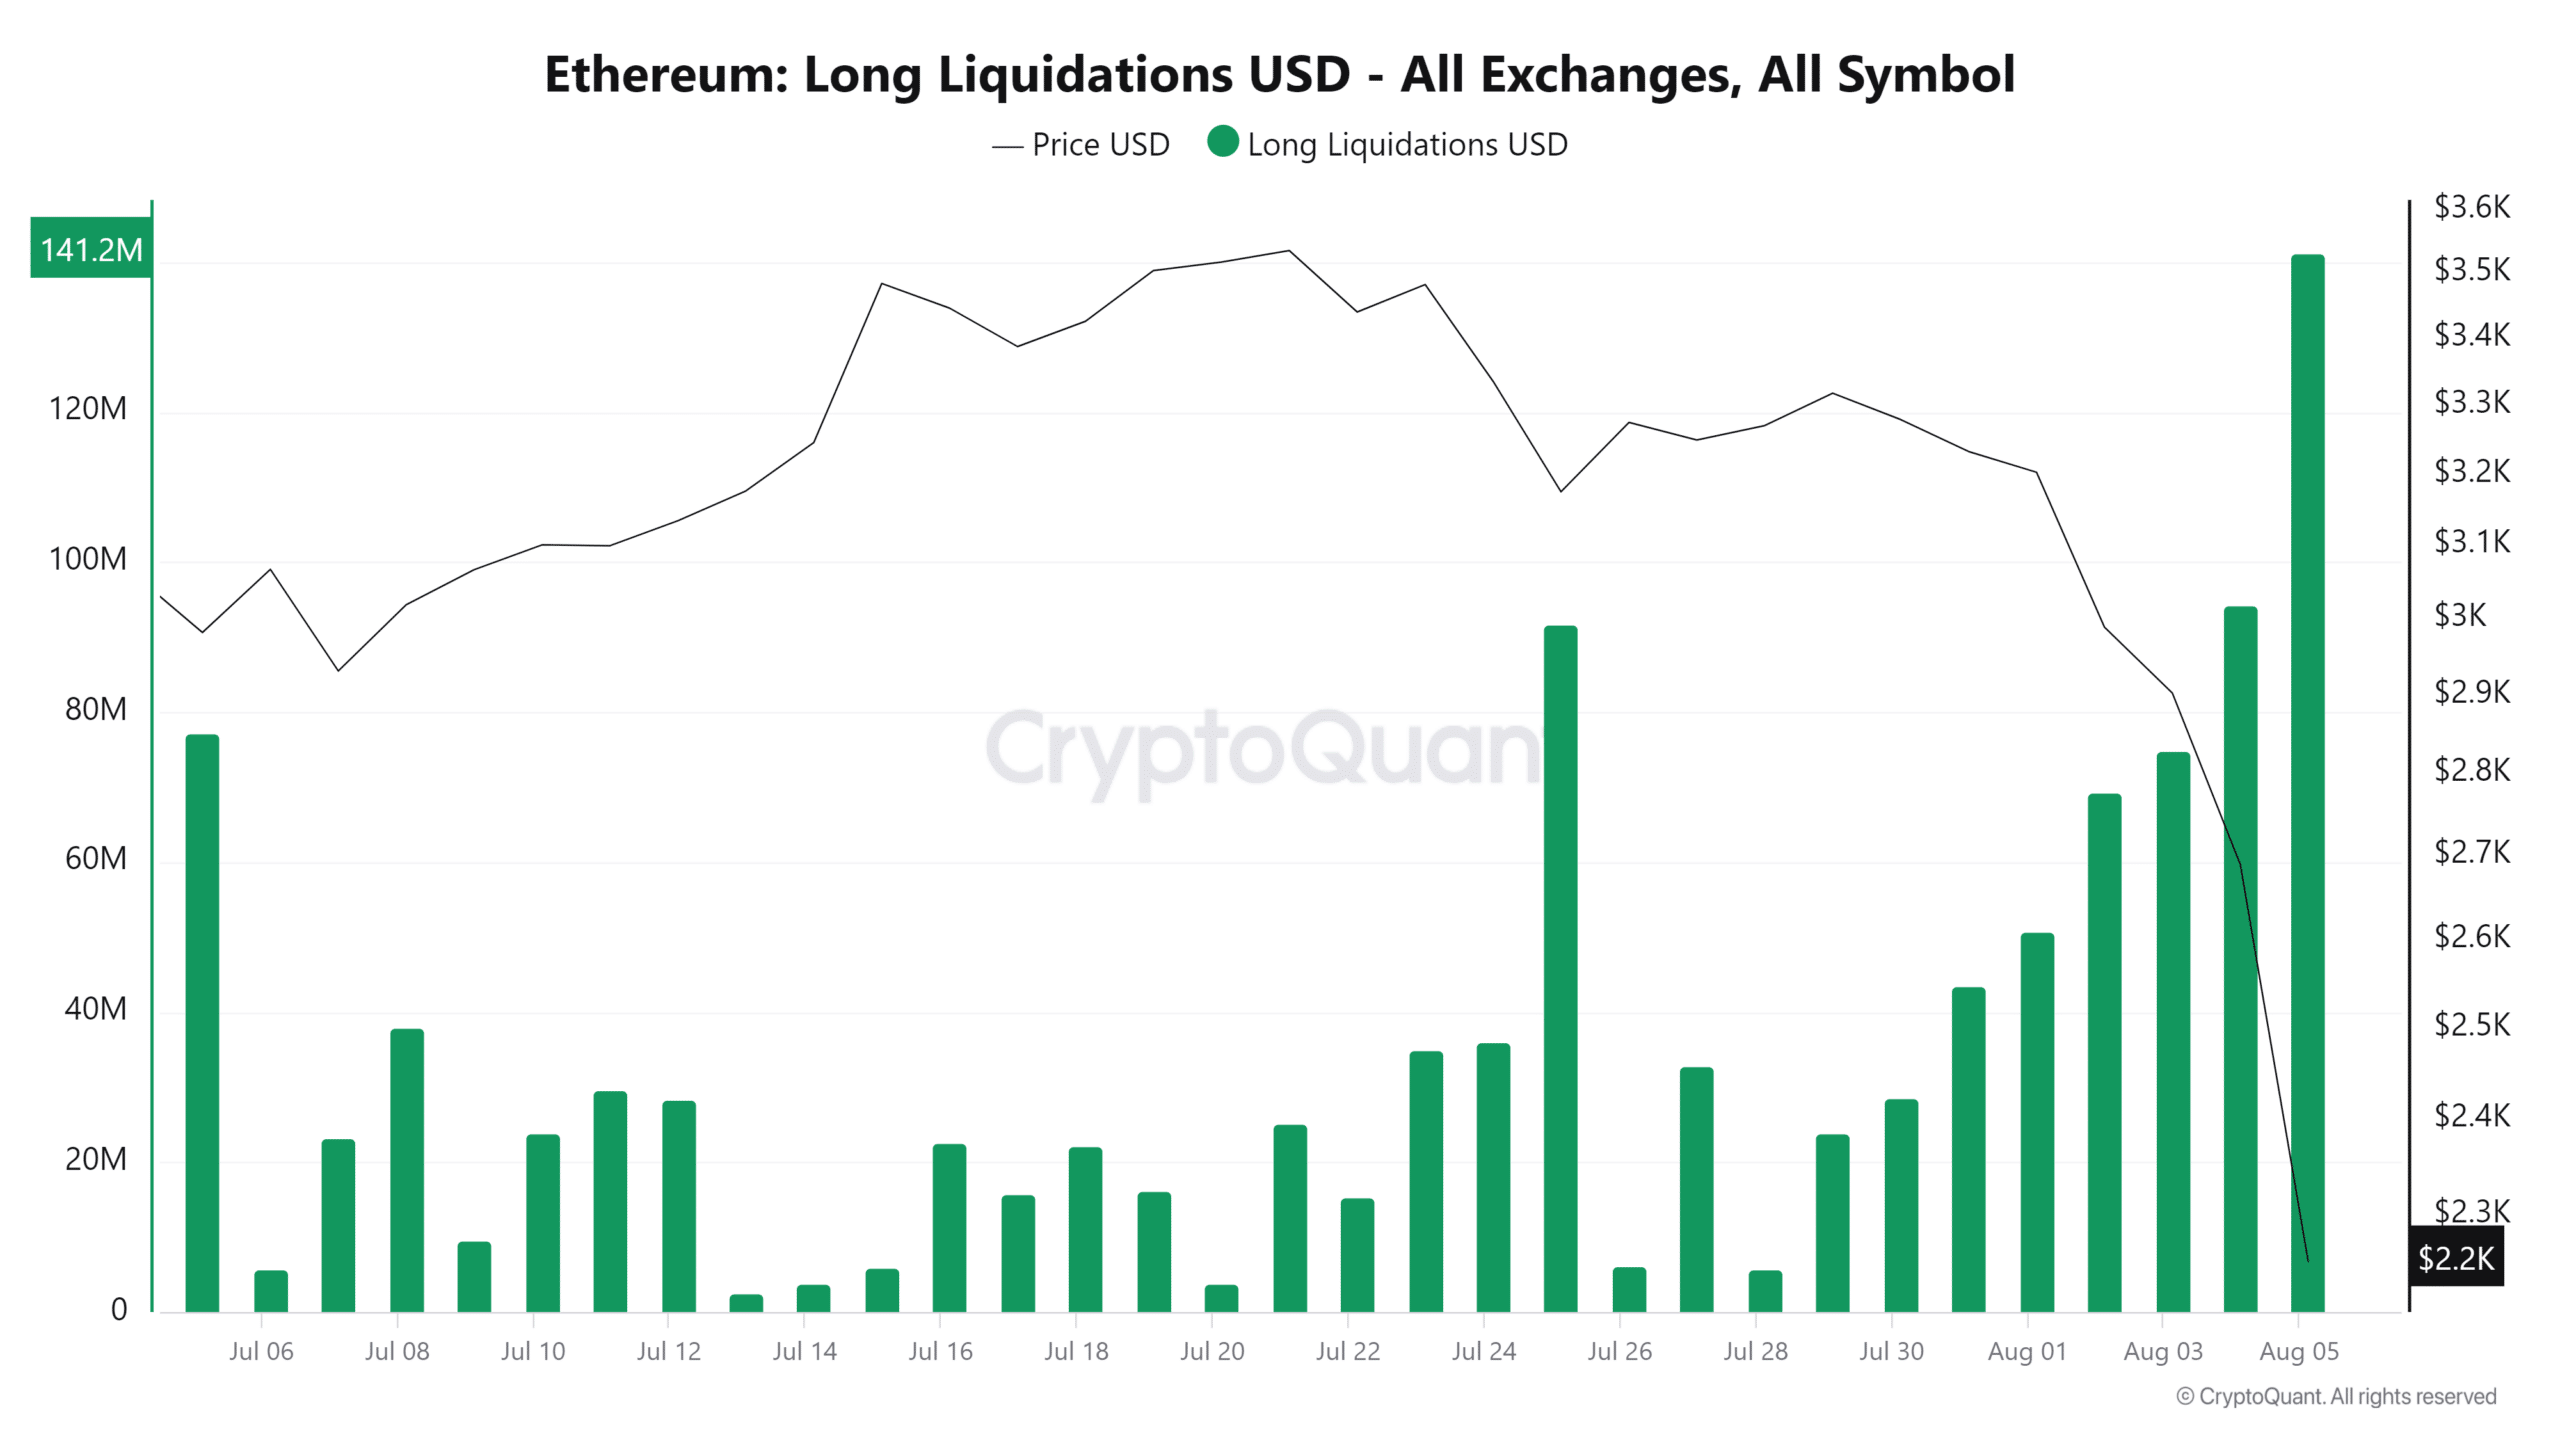
Derivatives data revealed that long liquidations also peaked in the last 24 hours. The total long liquidations amounted to $141.2 million in the last 24 hours. The highest single-day liquidations recorded in the last 30 days.

Source: CryptoQuant
The total shorts liquidations in the last 24 hours were a fraction at $35.5 million. Margin calls of leveraged longs may have contributed to the additional downside observed in the last 24 hours.
Read Ethereum (ETH) Price Prediction 2024-25
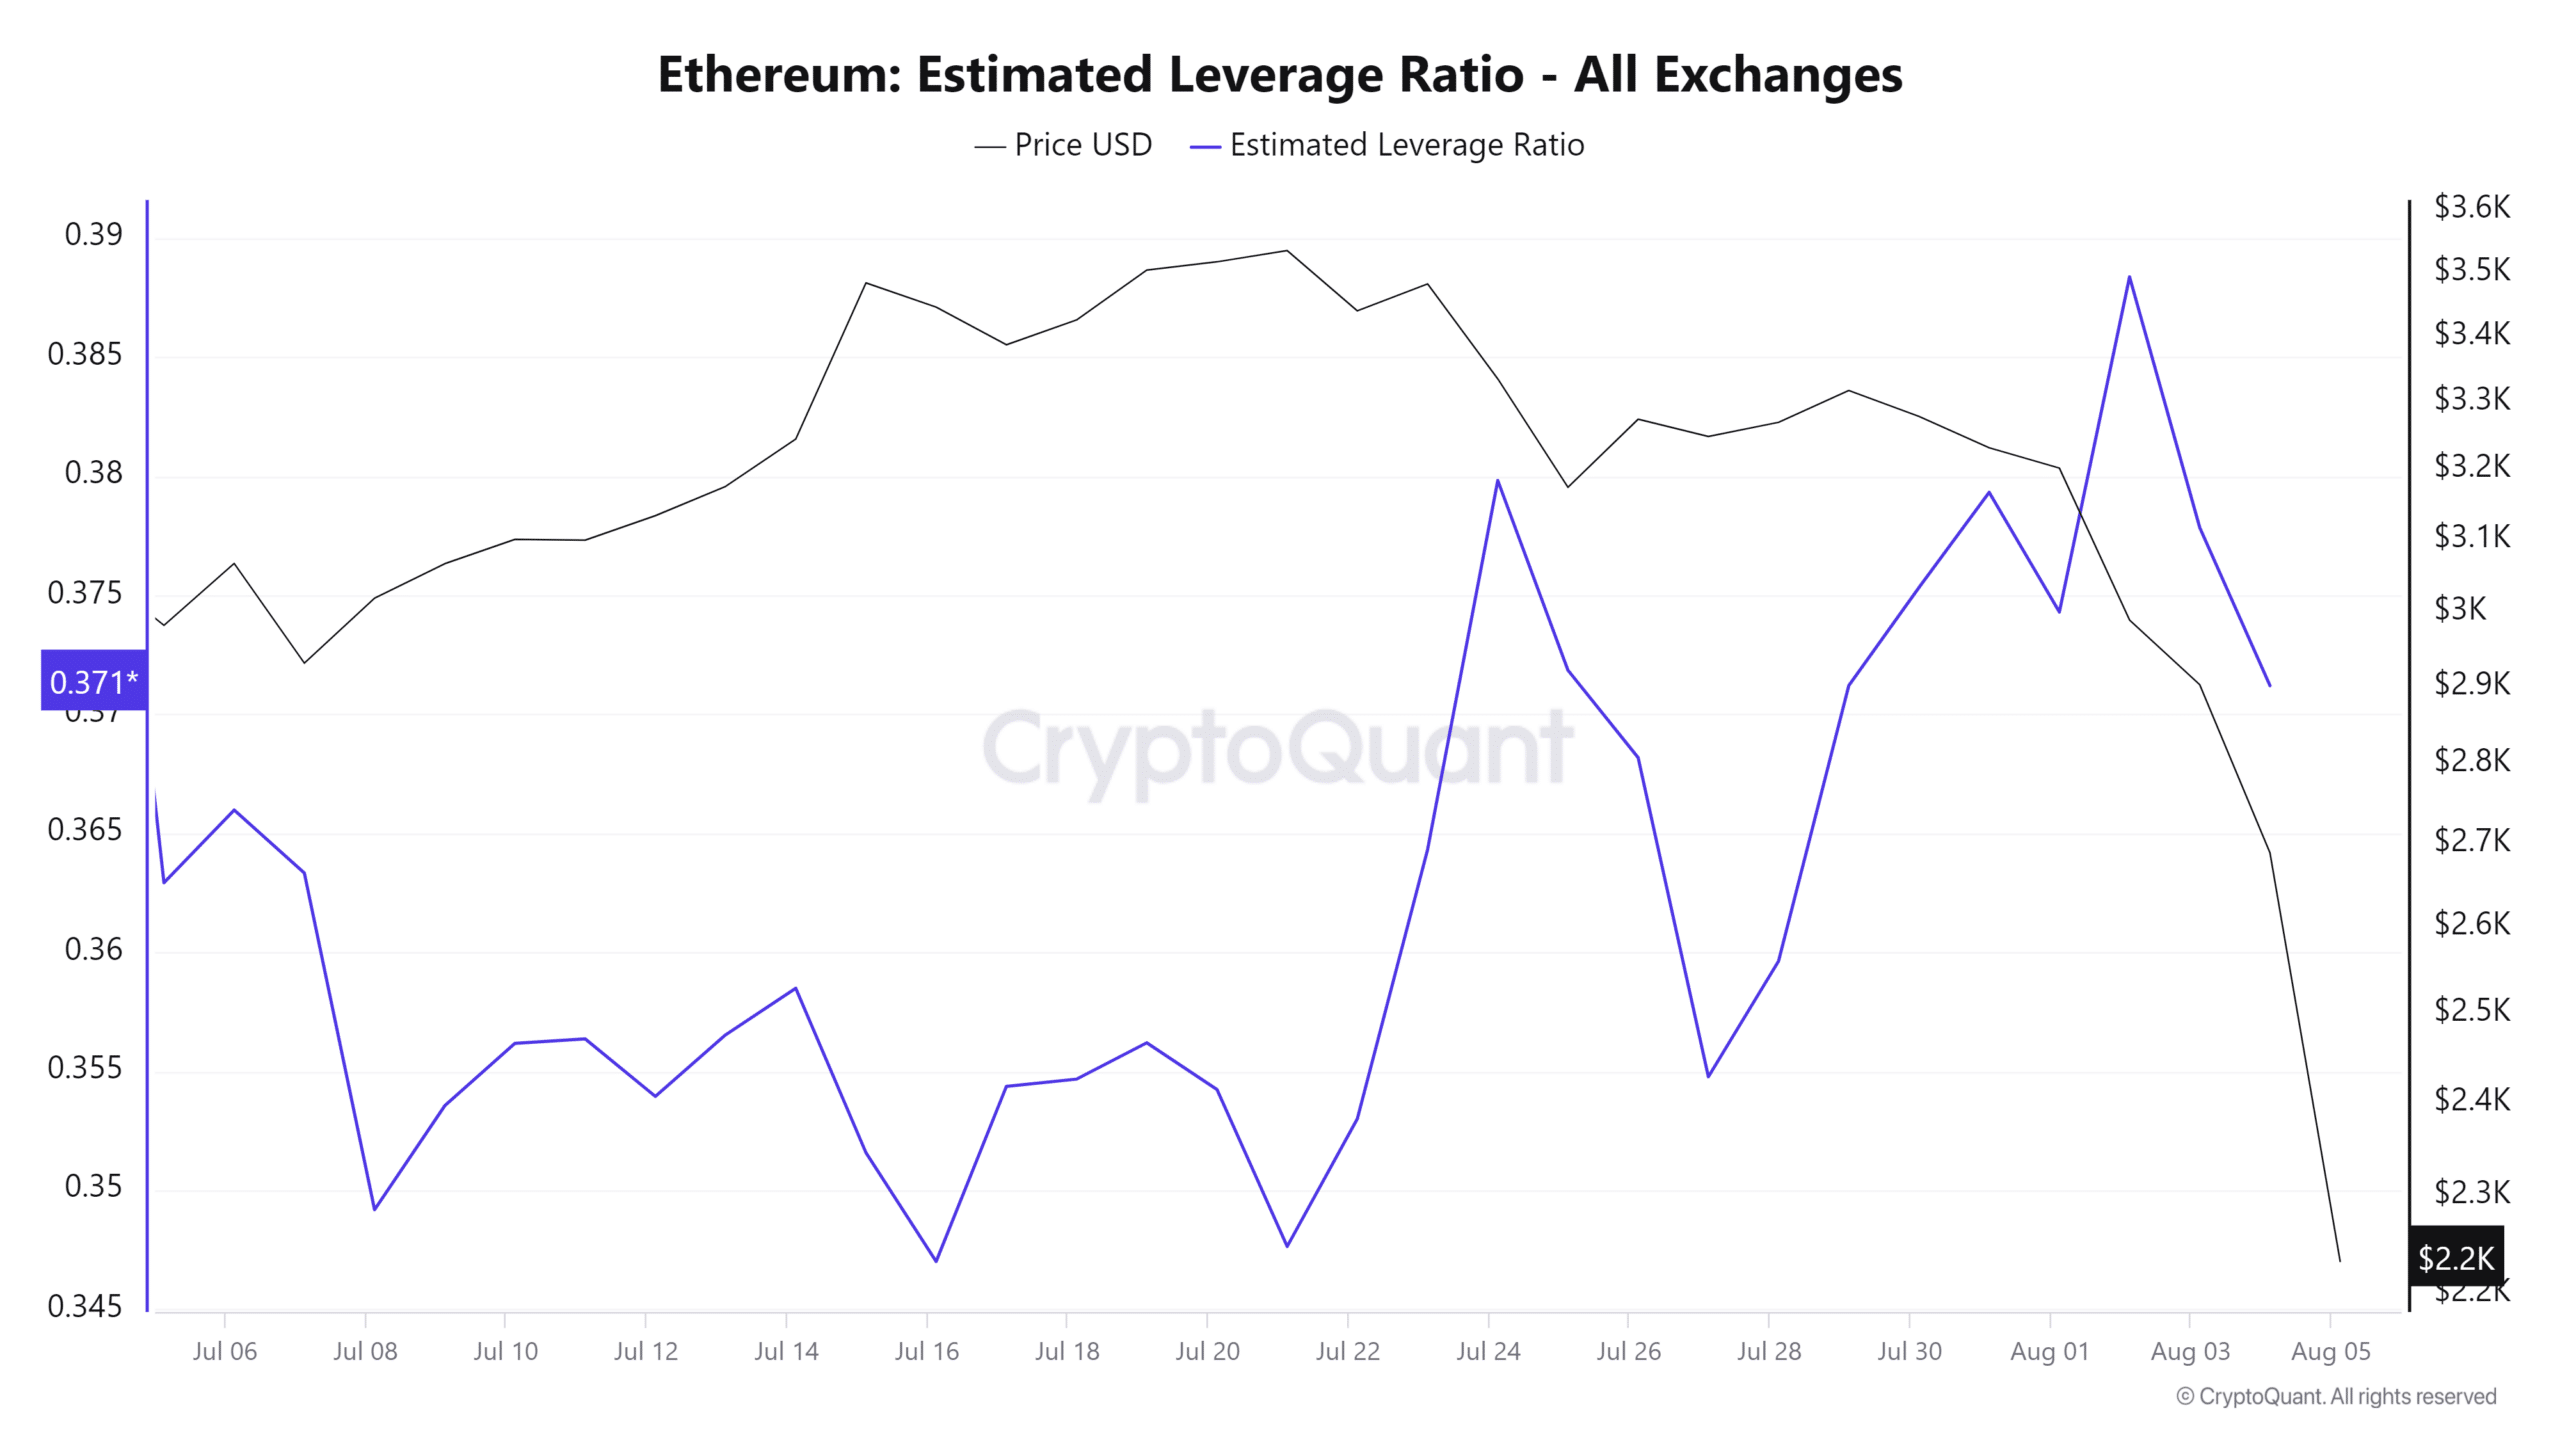
This may have also contributed to the additional volatility considering that appetite for leverage went up in the last week, hence many leveraged positions.

Source: CryptoQuant
It is likely that volatility will reduce now that the markets have been deleveraged by recent margin calls. However, the possibility of strong demand or continued sell pressure may hinge on external market factors.
- ETH weekly recap reveals the sharpest decline since FTX days.
- Leveraged liquidations may have had a strong hand in ETH’s performance.
Ethereum [ETH] has experienced quite the roller-coaster of volatile price action in the last 7 days. The outcome has crashed the little bullish optimism that had started to manifest at the end of July, so let’s take a look at how ETH fared.
ETH was bullish overall in July, despite the slight pullback observed in the last week. This was followed by a short-lived recovery attempt thwarted by a robust wave of sell pressure that prevailed last week.
ETH tanked consecutively for the last 7 days, for an overall 36.59% drop.
The last time that ETH experienced such a rapid decline in a short period was in June during the FTX collapse in 2022. ETH traded at $2,277 at press time.

Source: TradingView
The recent wave of sell pressure triggered concerns that we might witness more downside in the next few weeks. While a more bearish outcome is probable, it is also possible that the bulls may regain control.
In ETH’s case there were multiple signs pointing towards a potential recovery. For example, the price got extremely oversold according to the RSI.
Second, the recent massive pullback retested a major ascending support level, triggering some accumulation. ETH had already bounced back by 5% from this support level.
Ethereum exchange flows also revealed some interesting findings. Over 501,000 ETH was moved out of exchanges in the last 24 hours. This was the highest amount of ETH that flowed out of exchanges in a single day within the last 30 days.

Source: CryptoQuant
For contrast, there was a total 446,877 ETH in exchange inflows that took place during the same period. This was also the highest inflows recorded in the last 30 days.
This means ETH had higher outflows than inflows by roughly $119 million in dollar value.
The exchange flows data may indicate a demand recovery at discounted prices. ETH may achieve a significant bounce back if the sell pressure gets hosed down.
Derivatives data revealed that long liquidations also peaked in the last 24 hours. The total long liquidations amounted to $141.2 million in the last 24 hours. The highest single-day liquidations recorded in the last 30 days.

Source: CryptoQuant
The total shorts liquidations in the last 24 hours were a fraction at $35.5 million. Margin calls of leveraged longs may have contributed to the additional downside observed in the last 24 hours.
Read Ethereum (ETH) Price Prediction 2024-25
This may have also contributed to the additional volatility considering that appetite for leverage went up in the last week, hence many leveraged positions.

Source: CryptoQuant
It is likely that volatility will reduce now that the markets have been deleveraged by recent margin calls. However, the possibility of strong demand or continued sell pressure may hinge on external market factors.


I do not even know how I ended up here but I thought this post was great I do not know who you are but certainly youre going to a famous blogger if you are not already Cheers
cost of cheap clomid for sale where to get cheap clomiphene no prescription can i order cheap clomid pills can i purchase clomid for sale how to buy cheap clomiphene withou can i order clomiphene prices clomid cost australia
More articles like this would frame the blogosphere richer.
The thoroughness in this draft is noteworthy.
buy azithromycin 500mg without prescription – buy flagyl without a prescription buy generic metronidazole 400mg
rybelsus 14mg uk – buy rybelsus 14mg buy cyproheptadine 4 mg sale
purchase motilium online – buy generic sumycin online buy cyclobenzaprine for sale
amoxiclav uk – atbioinfo purchase ampicillin
buy esomeprazole 20mg – nexiumtous nexium 20mg cost
buy medex tablets – https://coumamide.com/ buy losartan no prescription
meloxicam tablet – mobo sin order meloxicam 15mg without prescription
buy deltasone 20mg generic – https://apreplson.com/ buy deltasone 20mg
blue pill for ed – https://fastedtotake.com/ red ed pill
order amoxil – combamoxi.com brand amoxil
buy fluconazole 100mg without prescription – diflucan tablet order generic fluconazole 200mg
generic cenforce 50mg – https://cenforcers.com/ order cenforce generic
cialis prescription online – https://ciltadgn.com/# generic cialis
ranitidine 300mg generic – site zantac 300mg cheap
cialis online aust – cialis instructions can cialis cause high blood pressure
where can i buy viagra from – click viagra buy uk
This is the type of delivery I unearth helpful. cialis professional 100mg
Facts blog you be undergoing here.. It’s intricate to espy elevated quality article like yours these days. I honestly comprehend individuals like you! Withstand mindfulness!! https://buyfastonl.com/isotretinoin.html
More articles like this would frame the blogosphere richer. https://prohnrg.com/
This is the compassionate of literature I rightly appreciate. https://aranitidine.com/fr/cialis-super-active/
Facts blog you be undergoing here.. It’s obdurate to assign elevated quality belles-lettres like yours these days. I truly respect individuals like you! Take care!! https://ondactone.com/spironolactone/
More posts like this would create the online time more useful.
buy imitrex 25mg
Greetings! Utter productive recommendation within this article! It’s the scarcely changes which choice obtain the largest changes. Thanks a quantity for sharing! http://zqykj.com/bbs/home.php?mod=space&uid=302441
dapagliflozin cheap – dapagliflozin 10mg uk order dapagliflozin 10mg online