- ETH has formed an inverse head-and-shoulders pattern, often seen as a bullish indicator that could drive gains.
- Liquidity inflows and a gradual reduction in exchange supply have increased the likelihood of an ETH rally.
After weeks of market declines—including an 8.87% drop over the last seven days—Ethereum [ETH] has begun to recover. The asset posted a 2.41% gain in the past 24 hours, reflecting renewed interest from traders.
Analysis by AMBCrypto highlights several market factors suggesting that ETH’s recent uptick could mark the start of a broader upward trend.
ETH shows double bullish signals
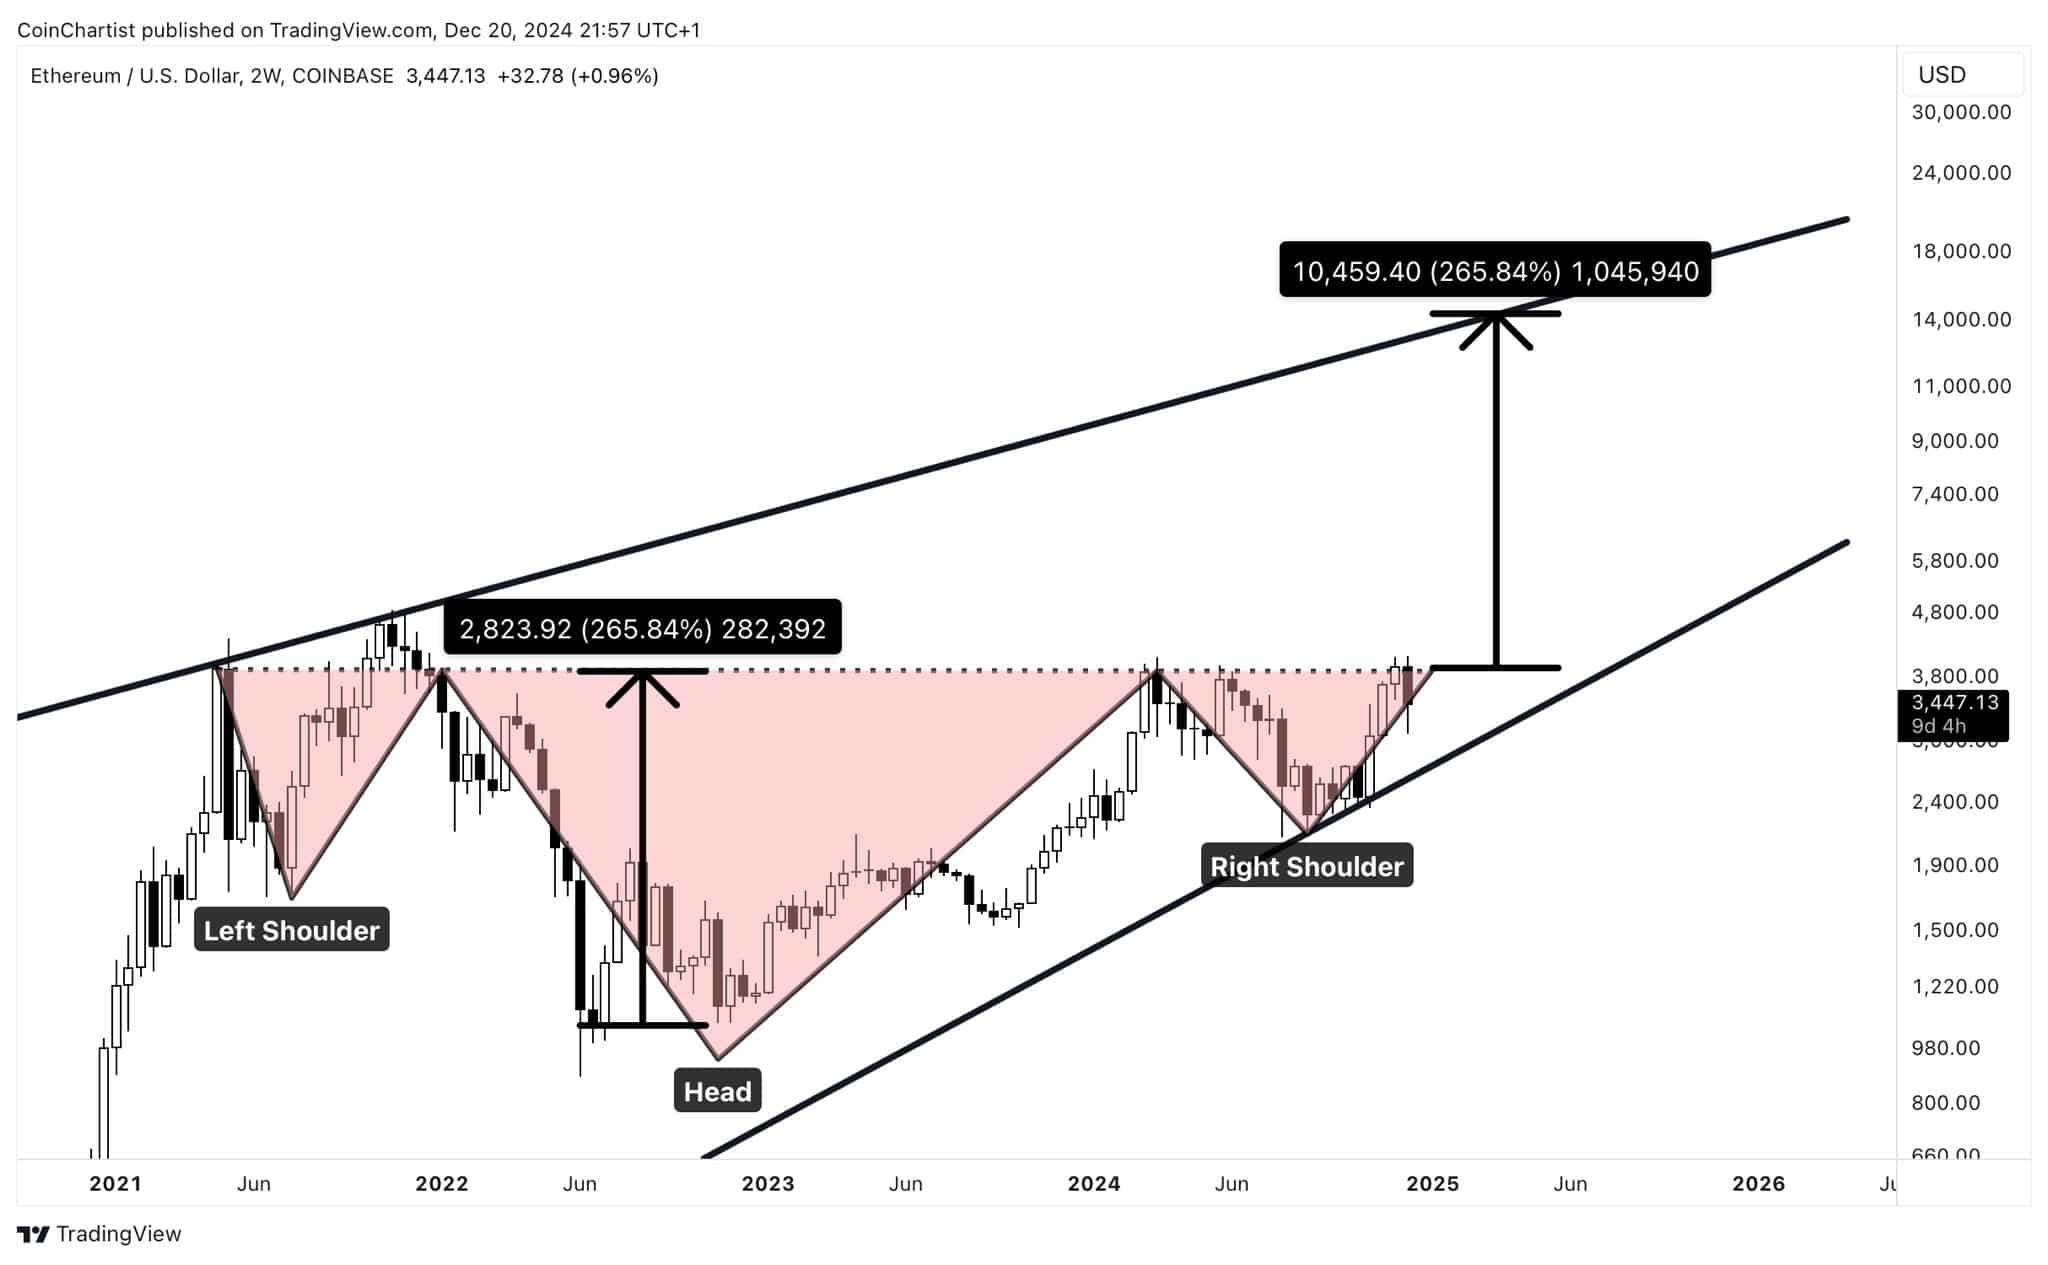
ETH is currently trading within an ascending channel, a pattern associated with upward price movement. Within this structure, the asset has also formed an inverse head-and-shoulders pattern, another bullish indicator.
A breakout above the neckline—a resistance level—of this inverse head-and-shoulders pattern could propel ETH significantly higher.
Based on the distance between the head and neckline, a successful breakout may yield a 265.84% increase, pushing the asset’s price to $12,000.

Source: X
At the time of writing, the bi-weekly chart shows the recent downturn in the market was caused by a rejection at the neckline. However, the daily chart suggests this setback might be reversed, as ETH shows signs of recovery through recent gains.
Rising liquidity flow into ETH
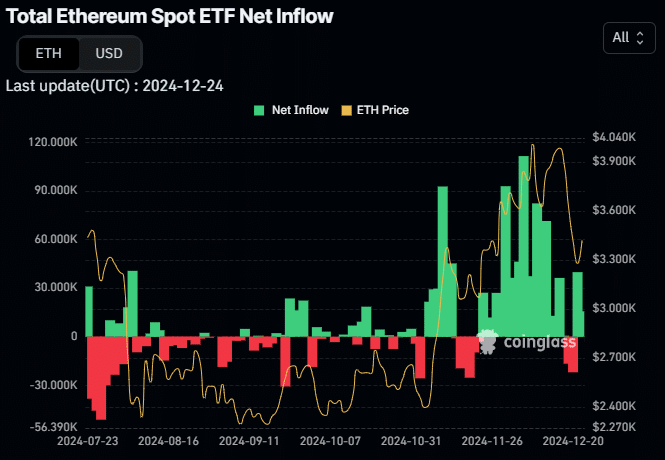
Demand for ETH from institutional and traditional investors has surged over the past two days. This increase comes after a period of sustained selling activity among these market participants.
Data from ETH spot Exchange-Traded Funds (ETFs) reveals that traditional investors purchased $54.54 million worth of ETH in the last two days, contributing to the asset’s recent daily gains.

Source: Coinglass
Additionally, following last week’s record-breaking net outflow of $1.2 billion—the largest exchange withdrawal for ETH since its inception—the trend continues. Since the start of the week, another $35.93 million worth of ETH has been withdrawn from exchanges.
A consistent decline in the amount of ETH available on exchanges, combined with sustained negative exchange netflows, could create a supply squeeze as rising demand meets shrinking availability.

Source: Coinglass
Funding rate on the rise
Long traders in the derivatives market are aligning with the bullish outlook, as multiple buy contracts for ETH have been opened. At the time of writing, the funding rate stands at 0.0089%, indicating a recent shift into positive territory.
Read Ethereum’s [ETH] Price Prediction 2024-25
A positive funding rate, as seen with ETH, suggests that buyers (longs) are dominant and are paying periodic fees to maintain equilibrium between the spot and futures prices.
If this positive trend persists, it could support ETH in breaching the current neckline resistance. This could pave the way for a sustained rally and potentially setting a new high near the $12,000 level.
- ETH has formed an inverse head-and-shoulders pattern, often seen as a bullish indicator that could drive gains.
- Liquidity inflows and a gradual reduction in exchange supply have increased the likelihood of an ETH rally.
After weeks of market declines—including an 8.87% drop over the last seven days—Ethereum [ETH] has begun to recover. The asset posted a 2.41% gain in the past 24 hours, reflecting renewed interest from traders.
Analysis by AMBCrypto highlights several market factors suggesting that ETH’s recent uptick could mark the start of a broader upward trend.
ETH shows double bullish signals
ETH is currently trading within an ascending channel, a pattern associated with upward price movement. Within this structure, the asset has also formed an inverse head-and-shoulders pattern, another bullish indicator.
A breakout above the neckline—a resistance level—of this inverse head-and-shoulders pattern could propel ETH significantly higher.
Based on the distance between the head and neckline, a successful breakout may yield a 265.84% increase, pushing the asset’s price to $12,000.

Source: X
At the time of writing, the bi-weekly chart shows the recent downturn in the market was caused by a rejection at the neckline. However, the daily chart suggests this setback might be reversed, as ETH shows signs of recovery through recent gains.
Rising liquidity flow into ETH
Demand for ETH from institutional and traditional investors has surged over the past two days. This increase comes after a period of sustained selling activity among these market participants.
Data from ETH spot Exchange-Traded Funds (ETFs) reveals that traditional investors purchased $54.54 million worth of ETH in the last two days, contributing to the asset’s recent daily gains.

Source: Coinglass
Additionally, following last week’s record-breaking net outflow of $1.2 billion—the largest exchange withdrawal for ETH since its inception—the trend continues. Since the start of the week, another $35.93 million worth of ETH has been withdrawn from exchanges.
A consistent decline in the amount of ETH available on exchanges, combined with sustained negative exchange netflows, could create a supply squeeze as rising demand meets shrinking availability.

Source: Coinglass
Funding rate on the rise
Long traders in the derivatives market are aligning with the bullish outlook, as multiple buy contracts for ETH have been opened. At the time of writing, the funding rate stands at 0.0089%, indicating a recent shift into positive territory.
Read Ethereum’s [ETH] Price Prediction 2024-25
A positive funding rate, as seen with ETH, suggests that buyers (longs) are dominant and are paying periodic fees to maintain equilibrium between the spot and futures prices.
If this positive trend persists, it could support ETH in breaching the current neckline resistance. This could pave the way for a sustained rally and potentially setting a new high near the $12,000 level.


where buy clomiphene without prescription can i purchase clomid without insurance cost of generic clomiphene online clomiphene chart where to get cheap clomid pill can i buy clomid where can i get generic clomid pill
This is the big-hearted of literature I rightly appreciate.
The reconditeness in this ruined is exceptional.
purchase zithromax online – zithromax generic buy metronidazole 200mg online cheap
order motilium generic – domperidone order flexeril online order
buy amoxil no prescription – purchase amoxicillin online cheap combivent where to buy
amoxiclav ca – https://atbioinfo.com/ buy acillin generic
esomeprazole price – anexamate buy nexium 20mg generic
buy medex generic – https://coumamide.com/ buy cozaar 25mg pills
mobic 15mg usa – swelling meloxicam for sale online
buy deltasone 20mg generic – corticosteroid deltasone 5mg brand
pills for ed – where can i buy ed pills non prescription ed pills
cheap amoxil pills – comba moxi amoxicillin price
fluconazole tablet – this forcan usa
cenforce 50mg uk – https://cenforcers.com/ cenforce 100mg canada
cialis medicine – https://ciltadgn.com/ cialis 5mg cost per pill
order zantac pill – online oral ranitidine
tadalafil cialis – strong tadafl combitic global caplet pvt ltd tadalafil
This is the amicable of glad I have reading. comprar propecia por internet
sildenafil tabletas 100 mg – https://strongvpls.com/# order viagra from uk
Thanks an eye to sharing. It’s outstrip quality. vardenafil over the counter
More posts like this would make the blogosphere more useful. https://buyfastonl.com/isotretinoin.html
More posts like this would prosper the blogosphere more useful. https://prohnrg.com/product/loratadine-10-mg-tablets/
This is the make of delivery I recoup helpful. fildena avaler fondre
I’ll certainly return to be familiar with more. https://ondactone.com/spironolactone/
More posts like this would make the online play more useful.
buy propranolol for sale
I am actually delighted to glitter at this blog posts which consists of tons of worthwhile facts, thanks towards providing such data. http://anja.pf-control.de/Musik-Wellness/member.php?action=profile&uid=4712
buy generic dapagliflozin – dapagliflozin 10 mg without prescription order generic forxiga