


- Ethereum’s accumulation zones signal investor confidence despite recent market volatility.
- Key price levels at $2,632 and $3,149 could define ETH’s next major price movement.
Ethereum [ETH] has experienced price turbulence recently, leaving market watchers uncertain about what lies ahead. However, a key indicator points to steady, even bullish sentiment among investors.
The ETH cost basis distribution reveals a notable trend of accumulation at lower price levels, particularly around $2,632 and $3,149.
These zones are creating a solid support structure, especially at the $2,632 mark, which could signal the beginning of price stabilization after recent downturns.
The question now is: How will this support hold up against broader market dynamics?
What the data shows
The Cost Basis Distribution (CBD) tracks the price levels at which investors acquired their ETH holdings, offering insights into market sentiment and accumulation trends.
A downward shift in cost bases suggests that investors have been buying into dips, reinforcing key price levels.
Recent Glassnode data shows multiple cost bases moving lower, indicating steady accumulation despite price volatility.
This suggests that investors view ETH’s recent decline as a buying opportunity rather than a reason to exit. If this trend continues, it could support price stabilization.
Accumulation zones
Ethereum’s accumulation zones highlighted key price levels where investors actively built positions. The strongest support zone was at $2,632, where 786.66K ETH has been accumulated.
This level represented a potential floor, as past trends showed buyers stepping in aggressively around this price.
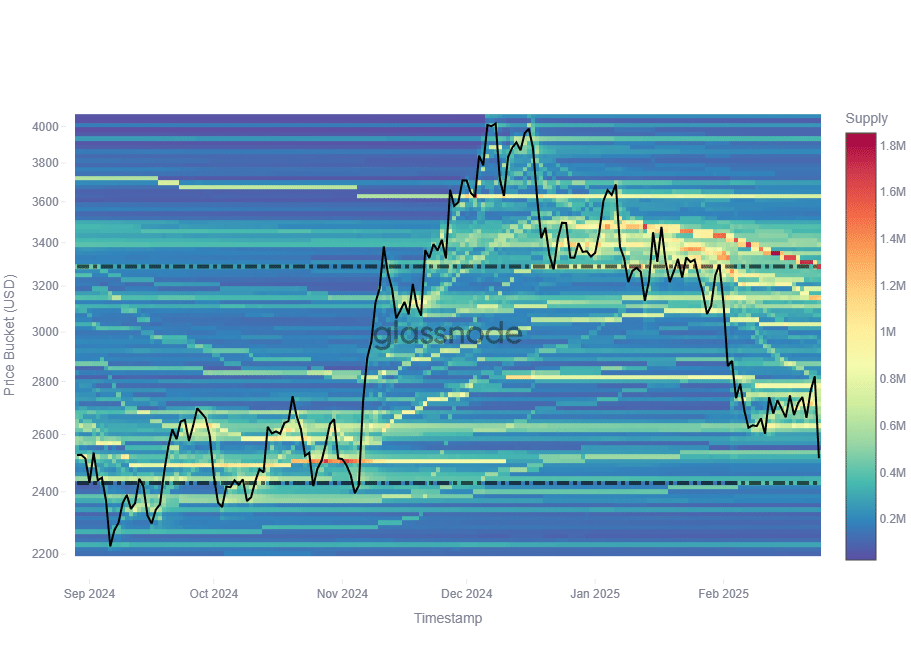
Source: Glassnode
On the flip side, resistance looms at $3,149, with 1.22M ETH accumulated. If ETH rallies, this zone could act as a barrier, triggering sell-offs as investors take profit.
Historically, strong accumulation levels have dictated market swings, making these zones critical in assessing ETH’s next move.
Why this matters for ETH’s future
ETH’s recent price action pointed to a critical moment for its future trajectory. The RSI at 33.30 indicated that ETH was nearing oversold territory, meaning a potential bounce could be on the horizon.
However, it hasn’t yet reached extreme lows, suggesting further downside risk remains.

Source: TradingView
The MACD histogram flipping negative reinforces the bearish momentum, with the MACD and signal lines widening apart — typically a sign of continued selling pressure.
ETH’s price breaking below $2,500 is significant, as it threatens to test the $2,632 accumulation zone identified earlier.
If buyers step in at this support, a recovery toward the $3,149 resistance is possible. But failure to hold could trigger a deeper correction, making the next few trading sessions crucial.
- Ethereum’s accumulation zones signal investor confidence despite recent market volatility.
- Key price levels at $2,632 and $3,149 could define ETH’s next major price movement.
Ethereum [ETH] has experienced price turbulence recently, leaving market watchers uncertain about what lies ahead. However, a key indicator points to steady, even bullish sentiment among investors.
The ETH cost basis distribution reveals a notable trend of accumulation at lower price levels, particularly around $2,632 and $3,149.
These zones are creating a solid support structure, especially at the $2,632 mark, which could signal the beginning of price stabilization after recent downturns.
The question now is: How will this support hold up against broader market dynamics?
What the data shows
The Cost Basis Distribution (CBD) tracks the price levels at which investors acquired their ETH holdings, offering insights into market sentiment and accumulation trends.
A downward shift in cost bases suggests that investors have been buying into dips, reinforcing key price levels.
Recent Glassnode data shows multiple cost bases moving lower, indicating steady accumulation despite price volatility.
This suggests that investors view ETH’s recent decline as a buying opportunity rather than a reason to exit. If this trend continues, it could support price stabilization.
Accumulation zones
Ethereum’s accumulation zones highlighted key price levels where investors actively built positions. The strongest support zone was at $2,632, where 786.66K ETH has been accumulated.
This level represented a potential floor, as past trends showed buyers stepping in aggressively around this price.
Source: Glassnode
On the flip side, resistance looms at $3,149, with 1.22M ETH accumulated. If ETH rallies, this zone could act as a barrier, triggering sell-offs as investors take profit.
Historically, strong accumulation levels have dictated market swings, making these zones critical in assessing ETH’s next move.
Why this matters for ETH’s future
ETH’s recent price action pointed to a critical moment for its future trajectory. The RSI at 33.30 indicated that ETH was nearing oversold territory, meaning a potential bounce could be on the horizon.
However, it hasn’t yet reached extreme lows, suggesting further downside risk remains.
Source: TradingView
The MACD histogram flipping negative reinforces the bearish momentum, with the MACD and signal lines widening apart — typically a sign of continued selling pressure.
ETH’s price breaking below $2,500 is significant, as it threatens to test the $2,632 accumulation zone identified earlier.
If buyers step in at this support, a recovery toward the $3,149 resistance is possible. But failure to hold could trigger a deeper correction, making the next few trading sessions crucial.


It’s very easy to find out any topic on net as compared to textbooks, as I found this paragraph at this web site.
I have read so many content regarding the blogger lovers however this piece of writing is genuinely a fastidious article, keep it up.
Greetings! Very helpful advice in this particular post! It is the little changes that produce the most important changes. Thanks a lot for sharing!
I’ve been exploring for a little for any high-quality articles or weblog posts in this sort of house . Exploring in Yahoo I at last stumbled upon this site. Studying this information So i’m happy to express that I’ve a very excellent uncanny feeling I found out just what I needed. I most no doubt will make sure to do not disregard this web site and give it a glance regularly.
Great blog! Do you have any tips and hints for aspiring writers? I’m hoping to start my own site soon but I’m a little lost on everything. Would you suggest starting with a free platform like WordPress or go for a paid option? There are so many options out there that I’m totally confused .. Any ideas? Appreciate it!
What’s up colleagues, its enormous paragraph about cultureand fully defined, keep it up all the time.
I do not know if it’s just me or if perhaps everyone else experiencing problems with your website. It appears as though some of the text on your posts are running off the screen. Can somebody else please comment and let me know if this is happening to them as well? This may be a problem with my web browser because I’ve had this happen before. Cheers
I will immediately grasp your rss as I can not find your e-mail subscription link or e-newsletter service. Do you’ve any? Please permit me realize in order that I may subscribe. Thanks.
Aw, this was an extremely nice post. Spending some time and actual effort to create a great article… but what can I say… I put things off a lot and never seem to get anything done.
Great article. I am facing a few of these issues as well..