


Este artículo también está disponible en español.
Following the market’s recent performance, Ethereum (ETH) attempted to break out of a bullish formation. Some analysts believe the cryptocurrency is preparing to catch up with Bitcoin and aim for March highs.
Related Reading
Ethereum Getting Ready To Challenge BTC
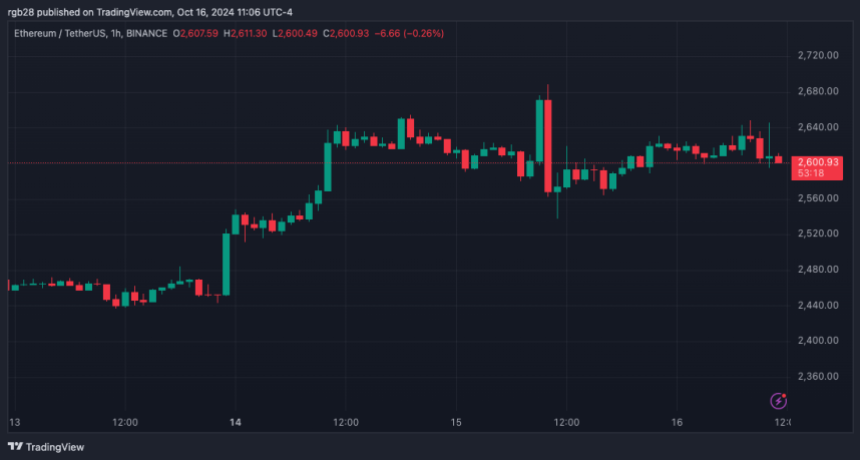
This week, Ethereum has successfully reclaimed the $2,500 support zone following the market’s recent performance. The second-largest cryptocurrency by market capitalization has seen an 8.6% increase in the last seven days, moving from the $2,300-$2,400 range to the $2,600 mark.
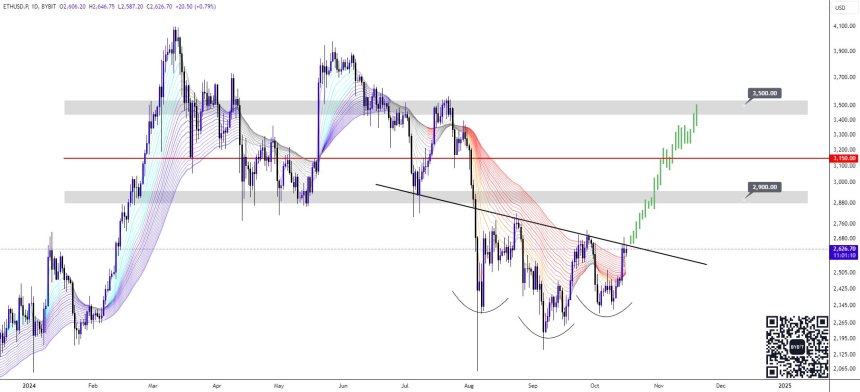
In the last 24 hours, ETH has retested the $2,600 resistance level, currently holding it as support as it attempts to reclaim the $2,700 price range. This zone is the next crucial level, as the cryptocurrency hasn’t successfully broken above it in nearly three months.
Market analyst CryptoWolf pointed out that Ethereum has been rejected from the local top around this level twice since August’s market crash, making it the next big resistance to break.
However, once the zone is cleared, ETH’s price is “heading straight to the 3500s” since the analyst considers that the $3,000 mark “won’t stand a chance.” Similarly, crypto analyst Alex Clay suggested that the King of Altcoins is about to “catch up on BTC” and rise toward $3,500.
To the analyst, Ethereum completed its local accumulation within the $2,100-$2,700 range, and “it’s ready to switch the short-term trend for the bullish.” Other market watchers also suggested that the market is near the bottom after the sideway moves, based on the ETH/BTC chart.
Tony Research stated that the chart “suggests that altcoins are currently cheap relative to Bitcoin. An increase in this chart will positively affect altcoins and their prices.” As the investor pointed out, altcoins could see significant growth during Q1 2025 since Q4s have historically been Bitcoin’s best time to grow.
ETH Attempts Breakout From Bullish Pattern
Analyst Crypto Yapper noted that Ethereum is trying to break from its consolidating formation. The cryptocurrency has been within a three-month symmetrical triangle pattern, and it attempted to break above the upper trendline on Tuesday.
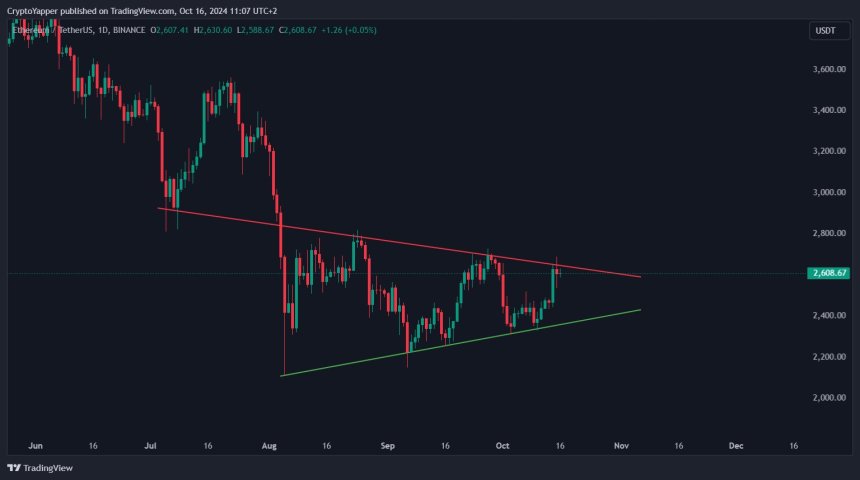
Yesterday, ETH rose momentarily above the trendline after hitting $2,688 but quickly retraced to $2,550. Ethereum tried another breakout from the symmetrical triangle upper trendline on Wednesday, surging above $2,630 before settling around the $2,600 support zone.
Related Reading
To the analyst, Ethereum will target the $2,900 mark next if it breaks out of this formation. Recovering this level could propel ETH’s price to its March highs, as the $2,900-$3,000 price range was a key support zone during the rally’s first leg.
Meanwhile, season trader Peter Brandt recently highlighted an inverted Head and Shoulders (H&S) pattern on ETH’s chart. The trader signaled that an H&S bottom is forming, also suggesting a massive breakout might be imminent.
As of this writing, ETH is trading at $2,612, a 1% increase in the daily timeframe.
Featured Image from Unsplash.com, Chart from TradingView.com
Este artículo también está disponible en español.
Following the market’s recent performance, Ethereum (ETH) attempted to break out of a bullish formation. Some analysts believe the cryptocurrency is preparing to catch up with Bitcoin and aim for March highs.
Related Reading
Ethereum Getting Ready To Challenge BTC
This week, Ethereum has successfully reclaimed the $2,500 support zone following the market’s recent performance. The second-largest cryptocurrency by market capitalization has seen an 8.6% increase in the last seven days, moving from the $2,300-$2,400 range to the $2,600 mark.
In the last 24 hours, ETH has retested the $2,600 resistance level, currently holding it as support as it attempts to reclaim the $2,700 price range. This zone is the next crucial level, as the cryptocurrency hasn’t successfully broken above it in nearly three months.
Market analyst CryptoWolf pointed out that Ethereum has been rejected from the local top around this level twice since August’s market crash, making it the next big resistance to break.
However, once the zone is cleared, ETH’s price is “heading straight to the 3500s” since the analyst considers that the $3,000 mark “won’t stand a chance.” Similarly, crypto analyst Alex Clay suggested that the King of Altcoins is about to “catch up on BTC” and rise toward $3,500.
To the analyst, Ethereum completed its local accumulation within the $2,100-$2,700 range, and “it’s ready to switch the short-term trend for the bullish.” Other market watchers also suggested that the market is near the bottom after the sideway moves, based on the ETH/BTC chart.
Tony Research stated that the chart “suggests that altcoins are currently cheap relative to Bitcoin. An increase in this chart will positively affect altcoins and their prices.” As the investor pointed out, altcoins could see significant growth during Q1 2025 since Q4s have historically been Bitcoin’s best time to grow.
ETH Attempts Breakout From Bullish Pattern
Analyst Crypto Yapper noted that Ethereum is trying to break from its consolidating formation. The cryptocurrency has been within a three-month symmetrical triangle pattern, and it attempted to break above the upper trendline on Tuesday.
Yesterday, ETH rose momentarily above the trendline after hitting $2,688 but quickly retraced to $2,550. Ethereum tried another breakout from the symmetrical triangle upper trendline on Wednesday, surging above $2,630 before settling around the $2,600 support zone.
Related Reading
To the analyst, Ethereum will target the $2,900 mark next if it breaks out of this formation. Recovering this level could propel ETH’s price to its March highs, as the $2,900-$3,000 price range was a key support zone during the rally’s first leg.
Meanwhile, season trader Peter Brandt recently highlighted an inverted Head and Shoulders (H&S) pattern on ETH’s chart. The trader signaled that an H&S bottom is forming, also suggesting a massive breakout might be imminent.
As of this writing, ETH is trading at $2,612, a 1% increase in the daily timeframe.
Featured Image from Unsplash.com, Chart from TradingView.com


how to buy generic clomid tablets how can i get clomiphene without dr prescription cheap clomiphene without a prescription where can i get clomiphene without dr prescription can you get generic clomid online where to get generic clomiphene price buying clomid without dr prescription
This is the amicable of glad I take advantage of reading.
The thoroughness in this piece is noteworthy.
buy azithromycin 500mg pills – buy sumycin 500mg for sale flagyl 400mg drug
purchase rybelsus online cheap – buy cyproheptadine 4mg online cheap purchase cyproheptadine for sale
buy domperidone online – cyclobenzaprine for sale online buy flexeril pills for sale
purchase amoxicillin generic – diovan online order order ipratropium
cheap augmentin – atbioinfo buy cheap generic ampicillin
purchase nexium generic – anexa mate buy nexium 20mg without prescription
coumadin 2mg oral – coumamide buy generic cozaar online
how to get mobic without a prescription – tenderness buy meloxicam 15mg
prednisone 10mg oral – apreplson.com oral deltasone 10mg
where to buy otc ed pills – site cheapest ed pills online
buy amoxicillin without prescription – comba moxi buy amoxicillin generic
order generic diflucan 200mg – https://gpdifluca.com/# order generic forcan
lexapro 20mg us – https://escitapro.com/# how to get escitalopram without a prescription
cenforce 50mg pill – https://cenforcers.com/# cenforce 100mg usa
canadian no prescription pharmacy cialis – https://ciltadgn.com/# buying generic cialis
cialis prices at walmart – on this site cialis free trial voucher
buy zantac generic – site zantac 150mg cost
buy viagra plus – https://strongvpls.com/ where to buy viagra in canada
This is the kind of glad I take advantage of reading. buy furosemide generic
This is the big-hearted of scribble literary works I truly appreciate. on this site
I’ll certainly bring back to review more. https://ursxdol.com/prednisone-5mg-tablets/
More posts like this would force the blogosphere more useful. https://prohnrg.com/product/loratadine-10-mg-tablets/
More posts like this would make the blogosphere more useful. https://aranitidine.com/fr/sibelium/