- Bitcoin’s 2024 price movement mirrored 2020, suggesting another parabolic rally could be imminent.
- BTC traders look for accumulation trends as key resistance levels signal a possible breakout ahead.
Bitcoin [BTC] is showing signs of repeating its post-halving behavior from 2020, raising the possibility of a parabolic rally in 2024.
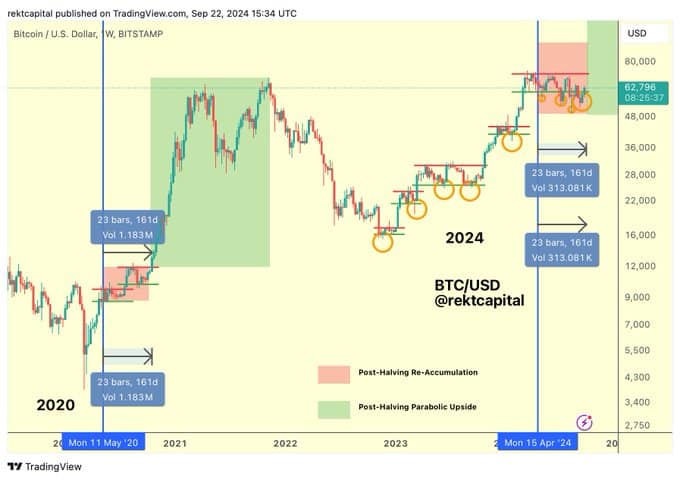
According to crypto analyst Rekt Capital, Bitcoin’s price action in 2024 mirrors the market dynamics observed after the 2020 Halving.
The focus is on the 161-day post-halving period, which historically led to significant price surges.
Rekt Capital’s analysis highlighted the similarities between Bitcoin’s post-halving price movements in 2020 and 2024.
In 2020, Bitcoin’s price surged after breaking out of its Re-Accumulation range, which marked the beginning of a major rally.
This breakout was characterized by increased buying activity and a shift in market sentiment, pushing prices to new highs.

Source: X
In 2024, Bitcoin is again positioned just after the critical 161-day post-halving period, suggesting the potential for a similar breakout.
As of press time, Bitcoin was trading at $63,439, with a 0.60% increase in the last 24 hours and a 7.51% gain over the past week.
This upward movement reflects a pattern similar to 2020, reinforcing expectations of another strong rally.
Key resistance and support levels to watch
Bitcoin’s price is approaching key resistance levels that need to be cleared to confirm a breakout.
BTC’s recent rise from $56,000 to $63,000 shows strong bullish momentum, but the resistance at these levels remains a critical hurdle.
Support levels, highlighted on the chart, indicate strong buying interest, similar to the setup in 2020.
These support zones, marked by orange circles, provide a strong base that could help stabilize Bitcoin’s price in case of a pullback, maintaining the overall bullish outlook.
Bitcoin accumulation spikes as traders eye breakout
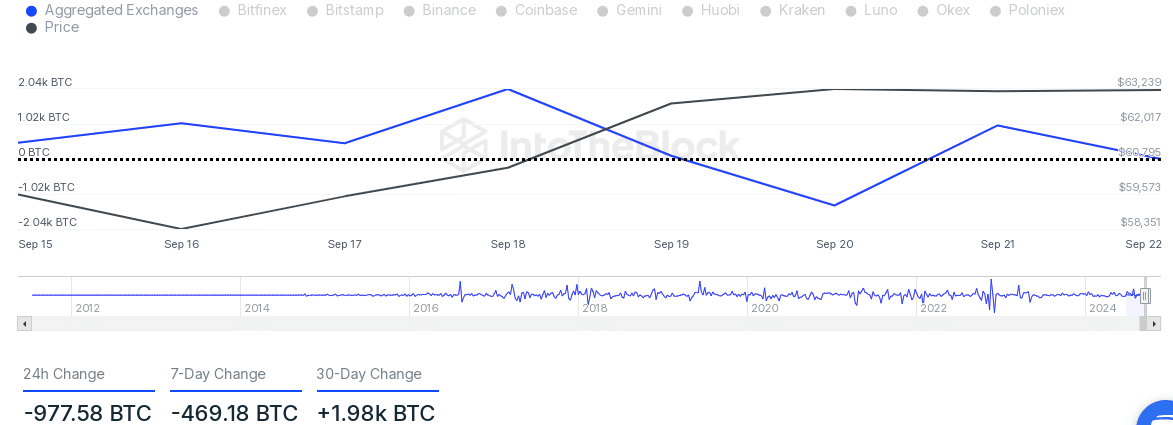
Bitcoin’s market setup indicates the possibility of an imminent breakout. The price has fluctuated between $58,351 and $63,239 from the 15th to the 22nd of September, with a notable low on the 20th of September at $59,573 before a recovery.
On-chain data also pointed to accumulation trends, with net BTC outflows of -977.58 BTC in the last 24 hours and -469.18 BTC over the past seven days, indicating reduced selling pressure.
These outflows suggested that market participants were holding onto their BTC, potentially positioning for further price increases.

Source: IntoTheBlock
According to DefiLlama data, the Total Value Locked (TVL) in Bitcoin-related projects was $573.26 million, with 24-hour fees totaling $373,571 and active addresses reaching 595,289
Read Bitcoin (BTC) Price Prediction 2024-25
These metrics reflected ongoing market activity that could serve as a catalyst for further price increases, supporting the idea of a sustained upward trajectory as seen in previous cycles.
Bitcoin’s market activity reflects ongoing investor interest, as indicated by recent trading volumes and on-chain data.
- Bitcoin’s 2024 price movement mirrored 2020, suggesting another parabolic rally could be imminent.
- BTC traders look for accumulation trends as key resistance levels signal a possible breakout ahead.
Bitcoin [BTC] is showing signs of repeating its post-halving behavior from 2020, raising the possibility of a parabolic rally in 2024.
According to crypto analyst Rekt Capital, Bitcoin’s price action in 2024 mirrors the market dynamics observed after the 2020 Halving.
The focus is on the 161-day post-halving period, which historically led to significant price surges.
Rekt Capital’s analysis highlighted the similarities between Bitcoin’s post-halving price movements in 2020 and 2024.
In 2020, Bitcoin’s price surged after breaking out of its Re-Accumulation range, which marked the beginning of a major rally.
This breakout was characterized by increased buying activity and a shift in market sentiment, pushing prices to new highs.

Source: X
In 2024, Bitcoin is again positioned just after the critical 161-day post-halving period, suggesting the potential for a similar breakout.
As of press time, Bitcoin was trading at $63,439, with a 0.60% increase in the last 24 hours and a 7.51% gain over the past week.
This upward movement reflects a pattern similar to 2020, reinforcing expectations of another strong rally.
Key resistance and support levels to watch
Bitcoin’s price is approaching key resistance levels that need to be cleared to confirm a breakout.
BTC’s recent rise from $56,000 to $63,000 shows strong bullish momentum, but the resistance at these levels remains a critical hurdle.
Support levels, highlighted on the chart, indicate strong buying interest, similar to the setup in 2020.
These support zones, marked by orange circles, provide a strong base that could help stabilize Bitcoin’s price in case of a pullback, maintaining the overall bullish outlook.
Bitcoin accumulation spikes as traders eye breakout
Bitcoin’s market setup indicates the possibility of an imminent breakout. The price has fluctuated between $58,351 and $63,239 from the 15th to the 22nd of September, with a notable low on the 20th of September at $59,573 before a recovery.
On-chain data also pointed to accumulation trends, with net BTC outflows of -977.58 BTC in the last 24 hours and -469.18 BTC over the past seven days, indicating reduced selling pressure.
These outflows suggested that market participants were holding onto their BTC, potentially positioning for further price increases.

Source: IntoTheBlock
According to DefiLlama data, the Total Value Locked (TVL) in Bitcoin-related projects was $573.26 million, with 24-hour fees totaling $373,571 and active addresses reaching 595,289
Read Bitcoin (BTC) Price Prediction 2024-25
These metrics reflected ongoing market activity that could serve as a catalyst for further price increases, supporting the idea of a sustained upward trajectory as seen in previous cycles.
Bitcoin’s market activity reflects ongoing investor interest, as indicated by recent trading volumes and on-chain data.


can you get clomid prices where to buy generic clomiphene where can i get cheap clomiphene pill cost of cheap clomiphene pills generic clomiphene without dr prescription can you buy clomid without a prescription clomiphene cost uk
More posts like this would persuade the online time more useful.
This is the make of enter I turn up helpful.
zithromax 500mg canada – order floxin 200mg for sale metronidazole 200mg canada
buy semaglutide 14 mg – semaglutide 14 mg price generic cyproheptadine
buy generic domperidone over the counter – buy flexeril online flexeril without prescription
buy generic propranolol online – inderal 20mg oral brand methotrexate 10mg
order amoxiclav for sale – https://atbioinfo.com/ buy acillin for sale
esomeprazole 40mg capsules – https://anexamate.com/ buy esomeprazole sale
buy generic coumadin – https://coumamide.com/ buy cozaar for sale
meloxicam 15mg pill – https://moboxsin.com/ purchase meloxicam pill
buy prednisone generic – aprep lson order prednisone 40mg pills
buy ed pills online – https://fastedtotake.com/ otc ed pills
buy cheap generic amoxicillin – combamoxi buy generic amoxil over the counter
order diflucan 200mg sale – buy fluconazole paypal diflucan 100mg oral
buy cenforce tablets – https://cenforcers.com/ order cenforce 100mg online
cialis vs sildenafil – fast ciltad order cialis online no prescription reviews
cialis where to buy in las vegas nv – https://strongtadafl.com/ cialis for daily use reviews
buy zantac 150mg pills – https://aranitidine.com/ order zantac 300mg sale
how to order viagra from canada – on this site viagra buy england
This is a question which is near to my callousness… Many thanks! Unerringly where can I notice the phone details due to the fact that questions? https://buyfastonl.com/gabapentin.html
More articles like this would remedy the blogosphere richer. https://ursxdol.com/cialis-tadalafil-20/
Thanks on putting this up. It’s okay done. https://prohnrg.com/
I couldn’t resist commenting. Warmly written! https://ondactone.com/spironolactone/