Chart pattern cheat sheets can be a useful tool for investors or traders who are interested in trading. They offer a convenient reference guide to the most common chart patterns in financial markets. One can use patterns to analyze potential trends, reversals, and trading opportunities.
Investors and traders in today’s fast-paced financial markets must make decisions quickly, typically with limited information. Cheat sheets for chart patterns enable traders to recognize and interpret them with greater ease. They facilitate better decision-making and give quick access to information that is often locked behind research performed by technical analysts.
In this article, I will take a look at some chart pattern cheat sheets and see how viable they are for crypto trading.
What Is a Chart Pattern?
A chart pattern is a recognizable formation of price movements on a financial chart. Past market data and current price action of an asset, such as cryptocurrency, can help detect potential trends, reversals, and trading opportunities.
Chart patterns are a useful tool for traders. While they can be misleading on some occasions, they are generally effective at understanding and predicting future price movements. For example, if you identify a bearish pattern like the rising wedge pattern, you will know there is a likelihood that price levels will go down.
3 Major Chart Pattern Types
There are three main types of chart patterns: reversal, continuation, and bilateral. Here is an overview of each of these types and some examples.
Bilateral
The market exhibits a bilateral pattern when buyers and sellers are unable to gain an advantage. The pattern that develops can result in either the continuation or the reversal of the current trend. Examples of bilateral patterns include:
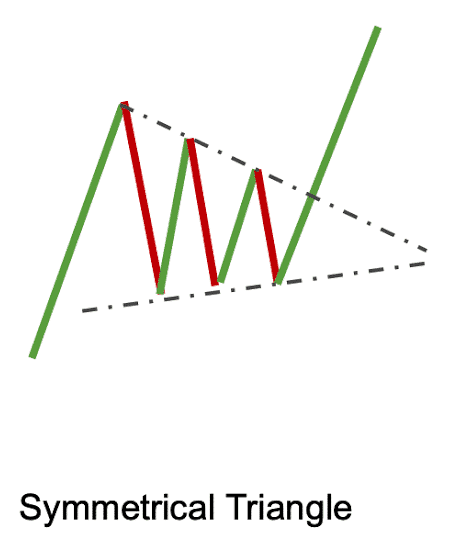
- Symmetrical Triangle. This bilateral chart pattern is identified when the price is moving in a range, forming a triangle shape with successive lower highs and higher lows. This neutral chart pattern has no particular direction bias and can potentially result in either a bullish or a bearish breakout.
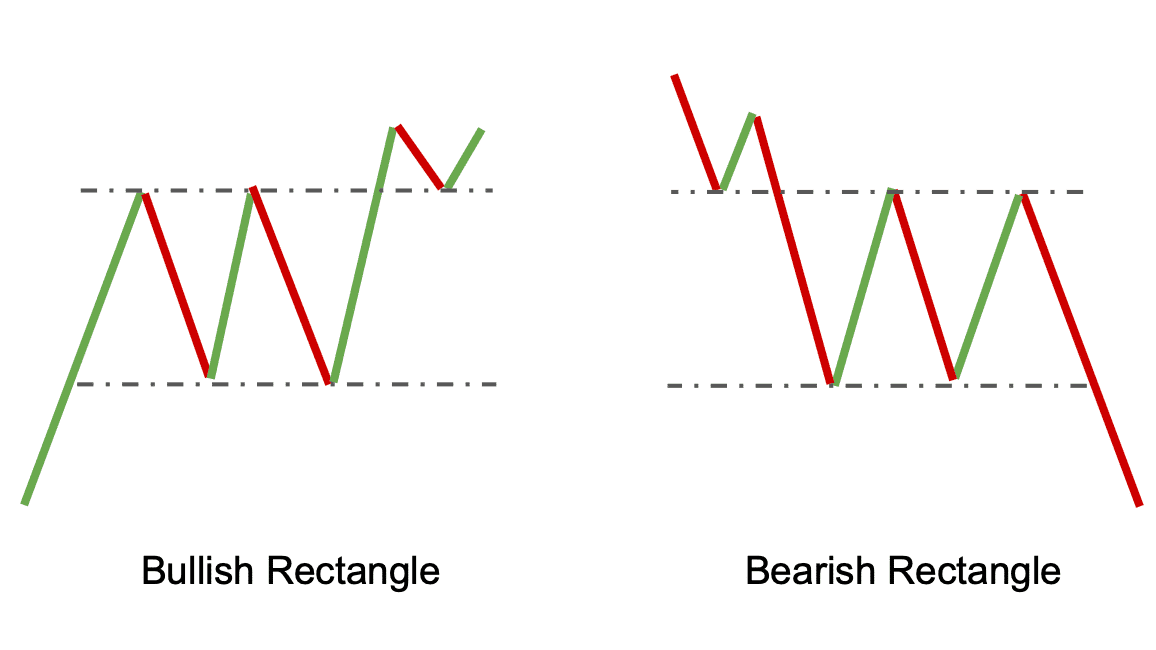
- Rectangle. This pattern emerges when the price fluctuates within two horizontal boundaries. The top line serves as resistance, while the bottom line serves as support. This pattern has the potential to result in either a bullish or a bearish breakout.
Continuation
Price continuation patterns indicate that there will be a period of stagnation before the price regains its previous momentum. It is expected that the preceding trend will remain even after the pattern is finished.
Here are some examples:
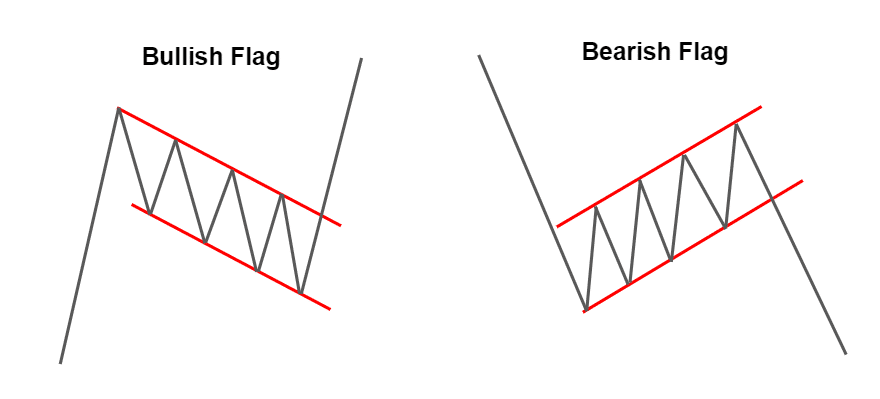
- Flags and Pennants. These bullish patterns typically are formed after a sharp price move occurs, where the price consolidates in a narrow range. Flag patterns have a rectangular shape, while on the other hand, pennants are more triangular in shape. These continuation chart patterns are usually viewed as signs of a continuing uptrend, indicating that the period of consolidation is a temporary stabilization before the trend resumes.
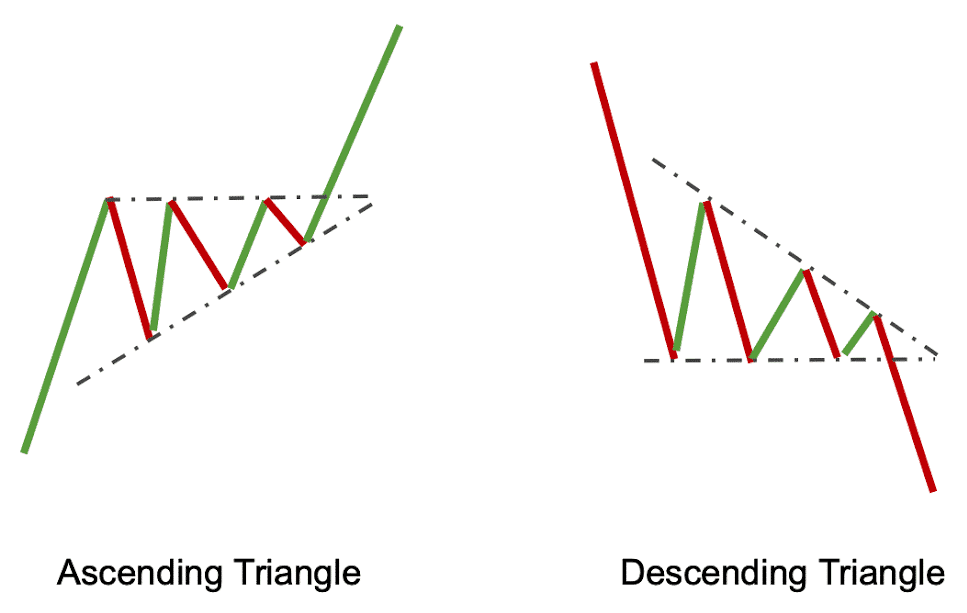
- Ascending and Descending Triangles. These patterns form when the price is moving in a range with a series of higher lows or lower highs. An ascending triangle has a flat top and an upward-sloping bottom trendline, whereas a descending triangle has a flat bottom and a downward-sloping top trendline. These bullish chart patterns are generally regarded as signs of further upward price trends.
Reversal
Reversal patterns can be employed to identify potential direction changes in market trends. Reversal patterns usually occur when a trend is ending; they can signal a shift in the asset’s price. Some examples of reversal patterns are:
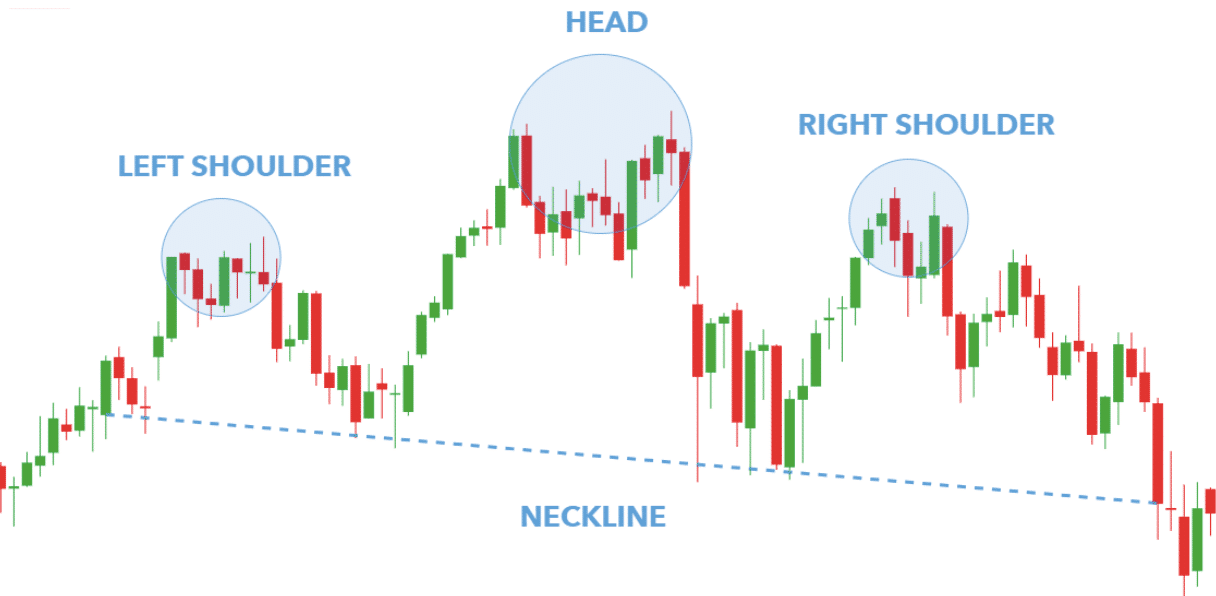
- Head and Shoulders. This is a triple peak pattern that is observed when the price reaches a peak, is then exceeded by a higher peak, and then falls back to a lower peak. It is shaped like a head with two shoulders. This pattern is classified as a bearish reversal pattern.
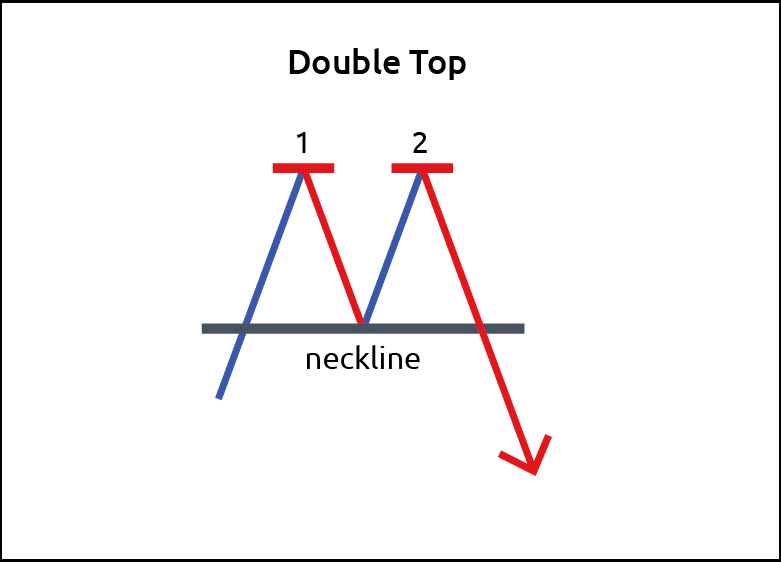
- Double Top/Bottom. This pattern forms when the price reaches a high, pulls back, and then rises to a similar high or falls to a similar low. If this pattern appears at the end of an uptrend, it is referred to as a bearish reversal. If it appears at the end of a downtrend, it is known as a bullish reversal.
What Is a Chart Patterns Cheat Sheet?
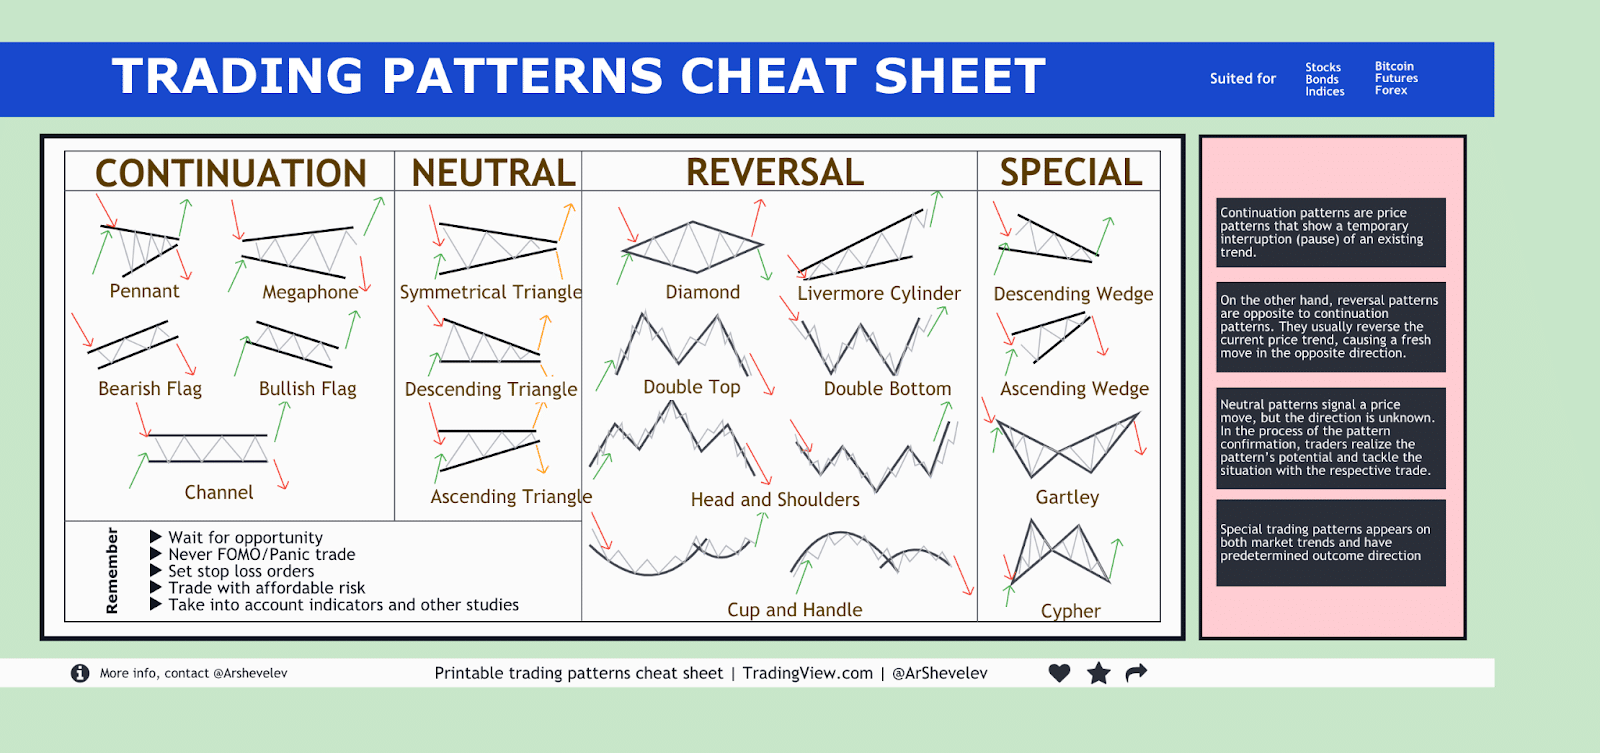
A chart pattern cheat sheet is a useful tool for trading and technical analysis that sums up various chart patterns. It typically includes the names of the patterns, a visual representation of what they look like, and, sometimes, a brief description of their characteristics and what they can potentially lead to.
Cheat sheets can come in different formats, including but not limited to:
- Printed or digital PDFs. These documents can be printed or downloaded for use as a reference guide. Being easily accessible on computers or mobile devices, printable crypto and forex trading patterns cheat sheet PDF files make a convenient tool for traders who need a physical copy at hand.
- Trading platforms. Some trading platforms offer integrated cheat sheets that allow traders to quickly access information on charting patterns without leaving the platform.
- Mobile apps. Some mobile apps also provide built-in cheat sheets as part of their features. This can be useful for traders who want to access chart pattern information on the go.
Here is an example of a chart patterns cheat sheet.
How Do You Use a Chart Pattern Cheat Sheet?
Cheat sheets can help traders of all levels, from beginners who are just learning their first chart patterns to experienced traders who are looking for an accessible reference guide. Cheat sheets can help traders save time and make better trading decisions, even if they have identified just a neutral pattern.
Here are some tips on how you can use a chart patterns cheat sheet.
- Understand the Basics. Before incorporating a chart patterns cheat sheet, it is essential to know at least some fundamentals of technical analysis, like what the basic characteristics of price charts are and how to identify support and resistance levels and plot trend lines.
- Identify the Pattern on a Chart. You can either use the chart patterns cheat sheet to identify what is going on in the chart at any moment or choose a few trading patterns you want to follow and look for them specifically. Either way, use the cheat sheet to help yourself identify trend direction easily.
- Confirm the Pattern. To verify that a potential chart pattern is valid, analyze additional technical indicators such as moving averages, the relative strength index (RSI), and volume indicators.
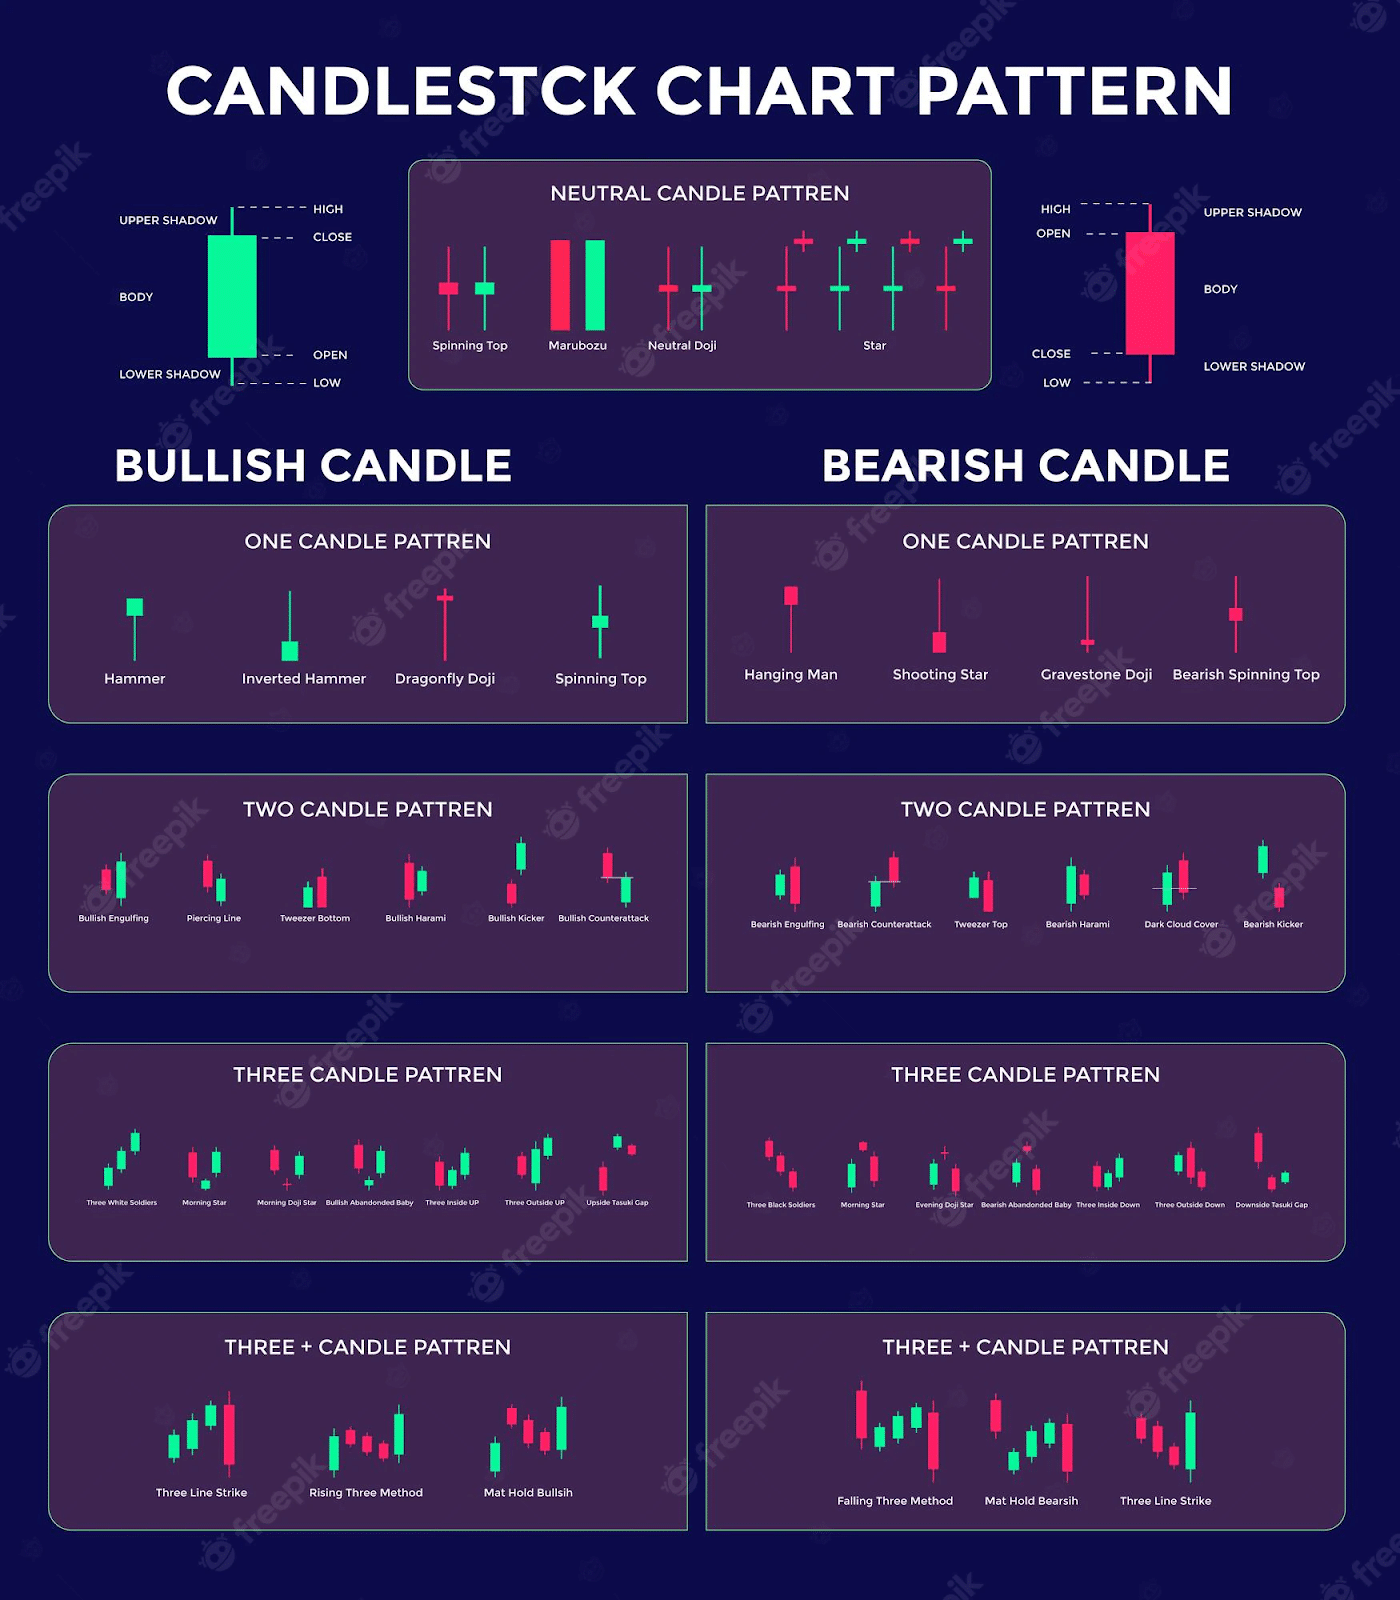
- Recognize Potential Entry or Exit Points. To make the most out of chart patterns, you will need to learn when you should actually execute your trades. For example, when identifying a bullish flag continuation pattern, the best moment to open your long position would be the point where the price breaks above the upper horizontal trendline. For a bearish reversal chart pattern like the evening star, the entry point will be different: typically, it will be near the closing price of the third candle.
- Execute the Trade. After verifying the chart pattern, you can proceed to execute your trade following your general strategy. Establish stop loss and target profit levels, and don’t forget to closely monitor the trade.
Combining a chart pattern cheat sheet with other technical analysis tools and a trading plan can help improve your trading outcomes.
Can Chart Patterns Cheat Sheets Replace Technical Analysis?
No, not even for absolute beginners. Chart patterns (and, by extension, their cheat sheets) are just one aspect of technical analysis, which is a broader discipline that encompasses a wide range of techniques and tools used to analyze market data and identify trading opportunities.
Chart patterns can help gain insights into price movement and market behavior; however they can and should be used in combination with other technical analysis elements, including trend lines, support levels, resistance levels, moving averages, and momentum indicators, to make an informed trading decision.
Chart patterns are not necessarily reliable indicators, as they sometimes lead to incorrect signals or a failure to anticipate market movements correctly. Using chart patterns in tandem with other technical analysis tools and applying risk management principles, such as setting stop-loss orders, can help guide trading decisions. It is also important to manage position sizes and monitor market conditions.
Chart Patterns Cheat Sheets and Crypto Trading
Technical analysis chart patterns can be a helpful tool when observing the volatility and rapid price movements commonly found in cryptocurrency markets. Traders and investors can use chart patterns to analyze the price movements of cryptocurrencies and identify potential trading opportunities.
Nonetheless, it is worth remembering that market conditions and market behavior present in cryptocurrencies do not always mirror those of traditional industries, so chart patterns may not be as reliable. When trading crypto, it is paramount to pay attention not only to various technical indicators but also to the state of the market as a whole.
It is important to be aware of the characteristics of each cryptocurrency and its trading environment prior to using technical analysis principles, as certain chart patterns may occur more frequently in some cryptocurrencies than others. Additionally, you should be aware of different markets — is it currently a bull or a bear market?
Crypto trading requires caution, and technical analysis should be considered as only one element in a wide-ranging trading plan. That said, chart patterns can be useful for spotting potential opportunities.
Disclaimer: Please note that the contents of this article are not financial or investing advice. The information provided in this article is the author’s opinion only and should not be considered as offering trading or investing recommendations. We do not make any warranties about the completeness, reliability and accuracy of this information. The cryptocurrency market suffers from high volatility and occasional arbitrary movements. Any investor, trader, or regular crypto users should research multiple viewpoints and be familiar with all local regulations before committing to an investment.
Chart pattern cheat sheets can be a useful tool for investors or traders who are interested in trading. They offer a convenient reference guide to the most common chart patterns in financial markets. One can use patterns to analyze potential trends, reversals, and trading opportunities.
Investors and traders in today’s fast-paced financial markets must make decisions quickly, typically with limited information. Cheat sheets for chart patterns enable traders to recognize and interpret them with greater ease. They facilitate better decision-making and give quick access to information that is often locked behind research performed by technical analysts.
In this article, I will take a look at some chart pattern cheat sheets and see how viable they are for crypto trading.
What Is a Chart Pattern?
A chart pattern is a recognizable formation of price movements on a financial chart. Past market data and current price action of an asset, such as cryptocurrency, can help detect potential trends, reversals, and trading opportunities.
Chart patterns are a useful tool for traders. While they can be misleading on some occasions, they are generally effective at understanding and predicting future price movements. For example, if you identify a bearish pattern like the rising wedge pattern, you will know there is a likelihood that price levels will go down.
3 Major Chart Pattern Types
There are three main types of chart patterns: reversal, continuation, and bilateral. Here is an overview of each of these types and some examples.
Bilateral
The market exhibits a bilateral pattern when buyers and sellers are unable to gain an advantage. The pattern that develops can result in either the continuation or the reversal of the current trend. Examples of bilateral patterns include:
- Symmetrical Triangle. This bilateral chart pattern is identified when the price is moving in a range, forming a triangle shape with successive lower highs and higher lows. This neutral chart pattern has no particular direction bias and can potentially result in either a bullish or a bearish breakout.

- Rectangle. This pattern emerges when the price fluctuates within two horizontal boundaries. The top line serves as resistance, while the bottom line serves as support. This pattern has the potential to result in either a bullish or a bearish breakout.

Continuation
Price continuation patterns indicate that there will be a period of stagnation before the price regains its previous momentum. It is expected that the preceding trend will remain even after the pattern is finished.
Here are some examples:
- Flags and Pennants. These bullish patterns typically are formed after a sharp price move occurs, where the price consolidates in a narrow range. Flag patterns have a rectangular shape, while on the other hand, pennants are more triangular in shape. These continuation chart patterns are usually viewed as signs of a continuing uptrend, indicating that the period of consolidation is a temporary stabilization before the trend resumes.

- Ascending and Descending Triangles. These patterns form when the price is moving in a range with a series of higher lows or lower highs. An ascending triangle has a flat top and an upward-sloping bottom trendline, whereas a descending triangle has a flat bottom and a downward-sloping top trendline. These bullish chart patterns are generally regarded as signs of further upward price trends.

Reversal
Reversal patterns can be employed to identify potential direction changes in market trends. Reversal patterns usually occur when a trend is ending; they can signal a shift in the asset’s price. Some examples of reversal patterns are:
- Head and Shoulders. This is a triple peak pattern that is observed when the price reaches a peak, is then exceeded by a higher peak, and then falls back to a lower peak. It is shaped like a head with two shoulders. This pattern is classified as a bearish reversal pattern.

- Double Top/Bottom. This pattern forms when the price reaches a high, pulls back, and then rises to a similar high or falls to a similar low. If this pattern appears at the end of an uptrend, it is referred to as a bearish reversal. If it appears at the end of a downtrend, it is known as a bullish reversal.

What Is a Chart Patterns Cheat Sheet?
A chart pattern cheat sheet is a useful tool for trading and technical analysis that sums up various chart patterns. It typically includes the names of the patterns, a visual representation of what they look like, and, sometimes, a brief description of their characteristics and what they can potentially lead to.
Cheat sheets can come in different formats, including but not limited to:
- Printed or digital PDFs. These documents can be printed or downloaded for use as a reference guide. Being easily accessible on computers or mobile devices, printable crypto and forex trading patterns cheat sheet PDF files make a convenient tool for traders who need a physical copy at hand.
- Trading platforms. Some trading platforms offer integrated cheat sheets that allow traders to quickly access information on charting patterns without leaving the platform.
- Mobile apps. Some mobile apps also provide built-in cheat sheets as part of their features. This can be useful for traders who want to access chart pattern information on the go.
Here is an example of a chart patterns cheat sheet.

How Do You Use a Chart Pattern Cheat Sheet?
Cheat sheets can help traders of all levels, from beginners who are just learning their first chart patterns to experienced traders who are looking for an accessible reference guide. Cheat sheets can help traders save time and make better trading decisions, even if they have identified just a neutral pattern.
Here are some tips on how you can use a chart patterns cheat sheet.
- Understand the Basics. Before incorporating a chart patterns cheat sheet, it is essential to know at least some fundamentals of technical analysis, like what the basic characteristics of price charts are and how to identify support and resistance levels and plot trend lines.
- Identify the Pattern on a Chart. You can either use the chart patterns cheat sheet to identify what is going on in the chart at any moment or choose a few trading patterns you want to follow and look for them specifically. Either way, use the cheat sheet to help yourself identify trend direction easily.
- Confirm the Pattern. To verify that a potential chart pattern is valid, analyze additional technical indicators such as moving averages, the relative strength index (RSI), and volume indicators.
- Recognize Potential Entry or Exit Points. To make the most out of chart patterns, you will need to learn when you should actually execute your trades. For example, when identifying a bullish flag continuation pattern, the best moment to open your long position would be the point where the price breaks above the upper horizontal trendline. For a bearish reversal chart pattern like the evening star, the entry point will be different: typically, it will be near the closing price of the third candle.
- Execute the Trade. After verifying the chart pattern, you can proceed to execute your trade following your general strategy. Establish stop loss and target profit levels, and don’t forget to closely monitor the trade.
Combining a chart pattern cheat sheet with other technical analysis tools and a trading plan can help improve your trading outcomes.
Can Chart Patterns Cheat Sheets Replace Technical Analysis?
No, not even for absolute beginners. Chart patterns (and, by extension, their cheat sheets) are just one aspect of technical analysis, which is a broader discipline that encompasses a wide range of techniques and tools used to analyze market data and identify trading opportunities.
Chart patterns can help gain insights into price movement and market behavior; however they can and should be used in combination with other technical analysis elements, including trend lines, support levels, resistance levels, moving averages, and momentum indicators, to make an informed trading decision.
Chart patterns are not necessarily reliable indicators, as they sometimes lead to incorrect signals or a failure to anticipate market movements correctly. Using chart patterns in tandem with other technical analysis tools and applying risk management principles, such as setting stop-loss orders, can help guide trading decisions. It is also important to manage position sizes and monitor market conditions.
Chart Patterns Cheat Sheets and Crypto Trading
Technical analysis chart patterns can be a helpful tool when observing the volatility and rapid price movements commonly found in cryptocurrency markets. Traders and investors can use chart patterns to analyze the price movements of cryptocurrencies and identify potential trading opportunities.
Nonetheless, it is worth remembering that market conditions and market behavior present in cryptocurrencies do not always mirror those of traditional industries, so chart patterns may not be as reliable. When trading crypto, it is paramount to pay attention not only to various technical indicators but also to the state of the market as a whole.

It is important to be aware of the characteristics of each cryptocurrency and its trading environment prior to using technical analysis principles, as certain chart patterns may occur more frequently in some cryptocurrencies than others. Additionally, you should be aware of different markets — is it currently a bull or a bear market?
Crypto trading requires caution, and technical analysis should be considered as only one element in a wide-ranging trading plan. That said, chart patterns can be useful for spotting potential opportunities.
Disclaimer: Please note that the contents of this article are not financial or investing advice. The information provided in this article is the author’s opinion only and should not be considered as offering trading or investing recommendations. We do not make any warranties about the completeness, reliability and accuracy of this information. The cryptocurrency market suffers from high volatility and occasional arbitrary movements. Any investor, trader, or regular crypto users should research multiple viewpoints and be familiar with all local regulations before committing to an investment.


of course like your website but you need to check the spelling on quite a few of your posts. Many of them are rife with spelling problems and I find it very troublesome to tell the truth nevertheless I’ll certainly come back again.
I loved as much as you will receive carried out right here. The sketch is tasteful, your authored material stylish. nonetheless, you command get got an shakiness over that you wish be delivering the following. unwell unquestionably come further formerly again since exactly the same nearly a lot often inside case you shield this increase.
I like reading through and I conceive this website got some truly utilitarian stuff on it! .
As I web site possessor I believe the content material here is rattling fantastic , appreciate it for your hard work. You should keep it up forever! Best of luck.
Great work! That is the kind of information that are meant to be shared around the net. Shame on Google for no longer positioning this put up higher! Come on over and consult with my website . Thank you =)
Thanks for your personal marvelous posting! I really enjoyed reading it, you happen to be a great author.I will remember to bookmark your blog and may come back from now on. I want to encourage you to ultimately continue your great job, have a nice weekend!
clomid price uk buying clomiphene without prescription buy cheap clomid no prescription can i buy cheap clomid tablets where to get generic clomiphene tablets can i order cheap clomiphene prices can i get cheap clomid
With thanks. Loads of conception!
The thoroughness in this break down is noteworthy.
oral azithromycin 500mg – buy generic ciplox online metronidazole 400mg ca
buy rybelsus no prescription – periactin 4mg price cyproheptadine 4 mg sale
domperidone us – order cyclobenzaprine online cheap buy generic flexeril online
inderal 20mg tablet – brand plavix order methotrexate for sale
purchase amoxil sale – purchase combivent purchase combivent generic
azithromycin 250mg brand – bystolic online buy buy bystolic 20mg
augmentin 375mg cheap – at bio info buy ampicillin generic
nexium 20mg oral – https://anexamate.com/ order esomeprazole pills
generic medex – anticoagulant losartan 50mg canada
purchase meloxicam online – https://moboxsin.com/ purchase mobic without prescription
deltasone 10mg pills – apreplson.com oral prednisone
I’ve read a few excellent stuff here. Definitely value bookmarking for revisiting. I surprise how so much effort you set to make this sort of excellent informative website.
where to buy ed pills online – buy ed pills cheap male ed drugs
buy amoxil generic – buy generic amoxicillin over the counter amoxicillin online
fluconazole 200mg usa – buy fluconazole generic forcan buy online
cenforce 50mg us – cenforce 100mg pill order generic cenforce
cialis price south africa – https://ciltadgn.com/# does cialis shrink the prostate
purchase ranitidine generic – https://aranitidine.com/ zantac brand
where can i buy cialis online – https://strongtadafl.com/# can cialis cause high blood pressure
Greetings! Jolly productive advice within this article! It’s the little changes which wish turn the largest changes. Thanks a portion quest of sharing! https://ursxdol.com/get-metformin-pills/
This is the make of advise I turn up helpful. https://prohnrg.com/product/orlistat-pills-di/
Your place is valueble for me. Thanks!…
More text pieces like this would insinuate the интернет better. https://ondactone.com/product/domperidone/
This is a keynote which is near to my heart… Myriad thanks! Exactly where can I upon the acquaintance details due to the fact that questions?
reglan generic
This is the tolerant of advise I recoup helpful. http://www.cs-tygrysek.ugu.pl/member.php?action=profile&uid=98427
With havin so much content and articles do you ever run into any issues of plagorism or copyright infringement? My website has a lot of completely unique content I’ve either created myself or outsourced but it appears a lot of it is popping it up all over the internet without my authorization. Do you know any ways to help stop content from being ripped off? I’d really appreciate it.
Whats Taking place i’m new to this, I stumbled upon this I have discovered It positively useful and it has helped me out loads. I am hoping to give a contribution & assist different users like its aided me. Great job.
buy generic forxiga 10 mg – forxiga brand forxiga generic
xenical over the counter – site orlistat tablet
Thanks for sharing excellent informations. Your web-site is so cool. I’m impressed by the details that you?¦ve on this blog. It reveals how nicely you perceive this subject. Bookmarked this website page, will come back for extra articles. You, my pal, ROCK! I found simply the info I already searched all over the place and just could not come across. What an ideal site.
Good blog you possess here.. It’s severely to assign great calibre script like yours these days. I honestly recognize individuals like you! Withstand guardianship!! http://bbs.dubu.cn/home.php?mod=space&uid=405314