


Bitcoin price is back trading above $70,000 after weeks of sideways price action. The recent boredom and sideways grind, however, isn’t necessarily a bad thing. In the past, such lulls in volatility have preceded the top cryptocurrency’s greatest rallies on record. Let’s take a look.
Bitcoin Historical Volatility Reaches Record Low
The term volatility often has a negative connotation surrounding it. For example, Oxford Languages defines volatility as the “liability to change rapidly and unpredictably, especially for the worse.” In financial markets, the term refers to how much and how fast price moves within a specific timeframe.
To measure volatility, technical analysts use the historical volatility metric, which compares volatility across the entire existence of an asset’s price timeline. Using such a tool, analysts can compare and contrast past bouts of high or low volatility in an asset like Bitcoin.
Related Reading
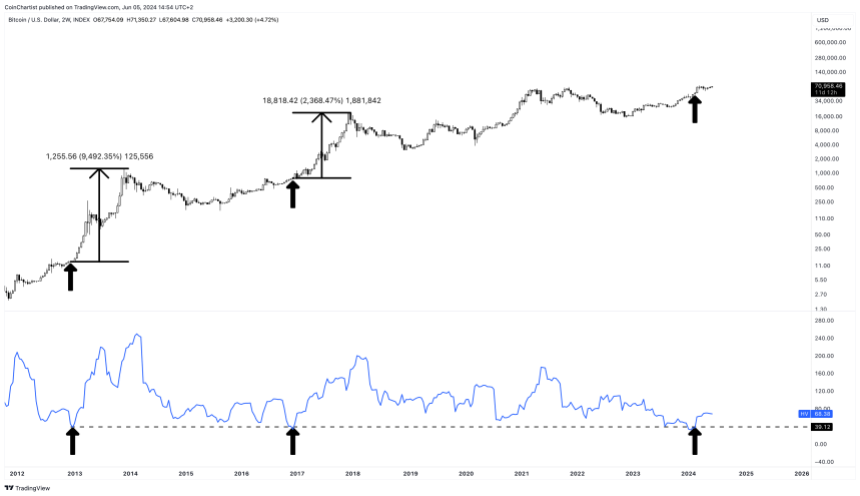
Turning this tool on in BTCUSD reveals that on the 2-week timeframe, the top cryptocurrency by market cap is coming off the lowest volatility phase in its entire existence. More importantly, however, is the fact that the last two times that BTCUSD was this boring, it led to an over 9,000% and over 2,000% rally. The most recent made Bitcoin a household name, rising from around $1,000 to nearly $20,000 at its peak in 2017.
Now the signal is back, but what might this mean for the cryptocurrency market and holders who have waited through the recent sideways price action.
Third Time Is A Charm: Can BTC Climb 200-500%?
Volatility is cyclical in nature. After periods of high volatility and explosive price action, the market moves into a lull where prices move painfully sideways. When the sideways boredom ends, it usually ends with a bang and a return to the explosive price action that was evident before the lull.
Volatility can also be measured and even predicted using “implied volatility.” But the direction in which the volatility releases cannot be predicted with accuracy. Considering volatility is most often associated with negativity, there’s at least some probability that the low in volatility could be broken by an extreme dump in Bitcoin.
Related Reading
But the last two instances suggest otherwise, and the recent trend has been up. While BTCUSD likely won’t see another 9,000% rally nor a 2,000% rally like it did in 2013 and 2017, the first-ever cryptocurrency could do anywhere from a 200% to 500% surge.
At 200% and a price of $70,000 per coin, Bitcoin could end up peaking this cycle at around $140,000. At a 500% move from current levels, Bitcoin could reach $350,000 per coin. Higher multiples are indeed possible, but not probable considering the law of diminishing returns.
Tony Severino, CMT is the author of the CoinChartist (VIP) newsletter. Sign up for free. Follow @TonyTheBullBTC & @coinchartist_io on Twitter. Or join the TonyTradesBTC Telegram for daily market insights and technical analysis education. Please note: Content is educational and should not be considered investment advice.
Featured image from ChatGPT, Charts from TradingView.com


where to buy clomid tablets can you get cheap clomiphene without rx buy generic clomid without prescription can i purchase clomiphene without rx clomiphene challenge test where buy clomiphene can i purchase clomiphene without insurance
More articles like this would make the blogosphere richer.
This website exceedingly has all of the information and facts I needed adjacent to this subject and didn’t positive who to ask.
generic zithromax 250mg – order sumycin pill buy metronidazole 400mg generic
semaglutide 14 mg usa – rybelsus 14 mg drug buy periactin without prescription
domperidone price – cyclobenzaprine where to buy generic cyclobenzaprine
inderal us – purchase methotrexate without prescription order generic methotrexate
where to buy amoxil without a prescription – buy diovan online order ipratropium generic
order generic azithromycin 250mg – buy nebivolol 5mg pill order bystolic 5mg without prescription
buy clavulanate online cheap – atbioinfo buy acillin generic
nexium price – https://anexamate.com/ where to buy esomeprazole without a prescription
medex medication – coumamide.com cozaar 25mg over the counter
buy generic prednisone over the counter – https://apreplson.com/ buy deltasone 5mg
generic ed drugs – fast ed to take hims ed pills
buy generic amoxil online – combamoxi.com cheap amoxicillin for sale
diflucan 100mg sale – https://gpdifluca.com/# diflucan 100mg pill
cenforce 50mg canada – https://cenforcers.com/ generic cenforce 50mg
cialis max dose – cialis las vegas erectile dysfunction tadalafil
purchase ranitidine generic – site buy zantac medication
can you just buy viagra – https://strongvpls.com/ herbal viagra sale ireland
I am in truth happy to glance at this blog posts which consists of tons of useful facts, thanks towards providing such data. este sitio
This is the kind of post I recoup helpful. dosage prednisone asthma
The thoroughness in this piece is noteworthy. https://ursxdol.com/cialis-tadalafil-20/
Thanks on sharing. It’s outstrip quality. https://prohnrg.com/product/loratadine-10-mg-tablets/
Thanks an eye to sharing. It’s top quality. prednisolone prix
Thanks on putting this up. It’s evidently done. https://ondactone.com/product/domperidone/
Facts blog you possess here.. It’s severely to on strong calibre writing like yours these days. I honestly comprehend individuals like you! Rent vigilance!!
https://doxycyclinege.com/pro/esomeprazole/
The depth in this serving is exceptional. http://www.irwebcast.com/cgi-local/report/redirect.cgi?url=https://faithful-raccoon-qpl4dn.mystrikingly.com/
Good blog you be undergoing here.. It’s severely to on strong calibre article like yours these days. I really respect individuals like you! Take guardianship!! https://www.forum-joyingauto.com/member.php?action=profile&uid=47847
buy forxiga pills – forxiga us dapagliflozin 10 mg price
purchase orlistat pill – https://asacostat.com/# order orlistat 60mg for sale
I couldn’t resist commenting. Well written! http://zqykj.com/bbs/home.php?mod=space&uid=303355