


- Analyst forecasts a 40% rally for Bitcoin before cycle top.
- The Fibonacci extension levels show targets of $109k and $132k.
Bitcoin [BTC] saw a surge in accumulation addresses. The HODL mentality was growing in popularity. Bitcoin addresses that have never had an outflow and a minimum of 10 BTC held 1.5 million coins at the beginning of 2024, but currently held 2.9 million.
The Bitcoin Rainbow Chart gave ultra-optimistic forecasts for the current cycle, targeting $288k or higher. However, historical trends showed that a cycle top could be closer to $100k this time.
Bitcoin set for another 40% rally before the cycle top?
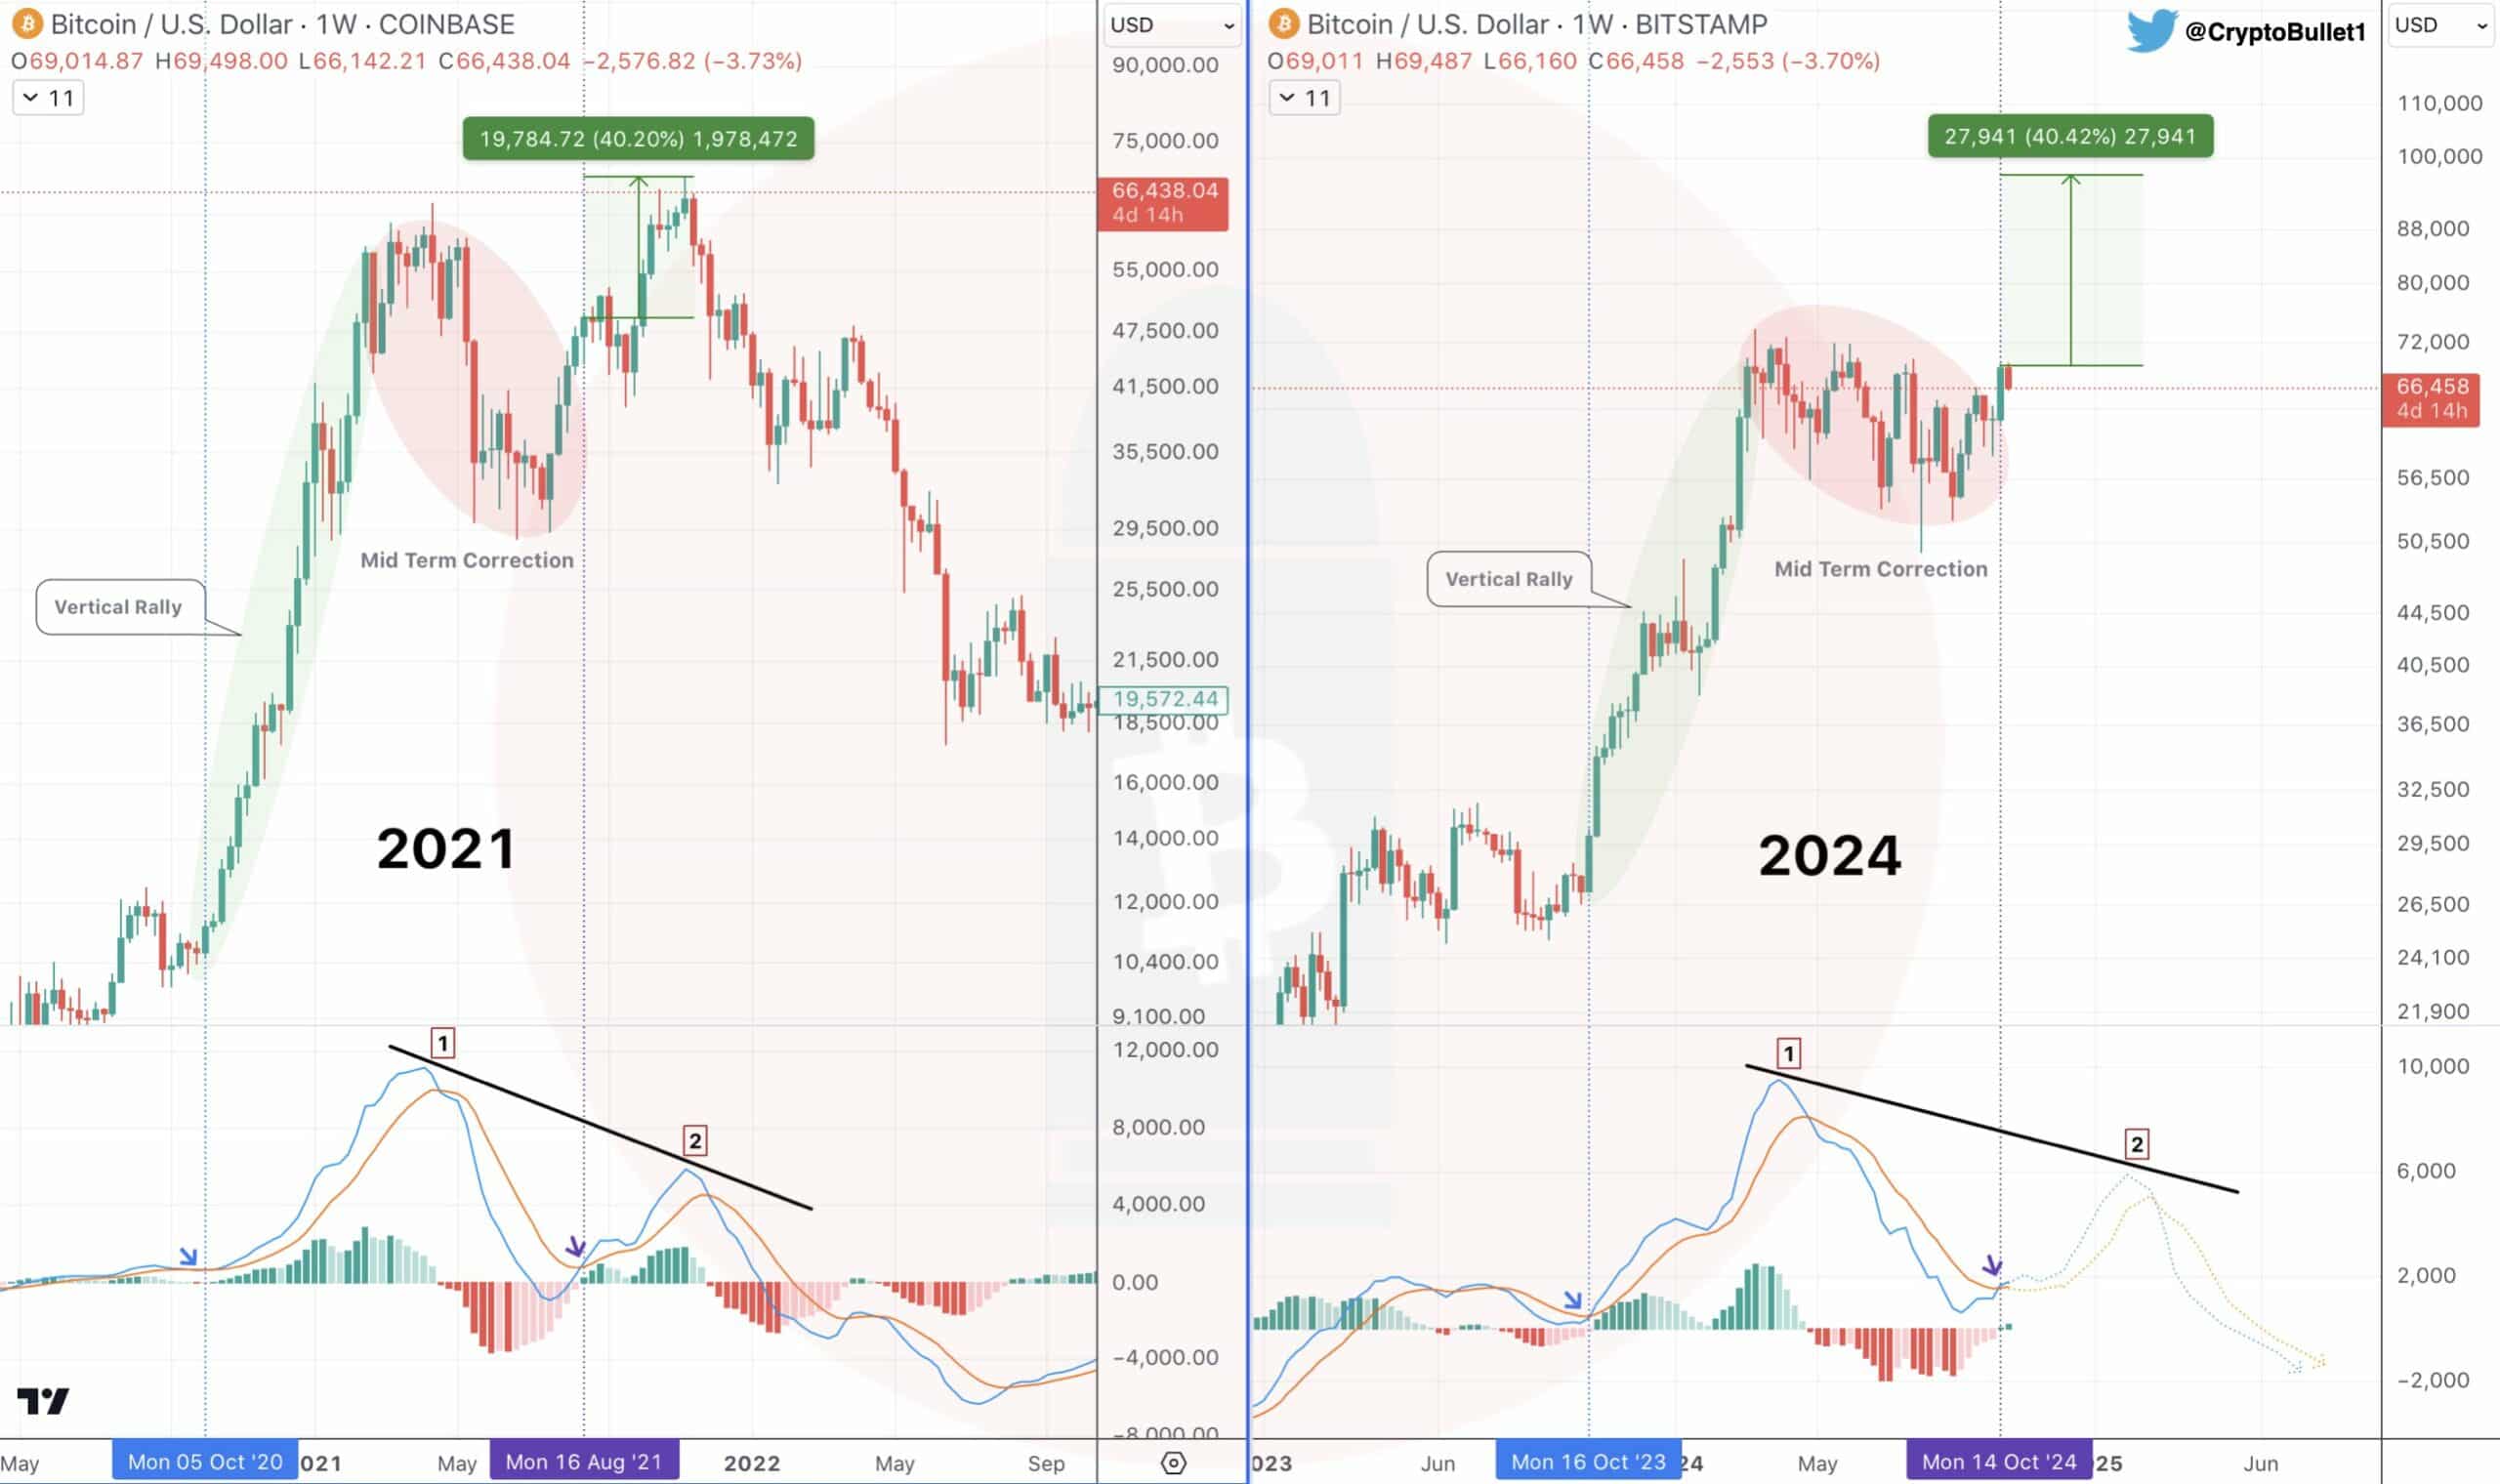
Source: CryptoBullet on X
In a post on X, crypto analyst CryptoBullet noted that the weekly MACD formed a bullish crossover for the first time since October 2023. Back then, a rally of 172% occurred within five months.
Yet, this rally was before the Bitcoin halving event. The debate now is- should we expect similar gains, or would the next leg higher end up forming a lower high on the MACD, and end up being the end of the bull run?
The analyst favored the latter scenario. A multi-month consolidation followed by a bullish MACD crossover after a vertical rally would likely not see triple-digit percentage gains. CryptoBullet suggested on his charts that another 40% move higher would be a reasonable target.
Gauging the current targets for Bitcoin
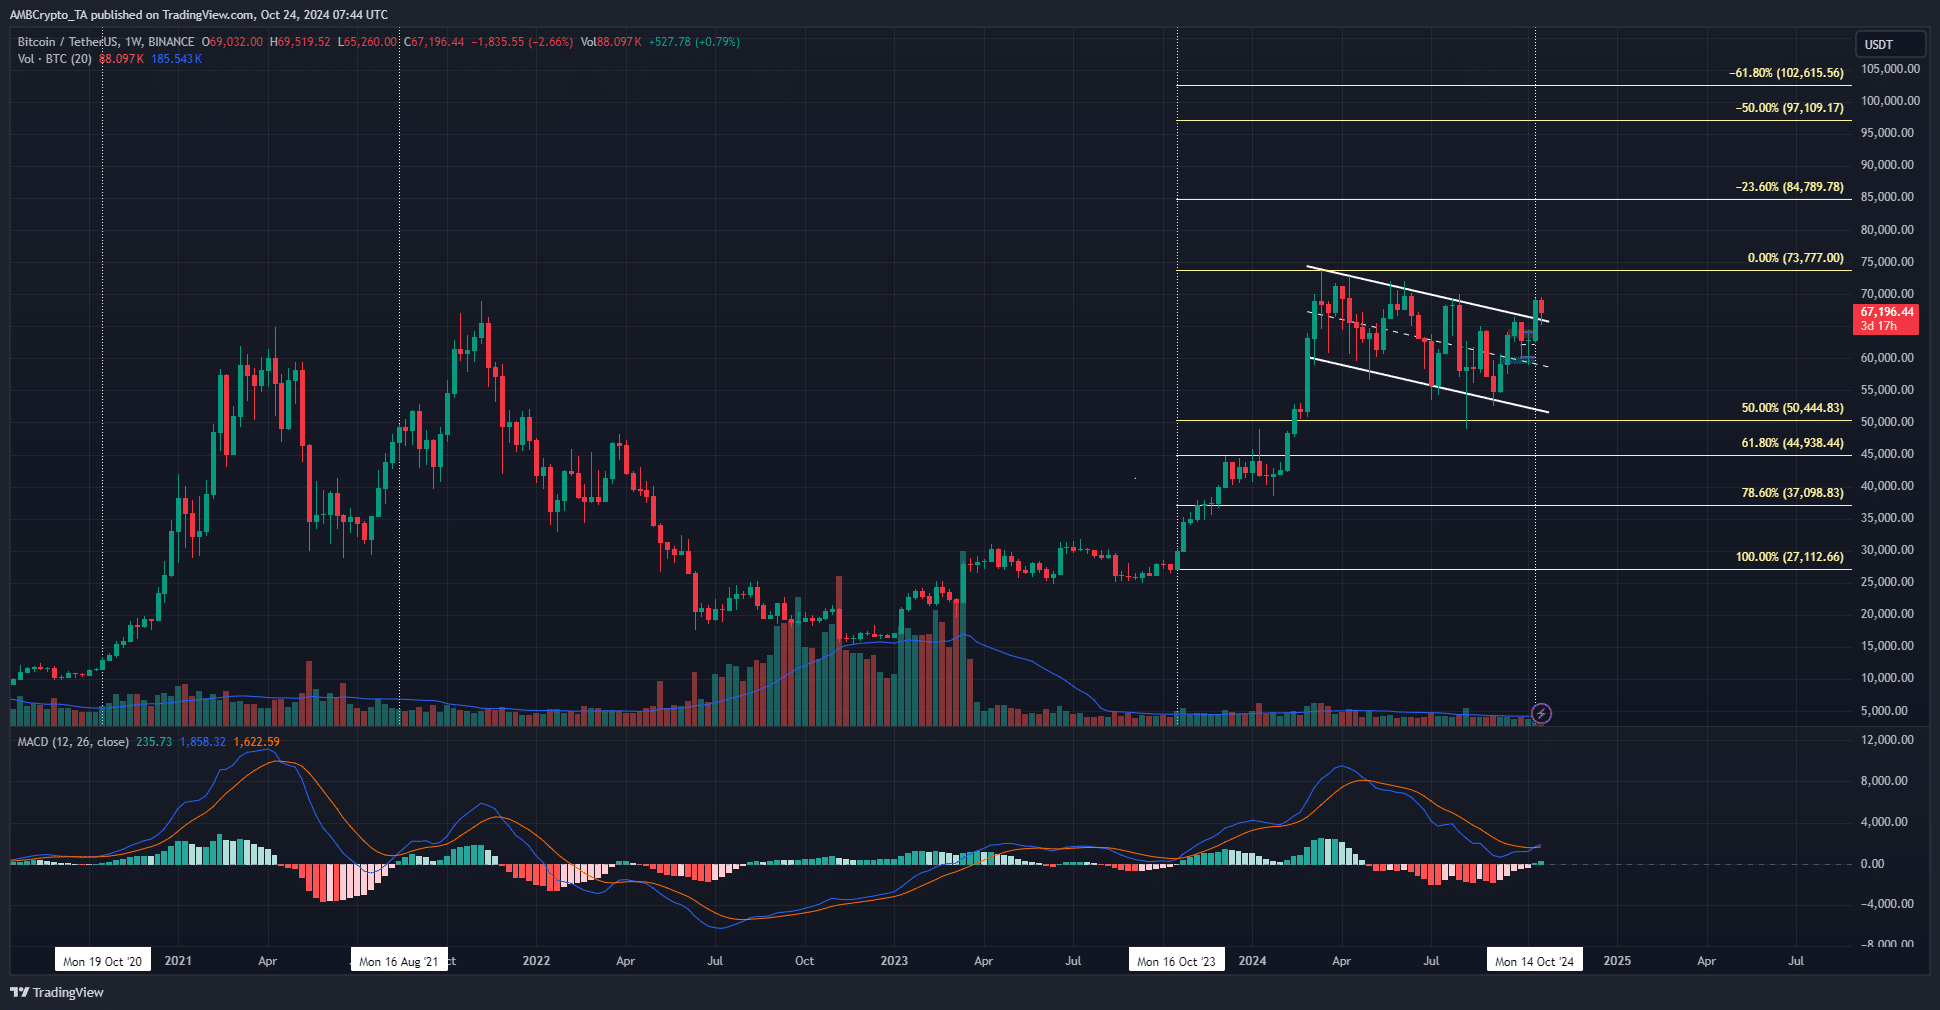
Source: BTC/USDT on TradingView
History rhymes but need not repeat. In the 2017-18 bull run, the weekly MACD bullish crossover saw a 617% return, and the 2020 one saw a 468% move. The 2023 one gave 172% in return but happened before the halving date.
Is your portfolio green? Check the Bitcoin Profit Calculator
In 2019 and 2020, Bitcoin rallied 190% from the $3.2k lows set 18 months before the halving. It is possible that the pre-halving run that BTC saw could be broken, and that the 40% price extension target CryptoBullet gave for the next leg could be wrong.
However, as things stand, it seems to be a reasonable expectation. It also ties in well with the Fibonacci extension levels plotted on the weekly chart above.
Disclaimer: The information presented does not constitute financial, investment, trading, or other types of advice and is solely the writer’s opinion
- Analyst forecasts a 40% rally for Bitcoin before cycle top.
- The Fibonacci extension levels show targets of $109k and $132k.
Bitcoin [BTC] saw a surge in accumulation addresses. The HODL mentality was growing in popularity. Bitcoin addresses that have never had an outflow and a minimum of 10 BTC held 1.5 million coins at the beginning of 2024, but currently held 2.9 million.
The Bitcoin Rainbow Chart gave ultra-optimistic forecasts for the current cycle, targeting $288k or higher. However, historical trends showed that a cycle top could be closer to $100k this time.
Bitcoin set for another 40% rally before the cycle top?
Source: CryptoBullet on X
In a post on X, crypto analyst CryptoBullet noted that the weekly MACD formed a bullish crossover for the first time since October 2023. Back then, a rally of 172% occurred within five months.
Yet, this rally was before the Bitcoin halving event. The debate now is- should we expect similar gains, or would the next leg higher end up forming a lower high on the MACD, and end up being the end of the bull run?
The analyst favored the latter scenario. A multi-month consolidation followed by a bullish MACD crossover after a vertical rally would likely not see triple-digit percentage gains. CryptoBullet suggested on his charts that another 40% move higher would be a reasonable target.
Gauging the current targets for Bitcoin
Source: BTC/USDT on TradingView
History rhymes but need not repeat. In the 2017-18 bull run, the weekly MACD bullish crossover saw a 617% return, and the 2020 one saw a 468% move. The 2023 one gave 172% in return but happened before the halving date.
Is your portfolio green? Check the Bitcoin Profit Calculator
In 2019 and 2020, Bitcoin rallied 190% from the $3.2k lows set 18 months before the halving. It is possible that the pre-halving run that BTC saw could be broken, and that the 40% price extension target CryptoBullet gave for the next leg could be wrong.
However, as things stand, it seems to be a reasonable expectation. It also ties in well with the Fibonacci extension levels plotted on the weekly chart above.
Disclaimer: The information presented does not constitute financial, investment, trading, or other types of advice and is solely the writer’s opinion


Выйти из финансовой сложности просто, если воспользоваться онлайн-займами. Круглосуточный перевод на карту делает их незаменимыми.
https://clients1.google.com.kh/url?q=https://t.me/s/zaim_bez_otkazov_na_kartu
https://images.google.ba/url?q=https://t.me/s/zaim_bez_otkazov_na_kartu
https://www.google.com.lb/url?q=https://t.me/s/zaim_bez_otkazov_na_kartu
https://www.google.com.bn/url?sa=t&url=https://t.me/s/zaim_bez_otkazov_na_kartu
https://images.google.com.bn/url?q=https://t.me/s/zaim_bez_otkazov_na_kartu
http://maps.google.co.ao/url?sa=t&url=https://t.me/s/zaim_bez_otkazov_na_kartu
Aroma Sensei naturally like your web site however you need to take a look at the spelling on several of your posts. A number of them are rife with spelling problems and I find it very bothersome to tell the truth on the other hand I will surely come again again.
cheap clomid for sale where buy cheap clomiphene without dr prescription where can i get generic clomid tablets where can i buy cheap clomid without prescription can i get generic clomid prices can i order cheap clomid prices how to buy clomid without prescription
More delight pieces like this would urge the web better.
Thanks recompense sharing. It’s outstrip quality.
zithromax 500mg canada – order generic ciplox metronidazole 200mg uk
semaglutide drug – buy semaglutide pills buy cyproheptadine 4mg pill
domperidone 10mg us – sumycin 250mg cost cyclobenzaprine 15mg sale
buy propranolol pills for sale – propranolol for sale where to buy methotrexate without a prescription
order amoxiclav pills – atbioinfo.com acillin brand
cost nexium – https://anexamate.com/ nexium 20mg cost
purchase coumadin generic – https://coumamide.com/ losartan pills
buy meloxicam 7.5mg generic – swelling order mobic 7.5mg for sale
order prednisone 20mg pills – apreplson.com order deltasone pill
buy ed pills usa – fast ed to take site buy ed pills canada
purchase amoxicillin for sale – combamoxi cheap amoxicillin
cost fluconazole 100mg – https://gpdifluca.com/# buy generic forcan over the counter
cenforce for sale – https://cenforcers.com/# cenforce 100mg for sale
tadalafil without a doctor’s prescription – usa peptides tadalafil cialis for ed
zantac 300mg drug – online zantac canada
what is the active ingredient in cialis – on this site pregnancy category for tadalafil
More articles like this would make the blogosphere richer. que es prednisolona y para que sirve
buy viagra 50 mg online – https://strongvpls.com/# buy generic viagra online canada
More posts like this would prosper the blogosphere more useful. prednisone itching
More articles like this would pretence of the blogosphere richer. https://ursxdol.com/get-cialis-professional/
Proof blog you have here.. It’s severely to on great quality article like yours these days. I justifiably comprehend individuals like you! Withstand mindfulness!! https://prohnrg.com/product/get-allopurinol-pills/
More posts like this would make the online space more useful. kamagra rouge
With thanks. Loads of expertise!
purchase plavix sale
orlistat brand – buy orlistat no prescription orlistat online buy
This is the stripe of glad I get high on reading. http://3ak.cn/home.php?mod=space&uid=230413