- Bitcoin flashes multiple signs indicating that it is back on a bearish leg at least in the short term.
- Can Bitcoin align with market expectations despite kicking off October with some profit-taking?
Bitcoin [BTC] investors have exhibited a lot of optimism about BTC in October, to the point that Uptober has been trending. This may have to do with multiple factors such as lower interest rates, historical performance in October and BTC’s latest bullish performance.
Although the bullish expectations for Bitcoin in October are high, there are signs that things might turn out different. For example, a recent CryptoQuant analysis suggests that BTC’s latest highs observed towards the end of September could mark its latest local high.
The analysis was based on BTC’s NVT golden cross and its recent push above 2.2. Another analysis suggests that Bitcoin will likely struggle to maintain bullish momentum in October based on historic performance.
According to the analysis, Bitcoin rallied for two weeks after a major rate cut in 2019, followed by two months of bearish performance.
These observations suggest that Bitcoin may still be subject to sell pressure despite the prevailing. This is already evident in BTC’s latest performance.
The cryptocurrency has already given up some of its September gains, indicating that some investors have been taking profits.
Bitcoin sell pressure accelerates
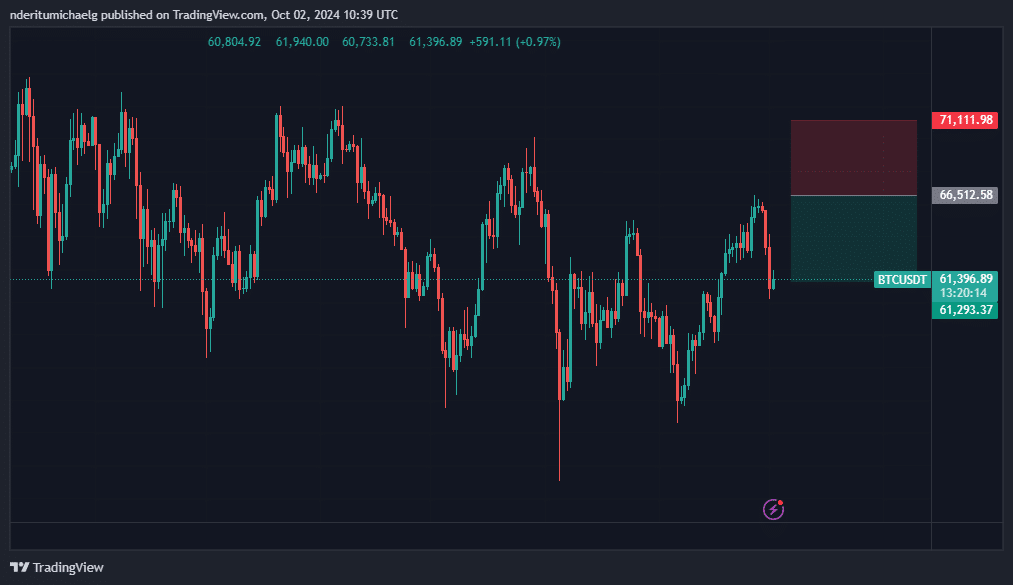
Bitcoin recently threatened to dip below $60,000 on 1 October. It exchanged hands at $61,430 at press time. It has so far tanked by 7.8% from its highest price in September.
This means it is on track to fall to the $59,580 and $57,940 price range as per the Fibbonacci retracement.

Source: TradingView
The pullback is enough indication that the post-rate cut announcement hype has run its course. However, this raises more questions than answers. Will demand resume if price retests the Fibonnacci level?
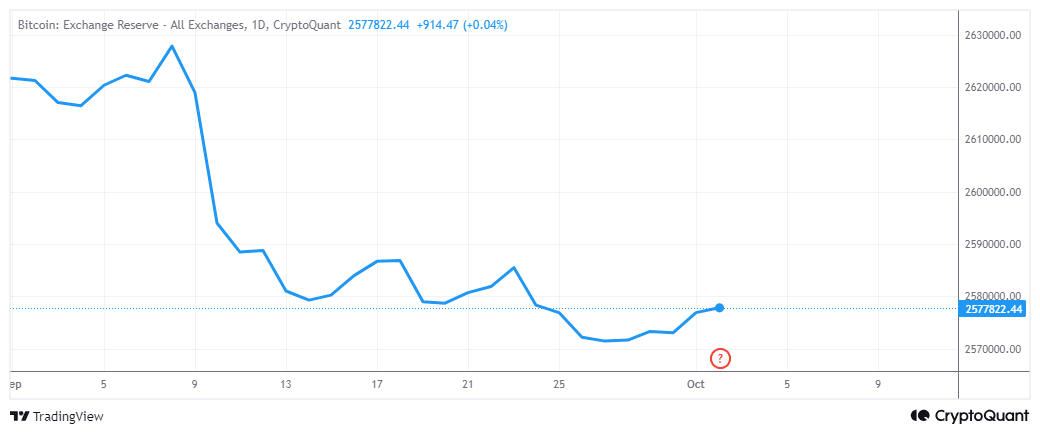
On-chain data presented information that was consistent with the bearish outcome. For example, Bitcoin exchange reserves have maintained an overall downtrend for the last few months with slight upticks here and there.
The Bitcoin exchange reserves concluded September with a bit of an uptick. This confirms that some coins have been moving from private wallets to exchanges. In most cases, this is consistent with a resurgence of sell pressure in the last few days.

Source: CryptoQuant
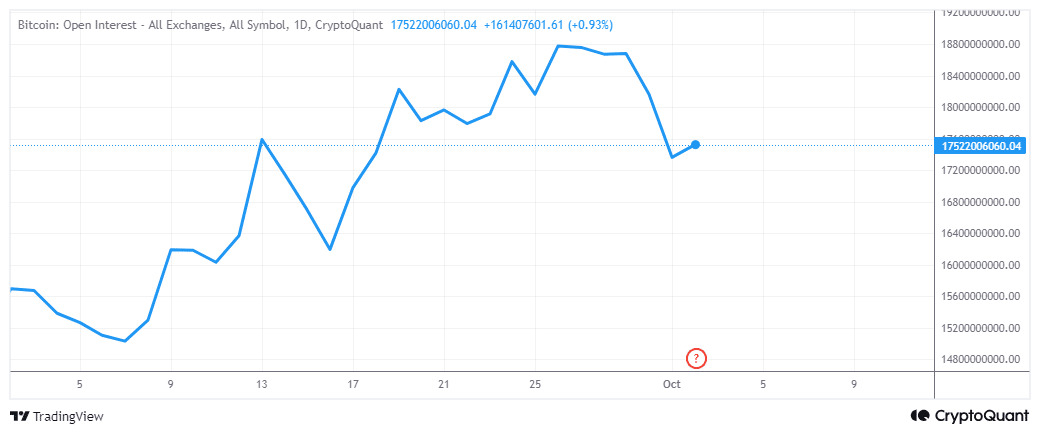
The exchange reserve uptick was also consistent with a dip in Bitcoin open interest since 26th September. This confirms that the demand for Bitcoin in the derivatives segment also slowed down.

Source: CryptoQuant
Read Bitcoin’s [BTC] Price Prediction 2024-25
The findings suggest a significant possibility that BTC may face more sell pressure in the short run. As is currently the situation but this does not necessarily provide a clear timeline.
It could be a brief pullback or turn out to be a longer one depending on how things will unfold.
- Bitcoin flashes multiple signs indicating that it is back on a bearish leg at least in the short term.
- Can Bitcoin align with market expectations despite kicking off October with some profit-taking?
Bitcoin [BTC] investors have exhibited a lot of optimism about BTC in October, to the point that Uptober has been trending. This may have to do with multiple factors such as lower interest rates, historical performance in October and BTC’s latest bullish performance.
Although the bullish expectations for Bitcoin in October are high, there are signs that things might turn out different. For example, a recent CryptoQuant analysis suggests that BTC’s latest highs observed towards the end of September could mark its latest local high.
The analysis was based on BTC’s NVT golden cross and its recent push above 2.2. Another analysis suggests that Bitcoin will likely struggle to maintain bullish momentum in October based on historic performance.
According to the analysis, Bitcoin rallied for two weeks after a major rate cut in 2019, followed by two months of bearish performance.
These observations suggest that Bitcoin may still be subject to sell pressure despite the prevailing. This is already evident in BTC’s latest performance.
The cryptocurrency has already given up some of its September gains, indicating that some investors have been taking profits.
Bitcoin sell pressure accelerates
Bitcoin recently threatened to dip below $60,000 on 1 October. It exchanged hands at $61,430 at press time. It has so far tanked by 7.8% from its highest price in September.
This means it is on track to fall to the $59,580 and $57,940 price range as per the Fibbonacci retracement.

Source: TradingView
The pullback is enough indication that the post-rate cut announcement hype has run its course. However, this raises more questions than answers. Will demand resume if price retests the Fibonnacci level?
On-chain data presented information that was consistent with the bearish outcome. For example, Bitcoin exchange reserves have maintained an overall downtrend for the last few months with slight upticks here and there.
The Bitcoin exchange reserves concluded September with a bit of an uptick. This confirms that some coins have been moving from private wallets to exchanges. In most cases, this is consistent with a resurgence of sell pressure in the last few days.

Source: CryptoQuant
The exchange reserve uptick was also consistent with a dip in Bitcoin open interest since 26th September. This confirms that the demand for Bitcoin in the derivatives segment also slowed down.

Source: CryptoQuant
Read Bitcoin’s [BTC] Price Prediction 2024-25
The findings suggest a significant possibility that BTC may face more sell pressure in the short run. As is currently the situation but this does not necessarily provide a clear timeline.
It could be a brief pullback or turn out to be a longer one depending on how things will unfold.


buying clomid pill how to buy cheap clomid tablets can i order generic clomiphene online how to buy clomiphene without prescription can i buy cheap clomid clomid chance of twins can you get cheap clomid without insurance
Greetings! Jolly productive advice within this article! It’s the little changes which will turn the largest changes. Thanks a portion in the direction of sharing!
Greetings! Very useful suggestion within this article! It’s the crumb changes which liking turn the largest changes. Thanks a quantity for sharing!
purchase zithromax generic – buy zithromax generic purchase metronidazole online
order semaglutide without prescription – buy cyproheptadine generic periactin us
order motilium for sale – domperidone 10mg sale cyclobenzaprine 15mg generic
inderal generic – plavix online methotrexate us
buy clavulanate tablets – atbioinfo.com buy ampicillin paypal
order nexium pill – https://anexamate.com/ esomeprazole without prescription
coumadin 2mg pills – https://coumamide.com/ cozaar cost
best male ed pills – erection problems buy erectile dysfunction medication
oral amoxicillin – cheap generic amoxicillin order amoxicillin generic
order fluconazole for sale – fluconazole canada buy generic forcan for sale
cenforce pills – https://cenforcers.com/ cenforce 50mg sale
generic tadalafil in us – is tadalafil from india safe tadalafil (tadalis-ajanta) reviews