- Market sentiment was bearish over the last four months as BTC faced consistent rejections from local highs
- Selling pressure has not abated and could force another major southbound move
Bitcoin’s [BTC] 2024 halving occurred on 19 April. Since then, however, the promised bull run is yet to materialize. At press time, the Crypto Fear and Greed Index had a reading of 46 – A sign of neutral sentiment.
On the weekly chart, Bitcoin continues to present a bearish structure, with BTC setting lower highs and lower lows since late May. Insights into stablecoin flows reinforced the bearish view of the crypto-market over the coming weeks.
Suspicions of a deeper price correction
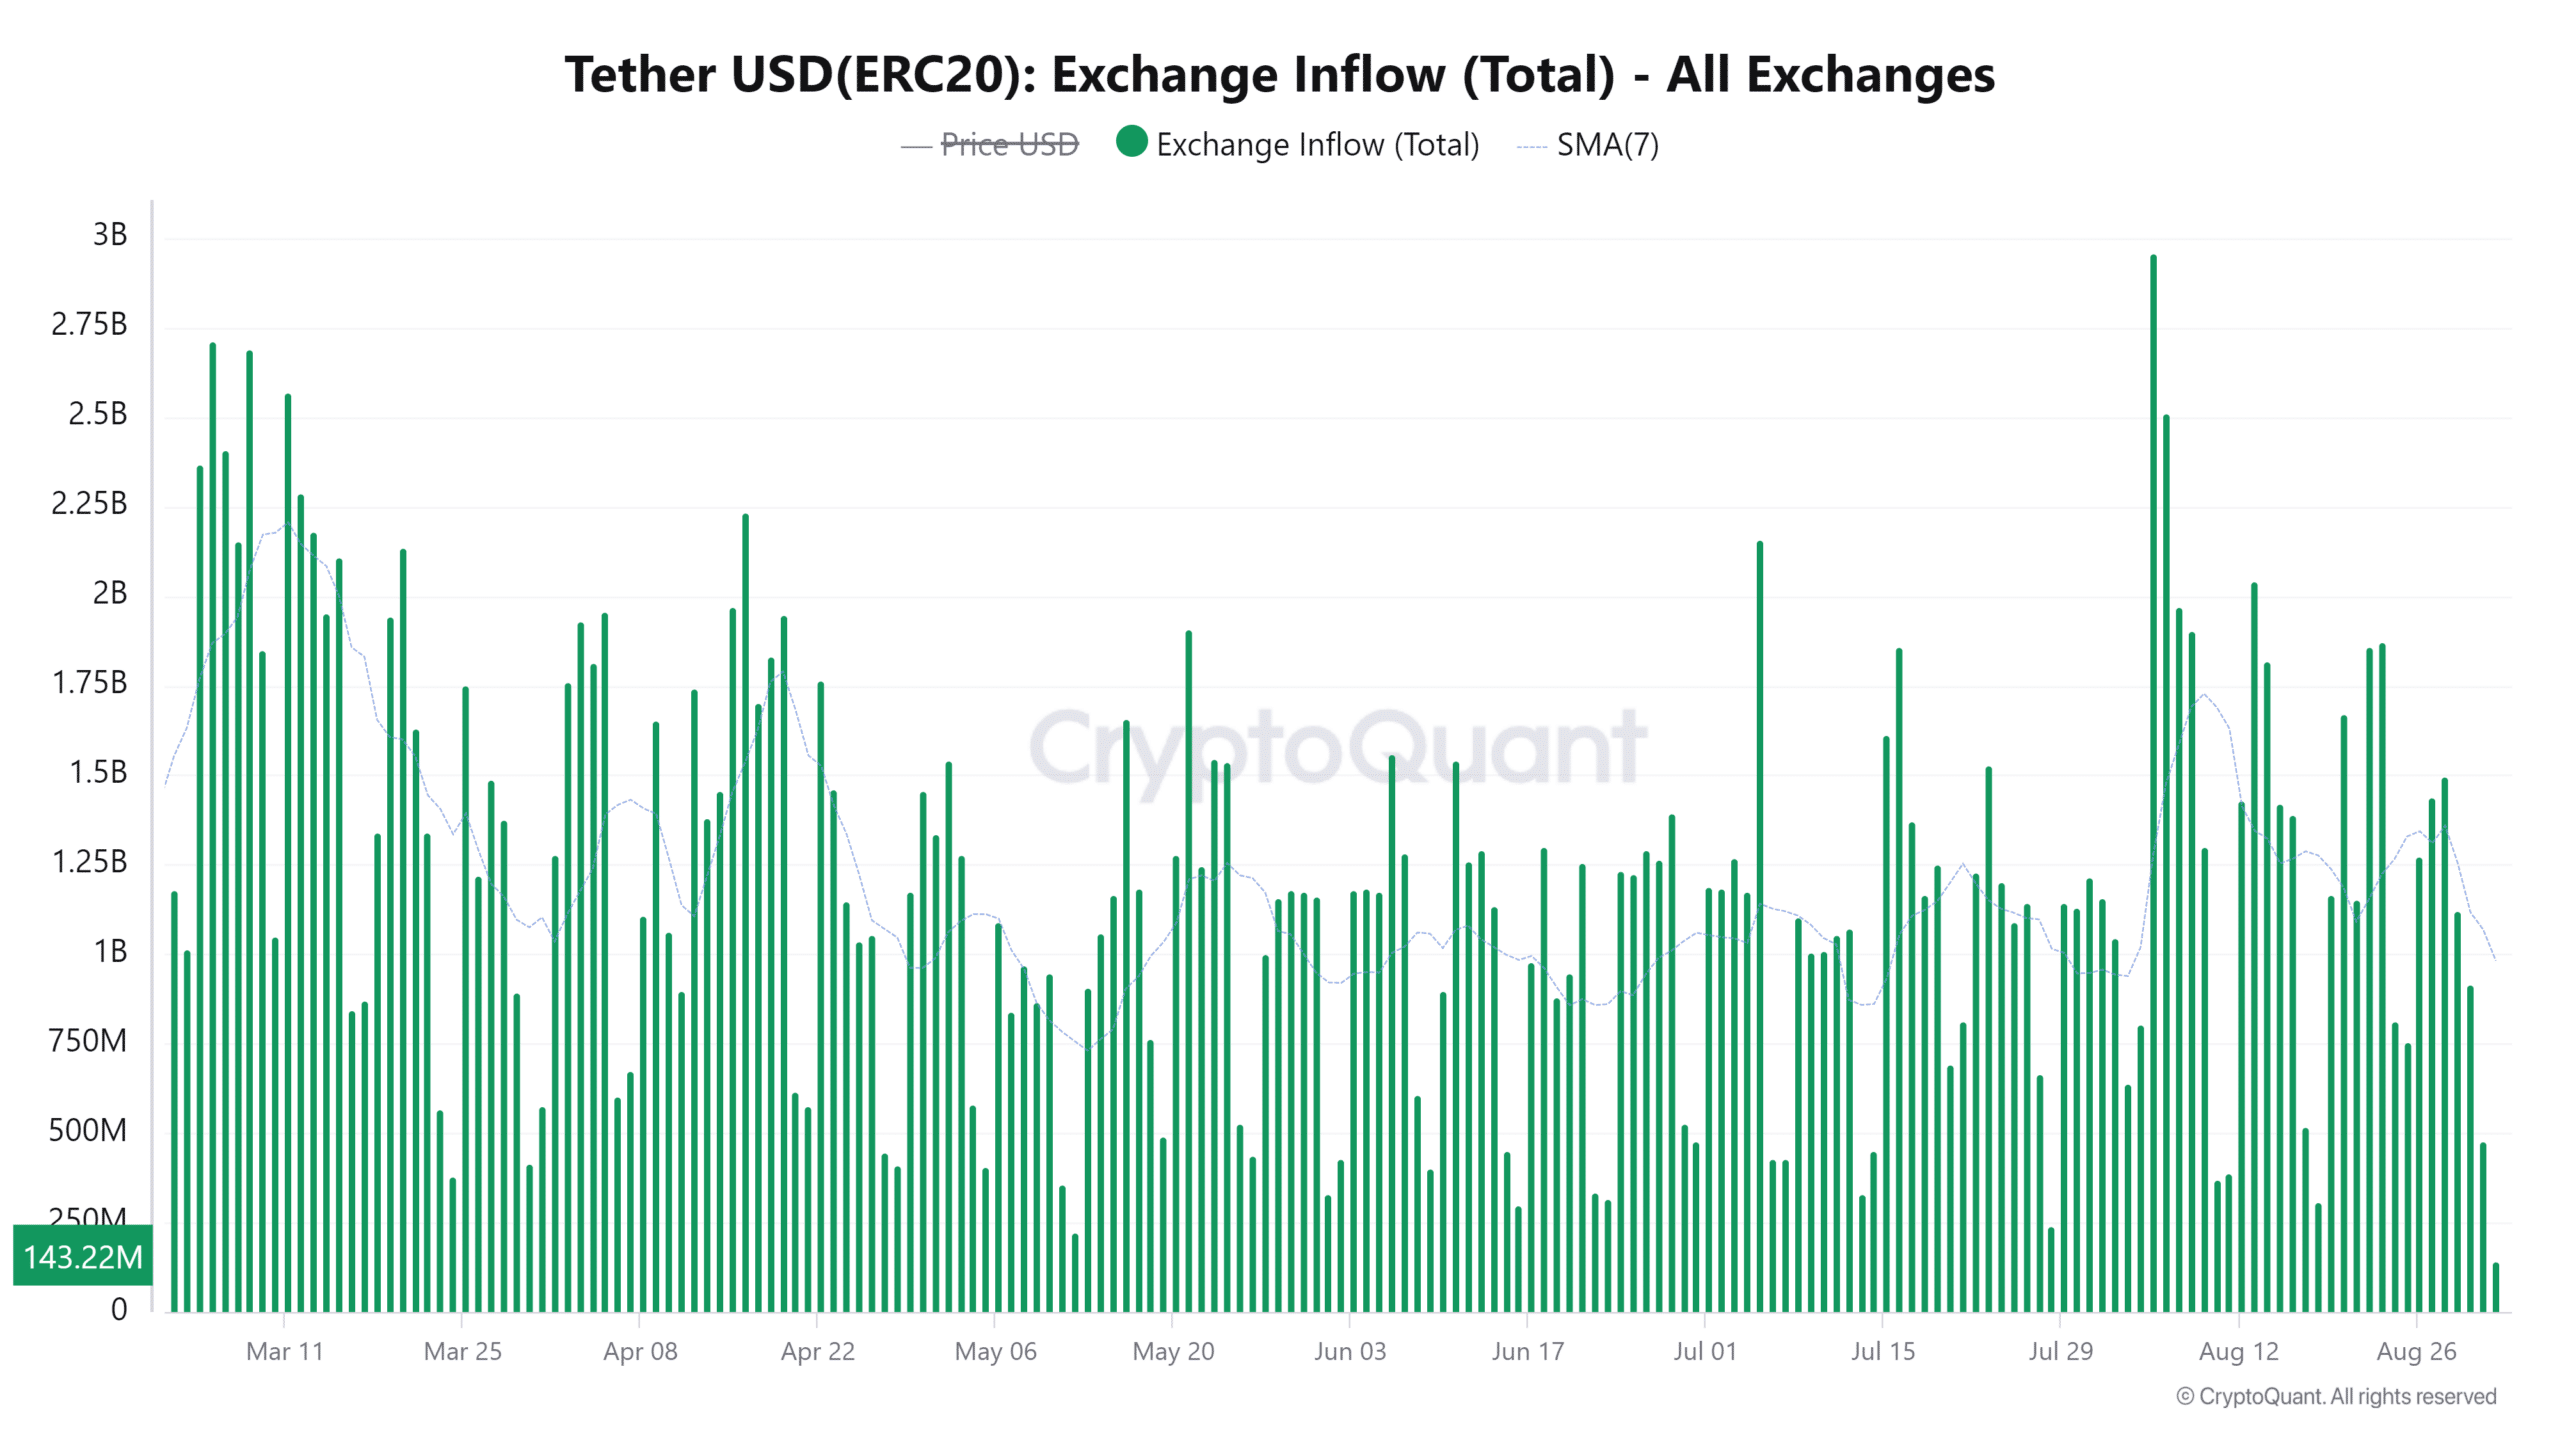
In a CryptoQuant Insights post, popular analyst theKriptolik noted that there has been a big decline in the inflows of Tether [USDT] to exchanges. AMBCrypto looked closely at the charts and found that the stablecoin exchange inflows were at a six-month low.

Source: CryptoQuant
When Bitcoin and the wider crypto market experience a large price drop, stablecoin inflows tend to ramp up by a large amount. This is indicative of buyers using the dip to add to their crypto holdings.
The most recent, sharp price drop occurred on 5 August when Bitcoin fell from $58.3k to $49k – A 15.9% drop. On that day, the stablecoin inflows stood at $2.9 billion.
Therefore, the fact that we saw unremarkable Tether exchange inflows when BTC fell below $60k can be interpreted as alarming news. It implied that smart money was waiting for a much deeper price drop before entering the market.
How low can the next move go?

Source: Hyblock
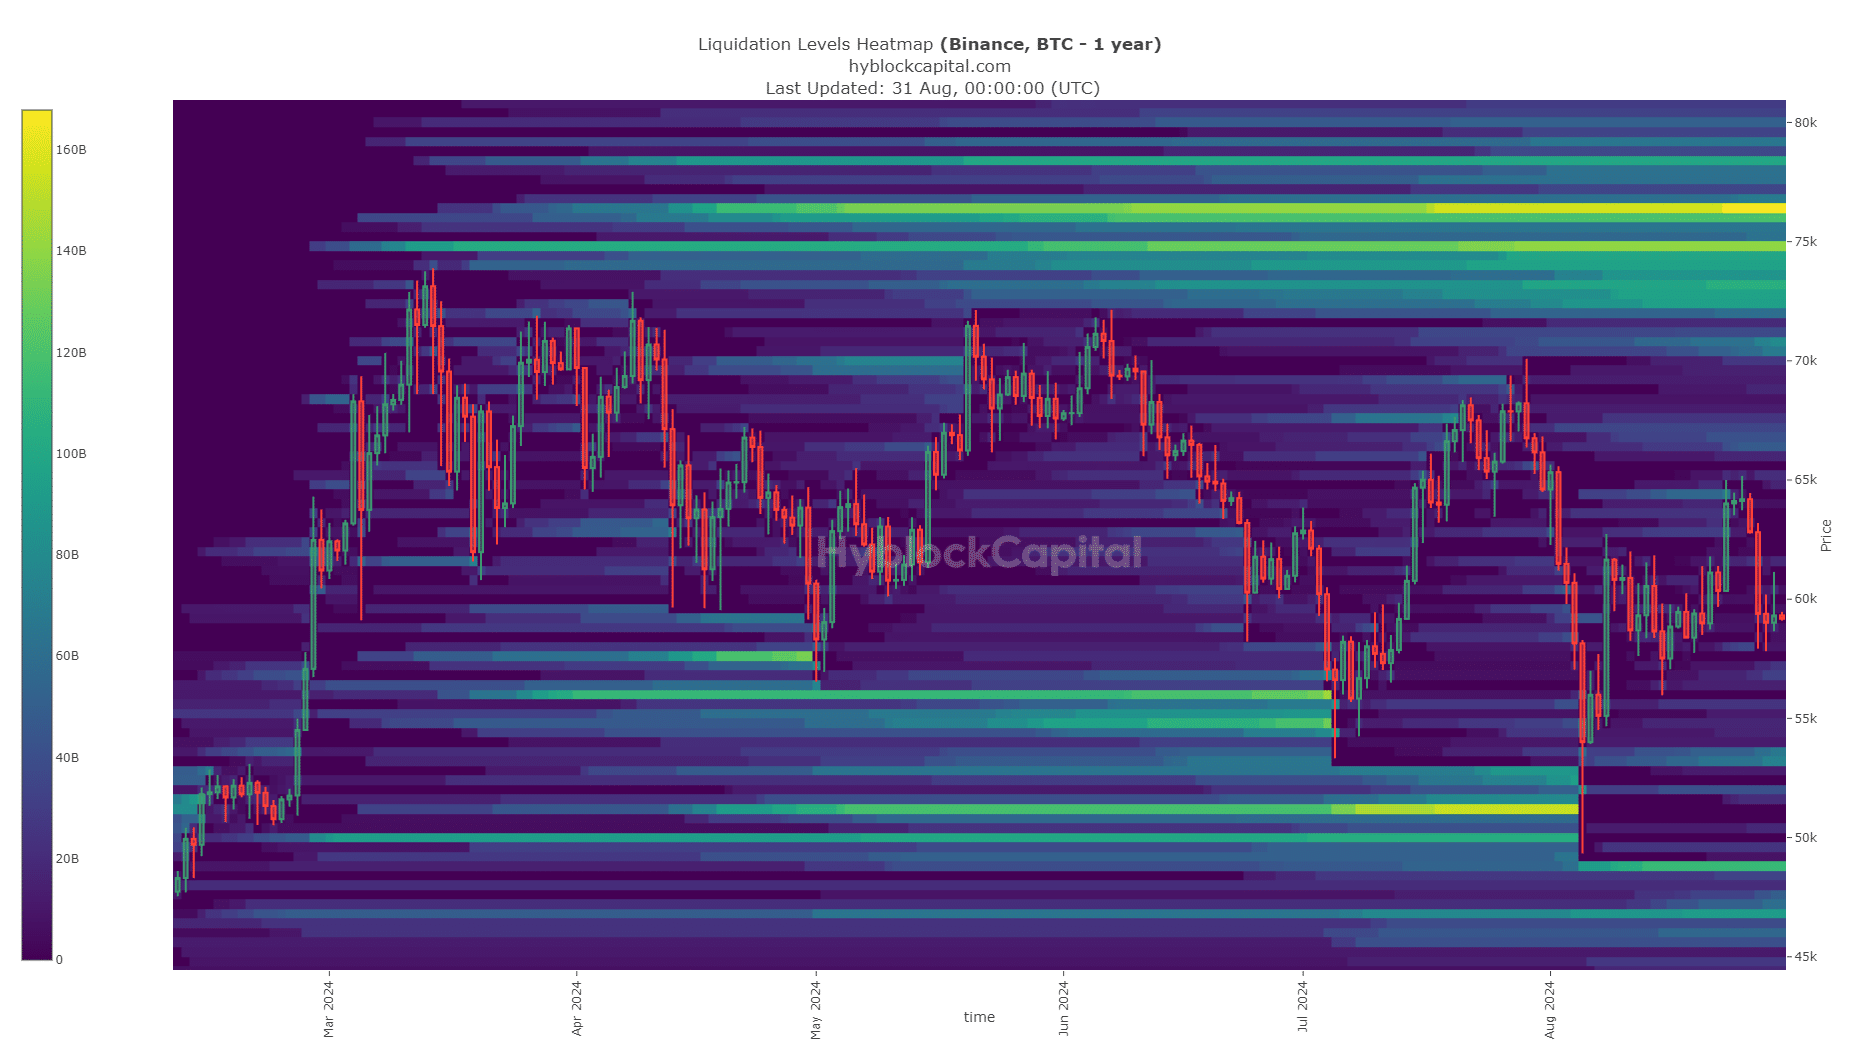
AMBCrypto’s analysis of the liquidation heatmap revealed that the next significant magnetic zones for Bitcoin would be at $48.8k and $46.6k. Also, there seemed to be a pocket of liquidity at $53.6k. These levels would be the targets for BTC in case of a price drop below $56k.
Read Bitcoin’s [BTC] Price Prediction 2024-25
A recent report warned that a plunge below $56k could lead to a much deeper correction. The bull-bear market cycle showed bearish dominance, and the findings from the Tether exchange flows reinforced this bearish view.
- Market sentiment was bearish over the last four months as BTC faced consistent rejections from local highs
- Selling pressure has not abated and could force another major southbound move
Bitcoin’s [BTC] 2024 halving occurred on 19 April. Since then, however, the promised bull run is yet to materialize. At press time, the Crypto Fear and Greed Index had a reading of 46 – A sign of neutral sentiment.
On the weekly chart, Bitcoin continues to present a bearish structure, with BTC setting lower highs and lower lows since late May. Insights into stablecoin flows reinforced the bearish view of the crypto-market over the coming weeks.
Suspicions of a deeper price correction
In a CryptoQuant Insights post, popular analyst theKriptolik noted that there has been a big decline in the inflows of Tether [USDT] to exchanges. AMBCrypto looked closely at the charts and found that the stablecoin exchange inflows were at a six-month low.

Source: CryptoQuant
When Bitcoin and the wider crypto market experience a large price drop, stablecoin inflows tend to ramp up by a large amount. This is indicative of buyers using the dip to add to their crypto holdings.
The most recent, sharp price drop occurred on 5 August when Bitcoin fell from $58.3k to $49k – A 15.9% drop. On that day, the stablecoin inflows stood at $2.9 billion.
Therefore, the fact that we saw unremarkable Tether exchange inflows when BTC fell below $60k can be interpreted as alarming news. It implied that smart money was waiting for a much deeper price drop before entering the market.
How low can the next move go?

Source: Hyblock
AMBCrypto’s analysis of the liquidation heatmap revealed that the next significant magnetic zones for Bitcoin would be at $48.8k and $46.6k. Also, there seemed to be a pocket of liquidity at $53.6k. These levels would be the targets for BTC in case of a price drop below $56k.
Read Bitcoin’s [BTC] Price Prediction 2024-25
A recent report warned that a plunge below $56k could lead to a much deeper correction. The bull-bear market cycle showed bearish dominance, and the findings from the Tether exchange flows reinforced this bearish view.


железобетонные изделия жби железобетонные изделия жби .
Wonderful beat I wish to apprentice while you amend your web site how could i subscribe for a blog web site The account aided me a acceptable deal I had been a little bit acquainted of this your broadcast provided bright clear idea
Hello there, simply become alert to your weblog thru Google, and found that it’s really informative. I am gonna be careful for brussels. I’ll be grateful in case you proceed this in future. Numerous other folks will probably be benefited out of your writing. Cheers!
Undeniably imagine that that you stated. Your favorite justification appeared to be on the web the easiest thing to take note of. I say to you, I definitely get irked whilst people consider issues that they just don’t understand about. You controlled to hit the nail upon the top and outlined out the whole thing without having side effect , folks could take a signal. Will probably be again to get more. Thank you
Lovely site! I am loving it!! Will be back later to read some more. I am bookmarking your feeds also
how to get generic clomiphene tablets can i purchase generic clomid pills where can i buy generic clomiphene without prescription get generic clomid prices can i buy generic clomiphene without dr prescription order cheap clomiphene can i buy generic clomiphene
More posts like this would create the online elbow-room more useful.
More posts like this would prosper the blogosphere more useful.
rybelsus 14mg uk – buy cyproheptadine tablets buy generic periactin
order domperidone pills – sumycin order buy cyclobenzaprine generic
Thanks for the update, can I set it up so I receive an alert email when you make a fresh post?
order augmentin 375mg – https://atbioinfo.com/ acillin ca
esomeprazole 20mg cheap – nexiumtous buy esomeprazole generic
medex generic – https://coumamide.com/ cost cozaar 50mg
Thanks for all your efforts that you have put in this. very interesting info .
meloxicam where to buy – swelling buy generic meloxicam online
buy generic prednisone 10mg – corticosteroid order prednisone 10mg online cheap
herbal ed pills – ed pills that really work buy generic ed pills for sale
cheap amoxil generic – comba moxi amoxil brand
buy fluconazole sale – https://gpdifluca.com/ order fluconazole pills
buy cenforce 100mg online – https://cenforcers.com/ purchase cenforce sale
buy liquid tadalafil online – fast ciltad non prescription cialis
ranitidine sale – site purchase ranitidine pills
cialis max dose – https://strongtadafl.com/ cheaper alternative to cialis
viagra buy online generic – site sildenafil tablet 50 mg
More posts like this would make the blogosphere more useful. sitio web
I am actually happy to glance at this blog posts which consists of tons of useful facts, thanks representing providing such data. order isotretinoin online
This is a question which is in to my heart… Diverse thanks! Quite where can I upon the connection details an eye to questions? https://ursxdol.com/provigil-gn-pill-cnt/
Facts blog you procure here.. It’s intricate to find high quality article like yours these days. I truly appreciate individuals like you! Go through guardianship!! https://prohnrg.com/product/get-allopurinol-pills/
You are my breathing in, I possess few web logs and occasionally run out from to post .
More articles like this would pretence of the blogosphere richer. https://ondactone.com/product/domperidone/
The reconditeness in this piece is exceptional.
buy zofran
Hello. Great job. I did not anticipate this. This is a excellent story. Thanks!
Thanks recompense sharing. It’s outstrip quality. http://sols9.com/batheo/Forum/User-Avpicp
I really appreciate this post. I¦ve been looking everywhere for this! Thank goodness I found it on Bing. You’ve made my day! Thx again
Absolutely written content material, Really enjoyed looking through.
I gotta favorite this site it seems handy very helpful
dapagliflozin 10mg generic – site order forxiga 10 mg for sale
orlistat tablet – order orlistat pills buy orlistat 60mg generic