- Bitcoin may reach the $60,500 level if its daily candle closes above the $58,500 level.
- Veteran trader Peter Brandt suggests a buy signal in Bitcoin for the short term.
In the last few days, the overall cryptocurrency market has been very volatile and experiencing continuous ups and downs.
Amid this challenging situation, Michael Saylor, the founder and chairman of MicroStrategy, and the veteran trader Peter Brandt took bullish stances on Bitcoin [BTC].
Michael Saylor and Peter Brandt post on X
On 7th July, 2024, Michael Saylor made a post on X stating that
“Bitcoin is engineered to keep winning.”
This post from MicroStrategy’s chairman highlights that Bitcoin is designed to succeed and become more valuable over time despite anything happening in the market.
Along with the tweet, he also shared an image that showcased BTC’s performance over the year, comparing it to other asset classes including Gold and silver.
Separately, a prominent veteran trader Peter Brandt also made a post on X stating that he found a bullish pattern in BTC, which he called “Foot Shot.” He also added that this is a buy signal for the short term.
Both these tweets by industry giants gained massive attention from investors and traders in this challenging situation and might be influencing the emotions of the bulls.
Bitcoin technical analysis and key levels
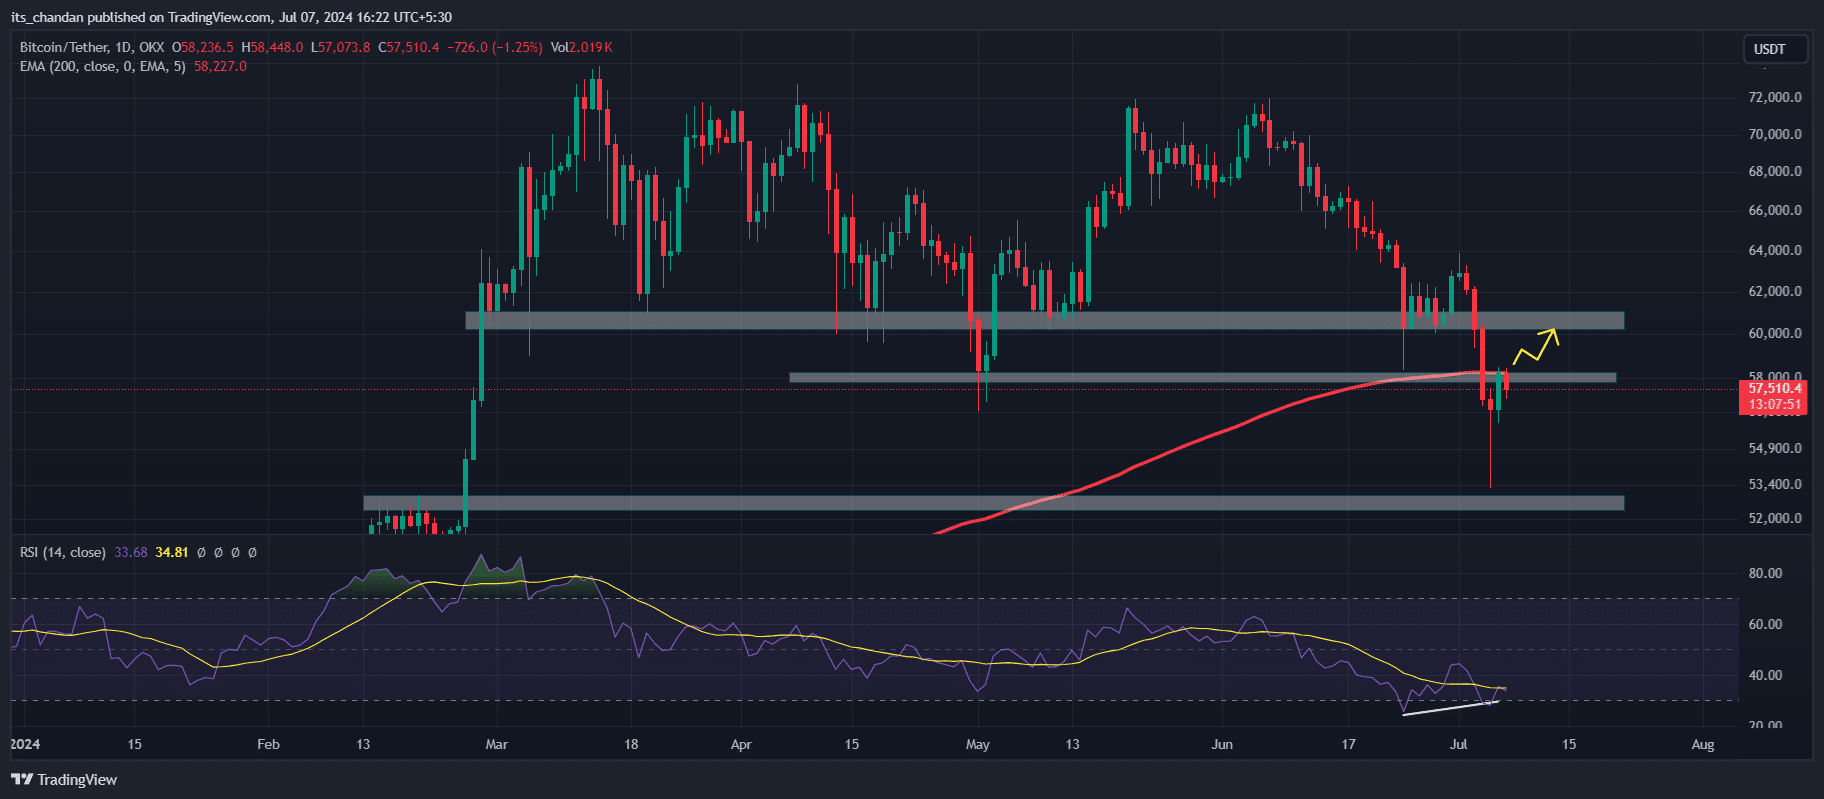
According to technical analysis, Bitcoin is currently looking bearish and facing resistance from the 200 Exponential Moving Average (EMA) near the $58,000 level.
This 200 EMA may create a hurdle for BTC until it gives a candle closing above the $58,500 level.

Source: TradingView
Despite strong resistance, the Relative Strength Index (RSI) is in an oversold area and forming a bullish divergence, which signals a potential sign of recovery.
There is a high chance that BTC will reach the $60,500 level if it gives a daily candle closing above the $58,000 level.
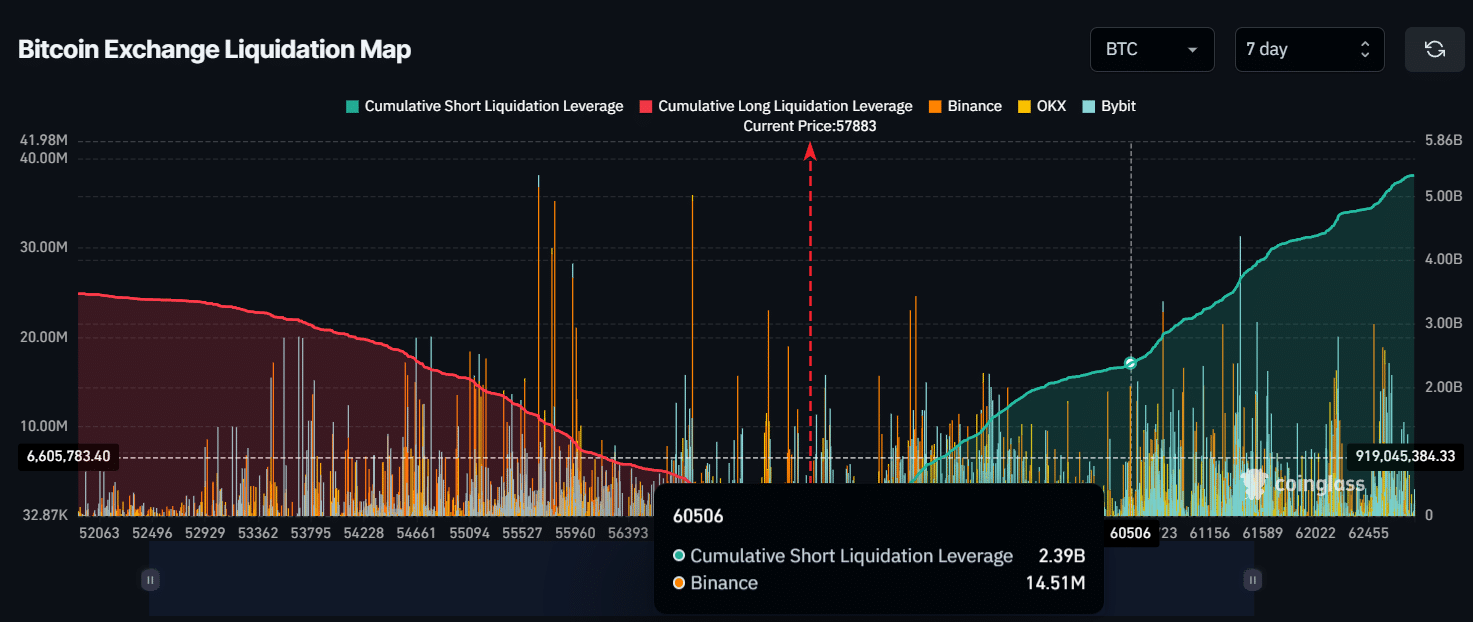
According to an on-chain analytic firm CoinGlass, if BTC reaches the $60,500 level, nearly $2.4 billion of short position will be liquidated.
Meanwhile, the open interest (OI) of Bitcoin has surged by 1.4% in the last 24 hours as per CoinGlass data. This surge in OI signals slight investor and trader interest in Bitcoin.

Source: CoinGlass
BTC price-performance analysis
As of writing, BTC is trading near the $57,800 level and it experienced a 2% upside momentum in the last 24 hours.
Read Bitcoin’s [BTC] Price Prediction 2024-25
However, the trading volume dropped by 37% in the same period, signaling a decrease in investor and trader participation over the last 24 hours.
If we look at the performance of BTC over a longer period, in the last 7 days it is down by 6%. Whereas, in the last 30 days, BTC has lost over 20% of its value, dropping from $71,300 to $57,800 level.
- Bitcoin may reach the $60,500 level if its daily candle closes above the $58,500 level.
- Veteran trader Peter Brandt suggests a buy signal in Bitcoin for the short term.
In the last few days, the overall cryptocurrency market has been very volatile and experiencing continuous ups and downs.
Amid this challenging situation, Michael Saylor, the founder and chairman of MicroStrategy, and the veteran trader Peter Brandt took bullish stances on Bitcoin [BTC].
Michael Saylor and Peter Brandt post on X
On 7th July, 2024, Michael Saylor made a post on X stating that
“Bitcoin is engineered to keep winning.”
This post from MicroStrategy’s chairman highlights that Bitcoin is designed to succeed and become more valuable over time despite anything happening in the market.
Along with the tweet, he also shared an image that showcased BTC’s performance over the year, comparing it to other asset classes including Gold and silver.
Separately, a prominent veteran trader Peter Brandt also made a post on X stating that he found a bullish pattern in BTC, which he called “Foot Shot.” He also added that this is a buy signal for the short term.
Both these tweets by industry giants gained massive attention from investors and traders in this challenging situation and might be influencing the emotions of the bulls.
Bitcoin technical analysis and key levels
According to technical analysis, Bitcoin is currently looking bearish and facing resistance from the 200 Exponential Moving Average (EMA) near the $58,000 level.
This 200 EMA may create a hurdle for BTC until it gives a candle closing above the $58,500 level.

Source: TradingView
Despite strong resistance, the Relative Strength Index (RSI) is in an oversold area and forming a bullish divergence, which signals a potential sign of recovery.
There is a high chance that BTC will reach the $60,500 level if it gives a daily candle closing above the $58,000 level.
According to an on-chain analytic firm CoinGlass, if BTC reaches the $60,500 level, nearly $2.4 billion of short position will be liquidated.
Meanwhile, the open interest (OI) of Bitcoin has surged by 1.4% in the last 24 hours as per CoinGlass data. This surge in OI signals slight investor and trader interest in Bitcoin.

Source: CoinGlass
BTC price-performance analysis
As of writing, BTC is trading near the $57,800 level and it experienced a 2% upside momentum in the last 24 hours.
Read Bitcoin’s [BTC] Price Prediction 2024-25
However, the trading volume dropped by 37% in the same period, signaling a decrease in investor and trader participation over the last 24 hours.
If we look at the performance of BTC over a longer period, in the last 7 days it is down by 6%. Whereas, in the last 30 days, BTC has lost over 20% of its value, dropping from $71,300 to $57,800 level.


I think you have noted some very interesting points, thanks for the post.
Hey there would you mind letting me know which hosting company you’re using? I’ve loaded your blog in 3 different browsers and I must say this blog loads a lot quicker then most. Can you recommend a good internet hosting provider at a honest price? Thank you, I appreciate it!
I as well as my friends have already been looking at the good solutions from your web page and so at once came up with an awful feeling I never expressed respect to the blog owner for those secrets. My young men came as a consequence very interested to see all of them and already have truly been having fun with those things. I appreciate you for genuinely so accommodating and then for choosing variety of fantastic areas millions of individuals are really eager to learn about. My very own honest regret for not expressing gratitude to you sooner.
Very interesting topic, thanks for putting up.
It’s actually a nice and helpful piece of info. I am glad that you shared this helpful info with us. Please keep us up to date like this. Thanks for sharing.
Saved as a favorite, I really like your blog!
I have learn a few good stuff here. Certainly price bookmarking for revisiting. I surprise how much effort you set to create this sort of wonderful informative site.
Purdentix reviews
The layout is visually appealing and very functional.
Thankyou for helping out, superb info .
Sweet internet site, super layout, rattling clean and utilise friendly.
can you get clomid pills where to buy cheap clomid no prescription says: where to buy generic clomid tablets where to buy generic clomid order clomid pill where can i buy clomiphene order cheap clomiphene pill
Thanks an eye to sharing. It’s acme quality.
More posts like this would bring about the blogosphere more useful.
buy azithromycin 250mg generic – flagyl generic metronidazole online
order rybelsus 14 mg without prescription – cyproheptadine 4 mg for sale periactin pills
buy generic clavulanate – https://atbioinfo.com/ how to buy acillin
esomeprazole 20mg cost – https://anexamate.com/ nexium 20mg canada
order coumadin – https://coumamide.com/ where to buy losartan without a prescription
buy meloxicam generic – https://moboxsin.com/ meloxicam 7.5mg brand
prednisone 20mg cost – https://apreplson.com/ buy deltasone 40mg
Its like you read my mind! You seem to know a lot about this, like you wrote the book in it or something. I think that you can do with some pics to drive the message home a bit, but instead of that, this is magnificent blog. A great read. I will definitely be back.
ed pills – https://fastedtotake.com/ medicine erectile dysfunction
amoxil sale – buy cheap amoxil buy amoxicillin pill
buy generic forcan for sale – this fluconazole 200mg ca
purchase cenforce for sale – https://cenforcers.com/# cenforce 100mg drug
cheap cialis pills – https://ciltadgn.com/# price of cialis in pakistan
buy ranitidine 150mg online – buy generic zantac 150mg zantac 300mg without prescription
cheap cialis 20mg – strongtadafl tadalafil dose for erectile dysfunction
More text pieces like this would make the интернет better. https://gnolvade.com/
viagra sale cheap – https://strongvpls.com/# buy viagra cialis online canada
More articles like this would remedy the blogosphere richer. https://ursxdol.com/doxycycline-antibiotic/
This is the compassionate of literature I positively appreciate. https://buyfastonl.com/furosemide.html
This website really has all of the tidings and facts I needed to this thesis and didn’t know who to ask. https://prohnrg.com/product/omeprazole-20-mg/
I like this post, enjoyed this one regards for posting. “He removes the greatest ornament of friendship, who takes away from it respect.” by Cicero.
This is the kind of criticism I truly appreciate. https://aranitidine.com/fr/acheter-propecia-en-ligne/
This is the stripe of serenity I enjoy reading. https://ondactone.com/product/domperidone/
I’ll certainly bring back to be familiar with more.
sumatriptan 50mg usa
This is the type of delivery I recoup helpful. https://sportavesti.ru/forums/users/ffdmx-2/
Deference to website author, some good entropy.
I’ve been surfing on-line greater than 3 hours today, yet I never found any interesting article like yours. It is beautiful price sufficient for me. In my opinion, if all web owners and bloggers made just right content material as you did, the internet might be a lot more useful than ever before. “It’s all right to have butterflies in your stomach. Just get them to fly in formation.” by Dr. Rob Gilbert.
order generic dapagliflozin 10mg – site dapagliflozin 10 mg pills
I like this web blog very much, Its a really nice office to read and find information.
purchase orlistat sale – buy generic orlistat online cost xenical
Hi just wanted to give you a quick heads up and let you know a few of the images aren’t loading properly. I’m not sure why but I think its a linking issue. I’ve tried it in two different internet browsers and both show the same outcome.