


- Over the past 48 hours, Bitcoin’s liquidation has been below $50 million.
- BTC has held the $60,000 price range.
The past week witnessed a significant decline in Bitcoin’s [BTC] price as it slipped below the $60,000 threshold.
This downturn resulted in a surge of both short and long liquidations, causing some positions to be wiped out.
However, there appears to be a recent equilibrium between price movement and liquidations, suggesting a stabilization in the market.
Bitcoin liquidation declines
AMBCrypto’s analysis of the Bitcoin liquidation chart on Coinglass revealed a surge in liquidation on the 30th of April and the 1st of May.
On the 30th of April, the liquidation volume was over $113 million, with long positions accounting for over $95 million.
This trend continued into the 1st of May, with the liquidation volume surpassing $136 million and long positions representing over $100 million.
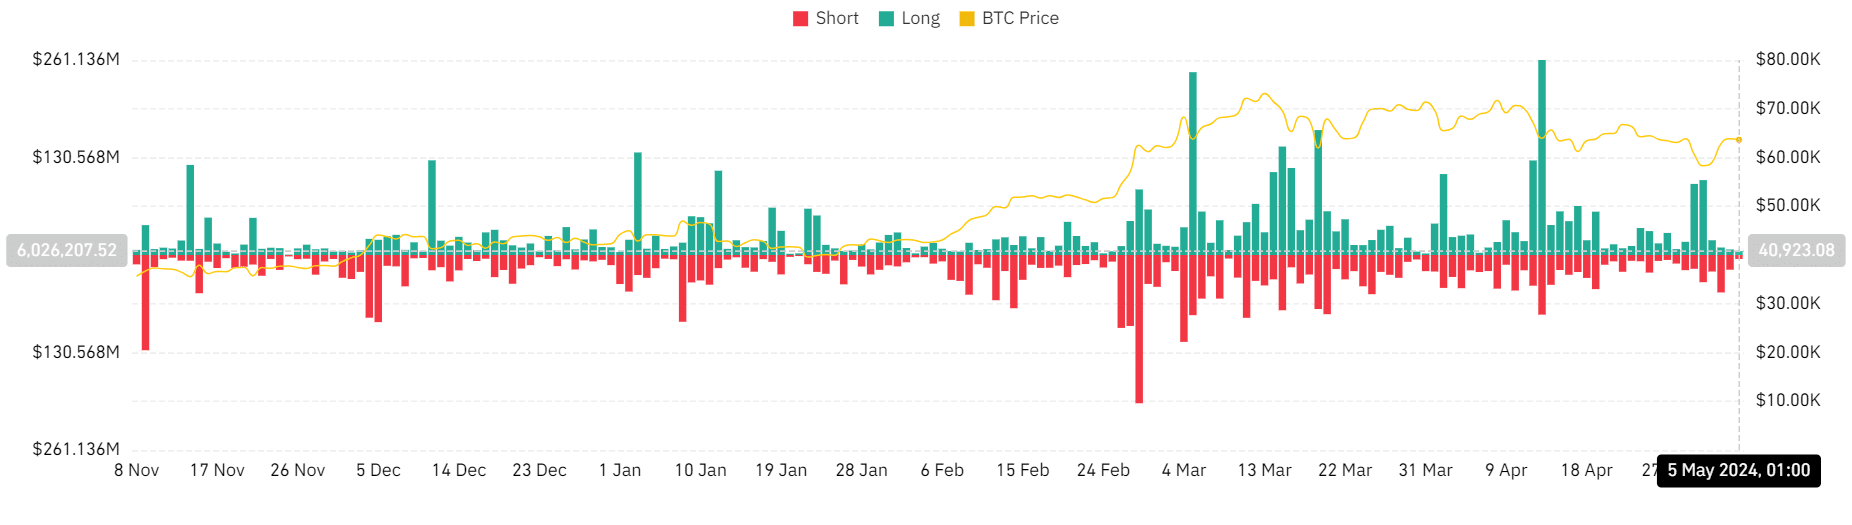
Source: Coinglass
However, as the price of BTC rebounded and reclaimed the $60,000 price range, the liquidation volume began to decline.
Subsequently, since the 2nd of May, the liquidation volume has only exceeded $50 million once. The latest data shows that the liquidation volume was around $10 million at press time.
Bitcoin maintains trend above $60,000
AMBCrypto’s look at Bitcoin’s price trend on the daily timeframe chart indicated a notable rebound following its declines on the 30th of April and the 1st of May, during which it experienced an 8% loss over 48 hours.
AMBCrypto’s chart analysis revealed consecutive uptrends beginning on the 2nd of May, with a notable increase of over 6% observed on the 3rd of May.
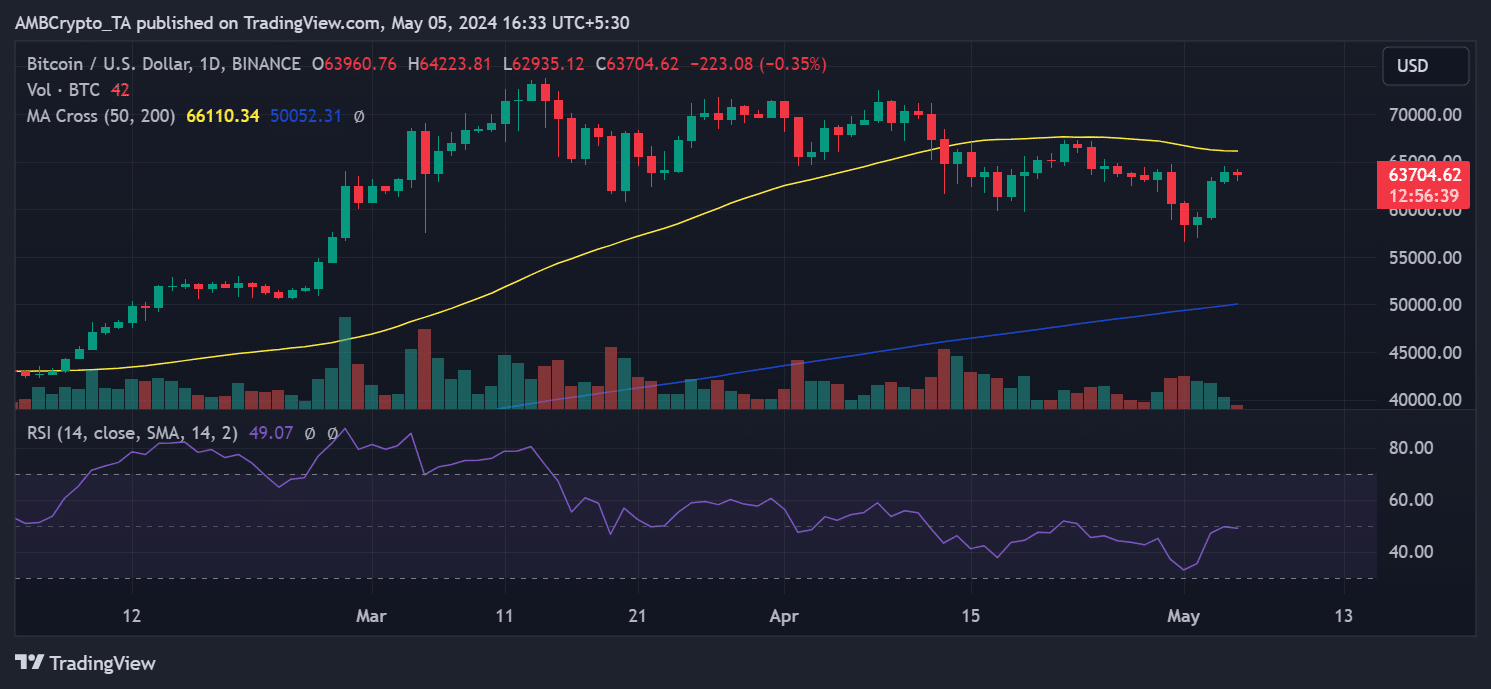
Source: TradingView
By the end of trading on the 4th of May, Bitcoin had increased by over 1%, reaching approximately $63,900.
As of this writing, it was trading with a decrease of less than 1%, but it still maintained the $63,000 price range.
Despite this rebound, its short moving average (yellow line) continued to serve as resistance at around $66,000.
Strained profit for 30-days holders
Bitcoin’s 30-day Market Value Realized Value ratio (MVRV) indicated that holders experienced a period of being underwater for much of April.
The chart revealed that BTC remained below zero and reached its lowest point in months, dropping to -9.71%.
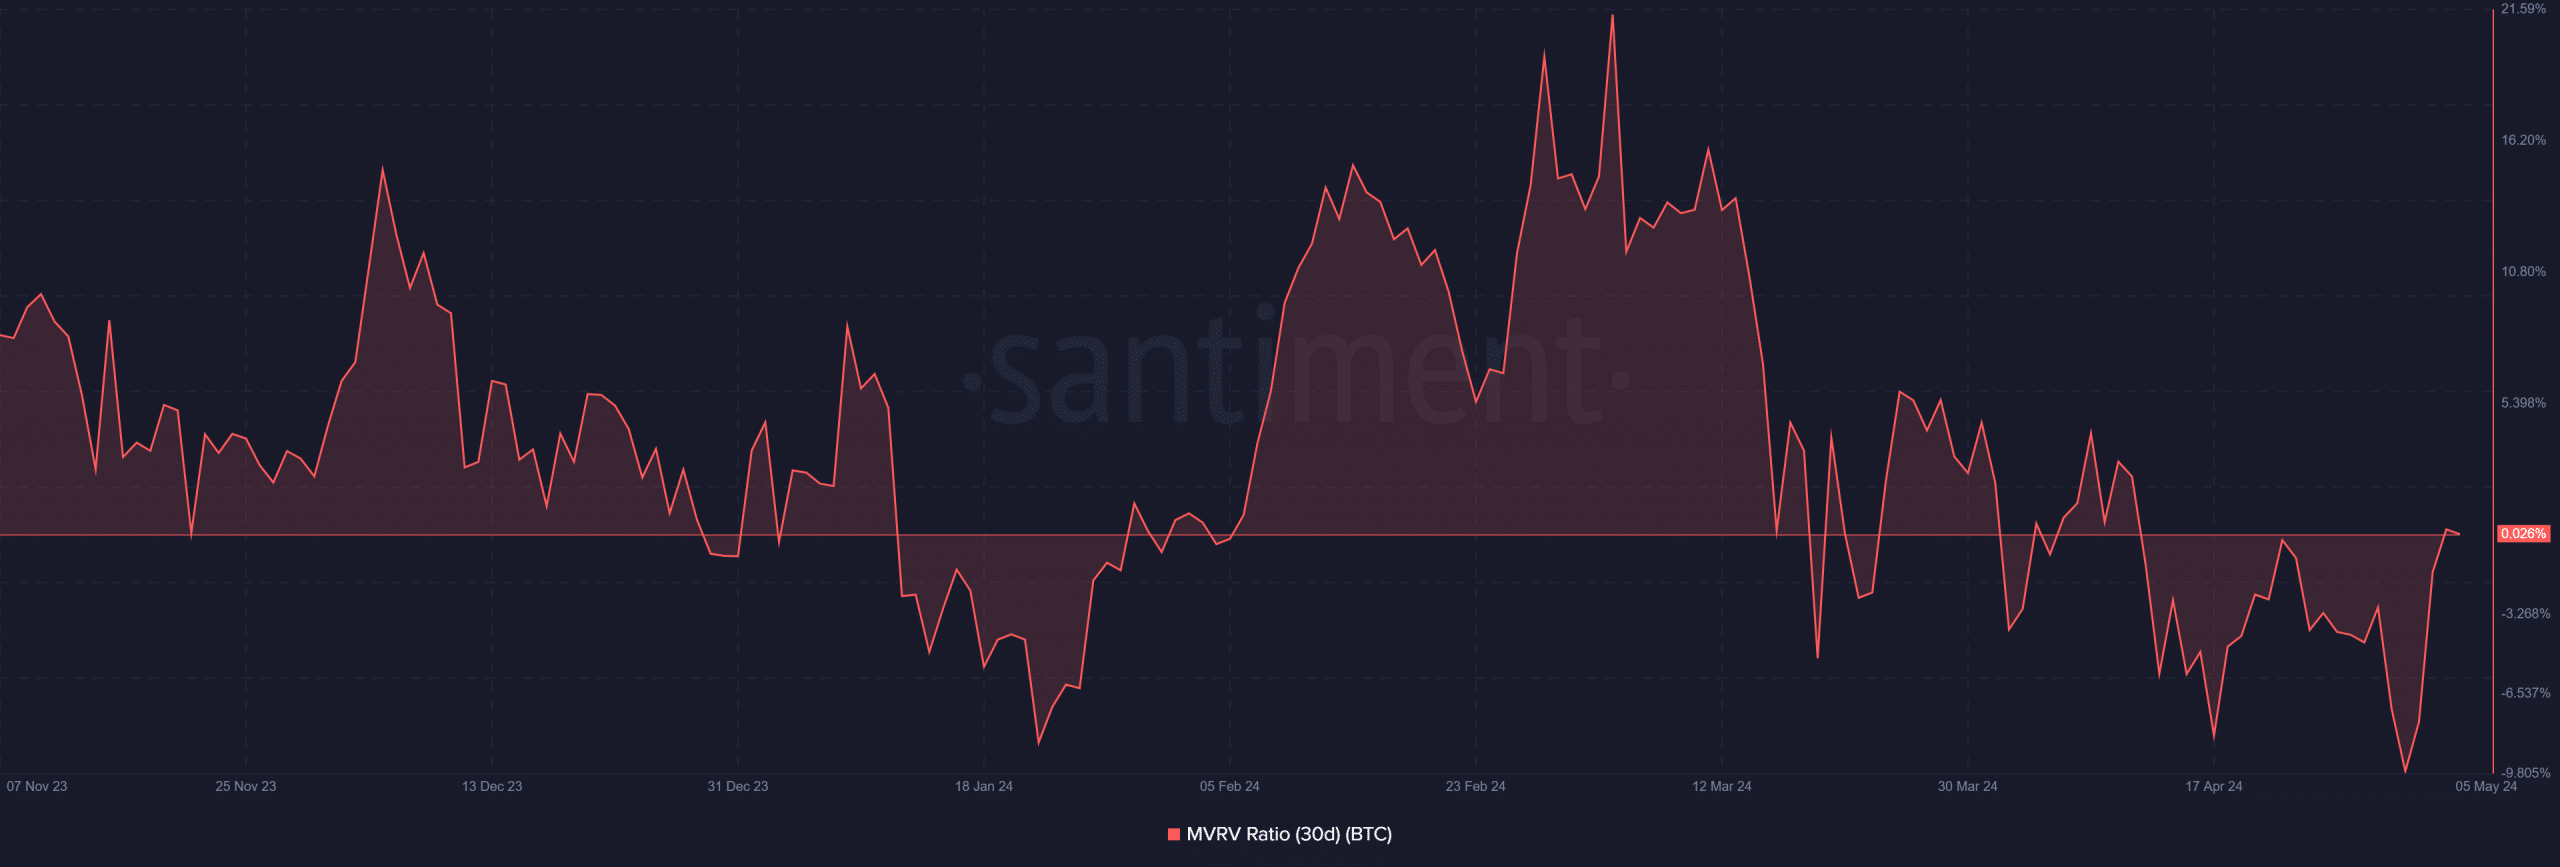
Source: Santiment
Read Bitcoin’s [BTC] Price Prediction 2024-25
However, at the time of this analysis, the MVRV has slightly risen above zero, hovering around 0.026%.
This suggests that holders within this timeframe are profiting, likely due to the recent slight increase in BTC’s price.
- Over the past 48 hours, Bitcoin’s liquidation has been below $50 million.
- BTC has held the $60,000 price range.
The past week witnessed a significant decline in Bitcoin’s [BTC] price as it slipped below the $60,000 threshold.
This downturn resulted in a surge of both short and long liquidations, causing some positions to be wiped out.
However, there appears to be a recent equilibrium between price movement and liquidations, suggesting a stabilization in the market.
Bitcoin liquidation declines
AMBCrypto’s analysis of the Bitcoin liquidation chart on Coinglass revealed a surge in liquidation on the 30th of April and the 1st of May.
On the 30th of April, the liquidation volume was over $113 million, with long positions accounting for over $95 million.
This trend continued into the 1st of May, with the liquidation volume surpassing $136 million and long positions representing over $100 million.
Source: Coinglass
However, as the price of BTC rebounded and reclaimed the $60,000 price range, the liquidation volume began to decline.
Subsequently, since the 2nd of May, the liquidation volume has only exceeded $50 million once. The latest data shows that the liquidation volume was around $10 million at press time.
Bitcoin maintains trend above $60,000
AMBCrypto’s look at Bitcoin’s price trend on the daily timeframe chart indicated a notable rebound following its declines on the 30th of April and the 1st of May, during which it experienced an 8% loss over 48 hours.
AMBCrypto’s chart analysis revealed consecutive uptrends beginning on the 2nd of May, with a notable increase of over 6% observed on the 3rd of May.
Source: TradingView
By the end of trading on the 4th of May, Bitcoin had increased by over 1%, reaching approximately $63,900.
As of this writing, it was trading with a decrease of less than 1%, but it still maintained the $63,000 price range.
Despite this rebound, its short moving average (yellow line) continued to serve as resistance at around $66,000.
Strained profit for 30-days holders
Bitcoin’s 30-day Market Value Realized Value ratio (MVRV) indicated that holders experienced a period of being underwater for much of April.
The chart revealed that BTC remained below zero and reached its lowest point in months, dropping to -9.71%.
Source: Santiment
Read Bitcoin’s [BTC] Price Prediction 2024-25
However, at the time of this analysis, the MVRV has slightly risen above zero, hovering around 0.026%.
This suggests that holders within this timeframe are profiting, likely due to the recent slight increase in BTC’s price.


![As Bitcoin [BTC] struggles to stay above $30k, investors turn towards…](https://coininsights.com/wp-content/uploads/2023/05/glassnode-studio_btc-addresses-with-balance-1k-11.png)
I’m curious to find out what blog platform you’re working with? I’m experiencing some small security issues with my latest website and I’d like to find something more safeguarded. Do you have any recommendations?
I consider something truly special in this website .
cost of generic clomiphene how can i get generic clomiphene price where to get generic clomid tablets can you buy cheap clomid pills how to get cheap clomid pill can i purchase clomid online cheap clomiphene prices
This is the big-hearted of criticism I in fact appreciate.
More posts like this would force the blogosphere more useful.
zithromax 500mg generic – floxin order online metronidazole 200mg cost
buy semaglutide pills for sale – order semaglutide 14 mg pills periactin 4 mg pill
This website is mostly a walk-by means of for all of the info you wished about this and didn’t know who to ask. Glimpse here, and you’ll definitely uncover it.
buy generic motilium 10mg – sumycin 250mg cost order cyclobenzaprine generic
amoxiclav online – atbioinfo buy generic acillin online
esomeprazole 20mg capsules – https://anexamate.com/ esomeprazole generic
buy medex for sale – https://coumamide.com/ cheap cozaar
mobic 7.5mg ca – https://moboxsin.com/ meloxicam pill
generic prednisone 5mg – https://apreplson.com/ cost prednisone 5mg
My programmer is trying to convince me to move to .net from PHP. I have always disliked the idea because of the costs. But he’s tryiong none the less. I’ve been using WordPress on a variety of websites for about a year and am concerned about switching to another platform. I have heard great things about blogengine.net. Is there a way I can import all my wordpress content into it? Any kind of help would be greatly appreciated!
best ed pills non prescription – site can you buy ed pills online
brand amoxicillin – https://combamoxi.com/ cheap amoxil for sale
cheap diflucan 100mg – https://gpdifluca.com/ diflucan 200mg drug
buy escitalopram 20mg pill – escita pro buy lexapro for sale
cenforce 100mg without prescription – https://cenforcers.com/# purchase cenforce pills
canadian no prescription pharmacy cialis – generic cialis tadalafil 20mg india is cialis covered by insurance
cialis for sale in canada – https://strongtadafl.com/# typical cialis prescription strength
purchase zantac pill – https://aranitidine.com/# order zantac 300mg pill
viagra sale women – viagra for sale birmingham buy viagra with paypal
I am actually happy to glitter at this blog posts which consists of tons of worthwhile facts, thanks object of providing such data. provigil comprar espaГ±a
This website absolutely has all of the low-down and facts I needed to this case and didn’t identify who to ask. https://prohnrg.com/product/priligy-dapoxetine-pills/
Great blog here! Also your web site loads up fast! What host are you using? Can I get your affiliate link to your host? I wish my web site loaded up as quickly as yours lol
With thanks. Loads of expertise! https://aranitidine.com/fr/sibelium/
This website positively has all of the information and facts I needed to this case and didn’t know who to ask. https://ondactone.com/simvastatin/
The thoroughness in this piece is noteworthy.
buy propranolol without a prescription
I want to get across my affection for your generosity for people that should have help on that area. Your very own commitment to getting the message across became pretty effective and has continually permitted others just like me to attain their endeavors. Your warm and friendly guideline entails a great deal to me and further more to my office colleagues. Many thanks; from everyone of us.
I am extremely impressed with your writing talents as smartly as with the layout for your blog. Is that this a paid subject or did you modify it yourself? Either way stay up the excellent high quality writing, it’s uncommon to peer a nice blog like this one these days..
More posts like this would prosper the blogosphere more useful. https://lzdsxxb.com/home.php?mod=space&uid=5065840
I like this weblog very much so much good info .
Very interesting info!Perfect just what I was looking for!
buy forxiga 10 mg pills – https://janozin.com/# buy dapagliflozin cheap
I discovered your blog site on google and check a few of your early posts. Continue to keep up the very good operate. I just additional up your RSS feed to my MSN News Reader. Seeking forward to reading more from you later on!…
I love your blog.. very nice colors & theme. Did you create this website yourself? Plz reply back as I’m looking to create my own blog and would like to know wheere u got this from. thanks
xenical buy online – order xenical without prescription xenical 60mg brand
Good blog you procure here.. It’s hard to espy great worth belles-lettres like yours these days. I really comprehend individuals like you! Go through vigilance!! http://www.predictive-datascience.com/forum/member.php?action=profile&uid=46021
There’s noticeably a bundle to find out about this. I assume you made certain nice factors in features also.
Very interesting topic, thanks for posting.