- Despite corrections, Bitcoin’s price has remained firmly around the $90,000 zone
- Crypto’s price could hike well beyond this level soon
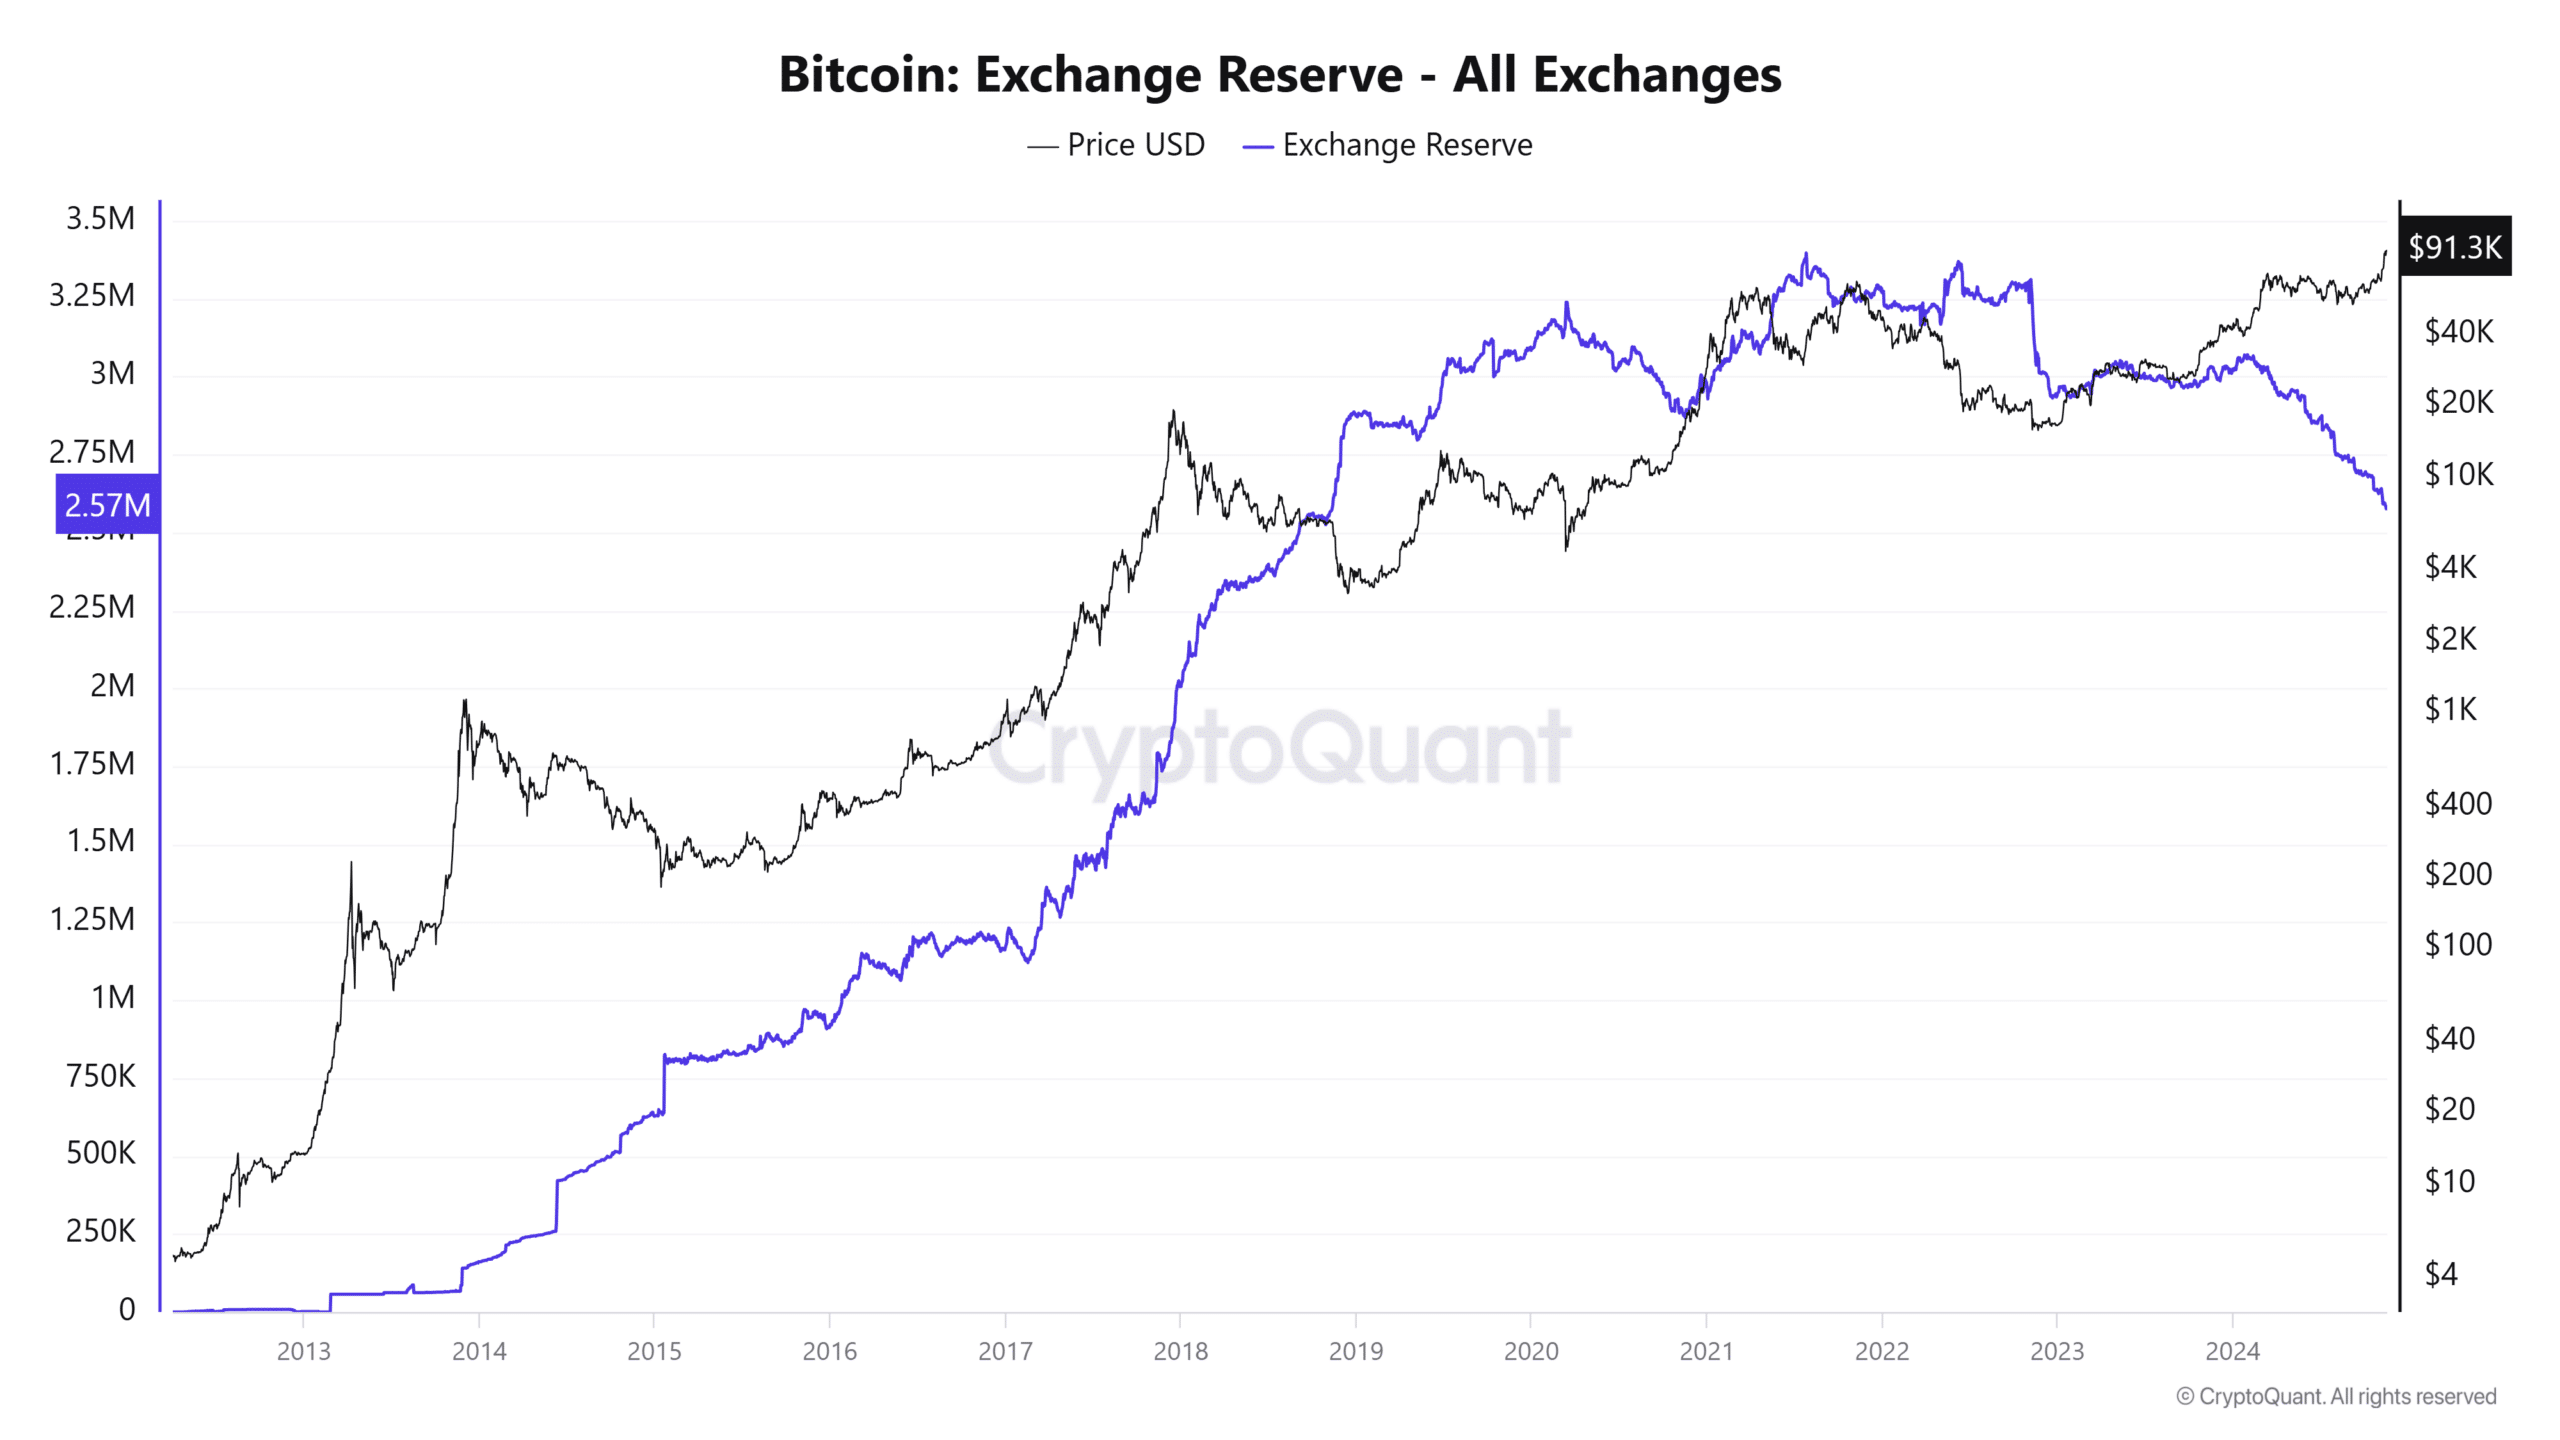
Bitcoin’s (BTC) exchange reserves have dropped to their lowest level since November 2018, reflecting a significant shift in market dynamics. This milestone was recorded soon after the crypto’s price surged past $91,000, supported by rising demand.
Needless to say, the confluence of these factors raises critical questions about the market’s liquidity and what this trend means for Bitcoin’s future.
Bitcoin exchange reserves and liquidity dynamics
Total Bitcoin reserves on exchanges fell to 2.57 million BTC, as highlighted by CryptoQuant’s chart. This level was last seen during the accumulation phase before the 2020-2021 bull run.
Historically, declining exchange reserves indicate a fall in selling pressure as more BTC is moved to private wallets. This can be interpreted to allude to a strong accumulation trend among long-term holders.

Source: CryptoQuant
With Bitcoin’s price climbing to $91,000, this drop in exchange reserves underlined constrained supply against a backdrop of growing demand.
If reserves continue to fall, liquidity could tighten further, potentially amplifying price volatility in the near term. However, this can also set the stage for a sustained rally, especially as available BTC for trading diminishes.
Derivatives data – Bitcoin Open Interest hits new highs
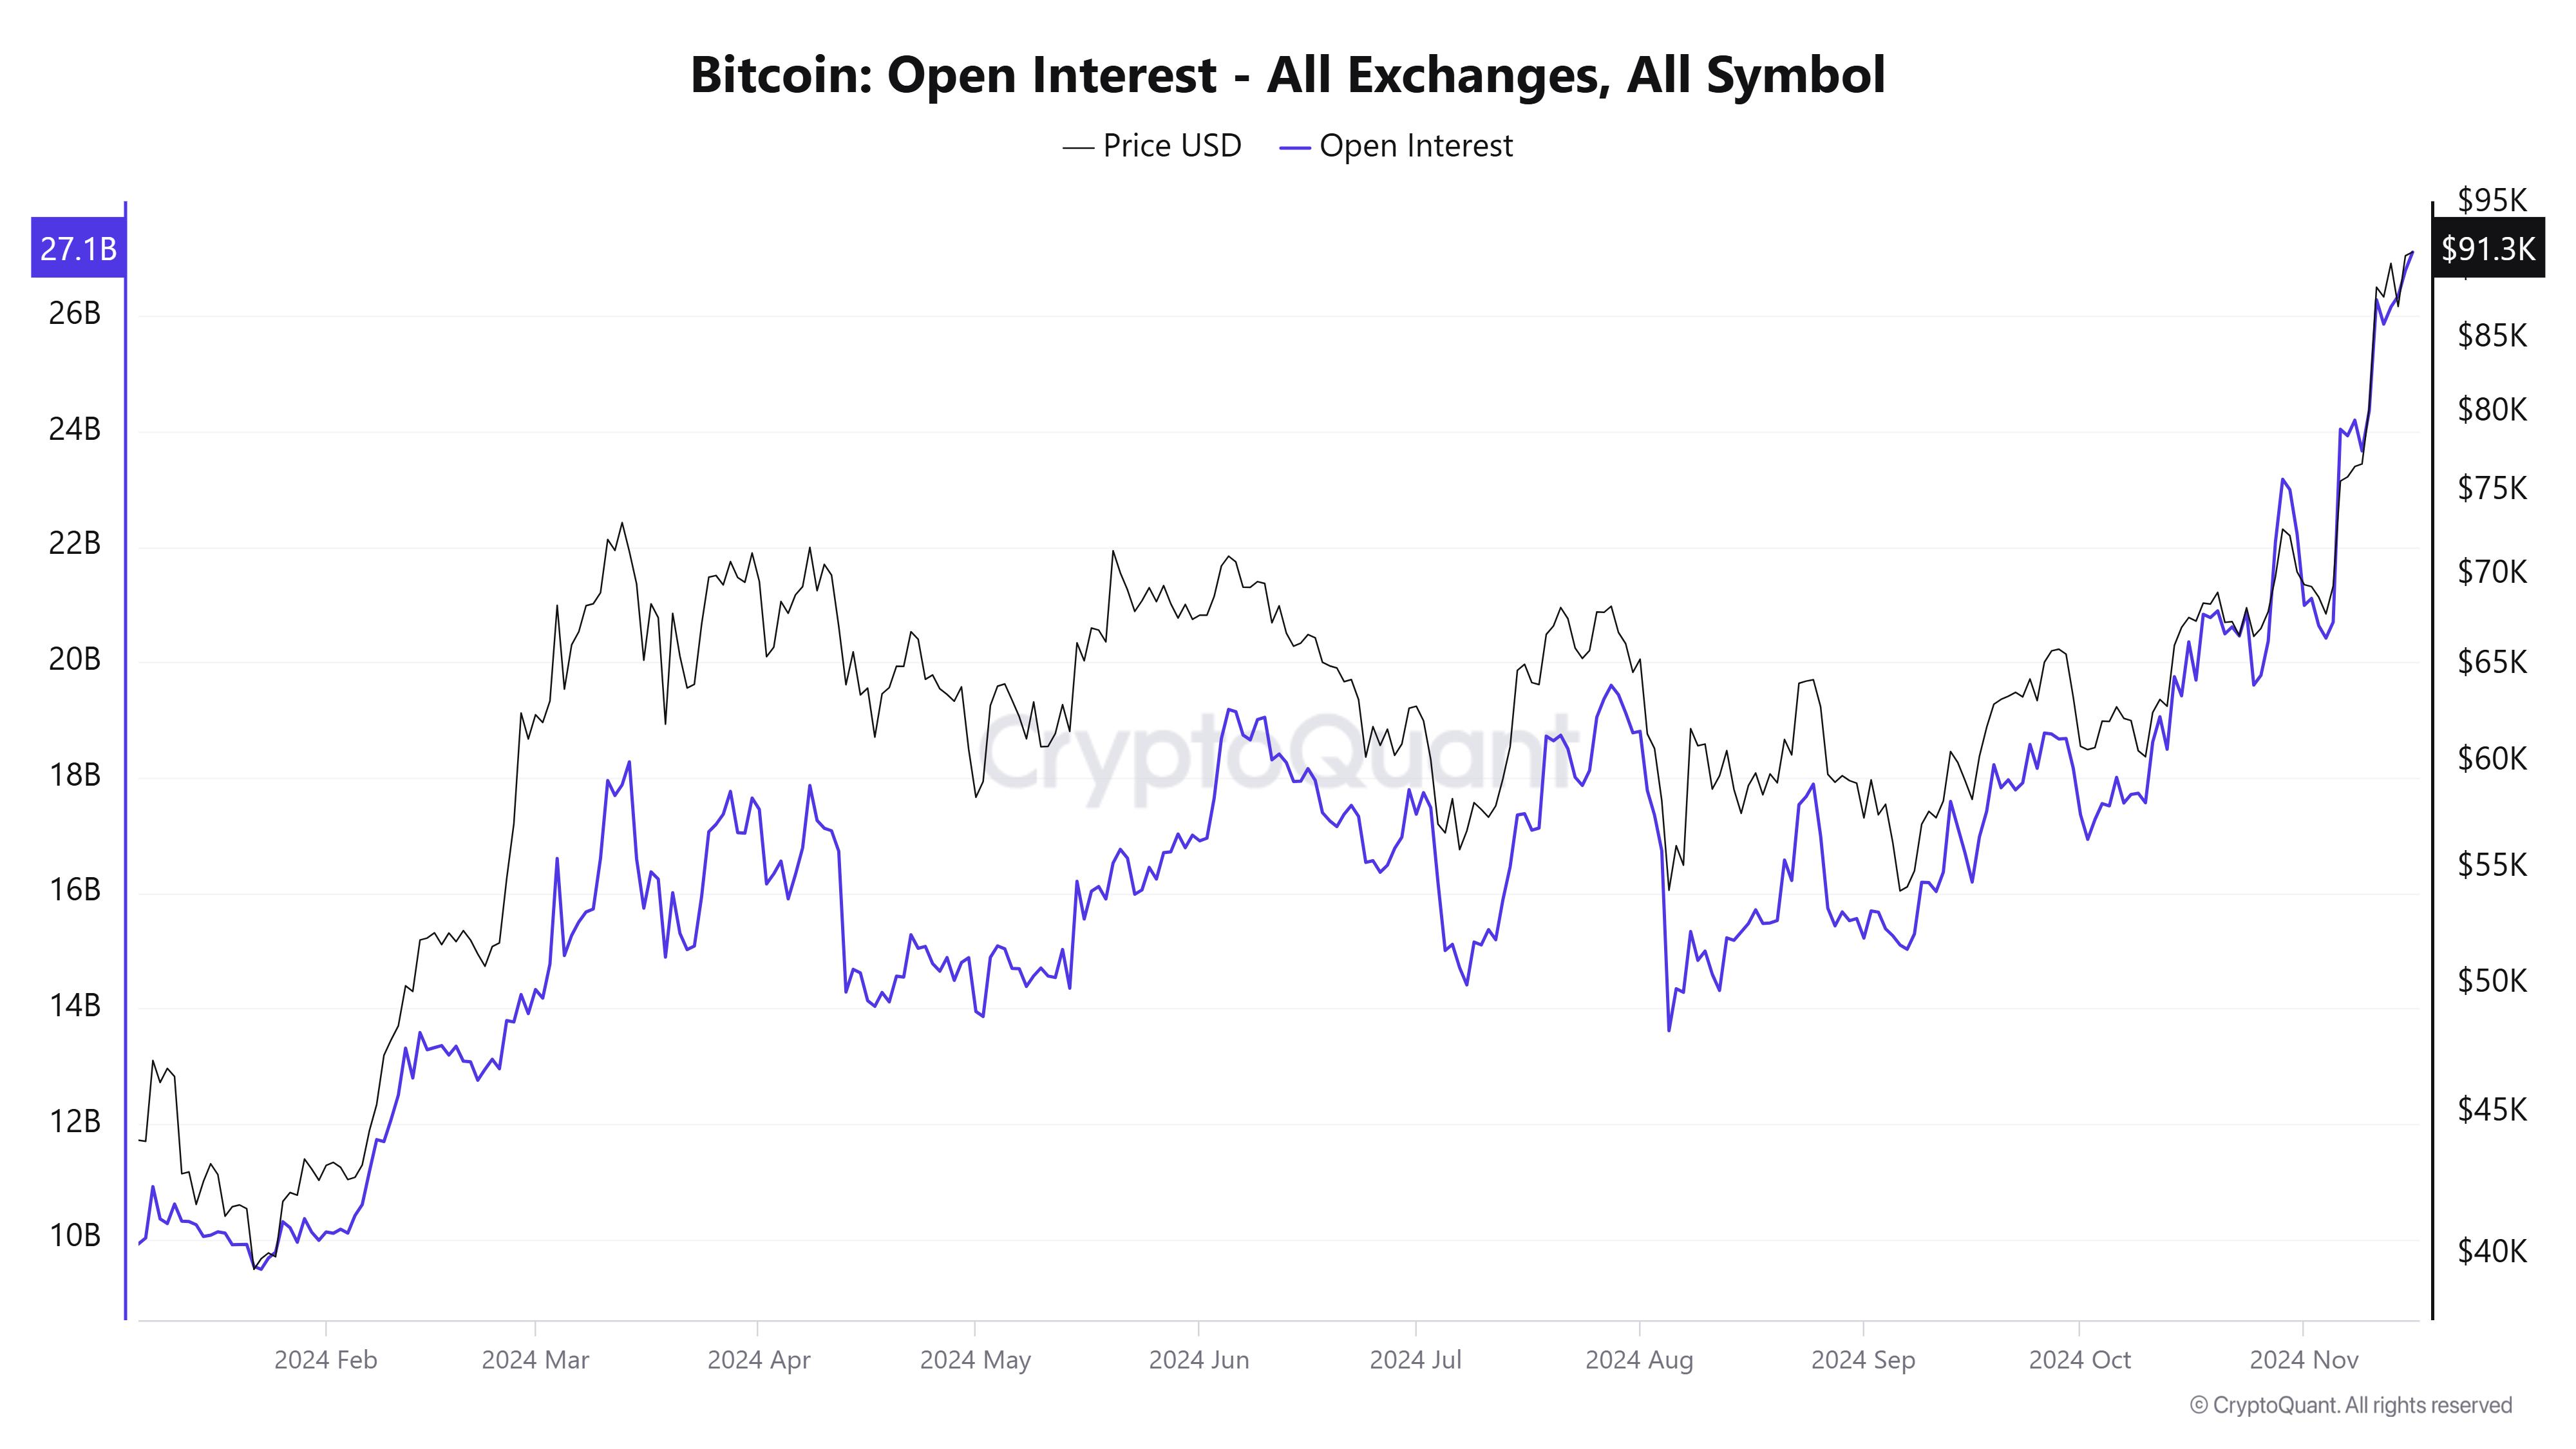
The Open Interest across all exchanges climbed to $26.8 billion, as per CryptoQuant’s data. Such a sharp hike reflected heightened speculative activity, especially since Bitcoin’s price seems to be approaching uncharted territory.
The Open Interest rising alongside a rising price is typically a bullish indicator – A sign of growing market participation and optimism.

Source: CryptoQuant
However, such elevated Open Interest levels warrant caution. Historically, sharp movements in price often lead to liquidations, particularly when leverage builds up.
Monitoring funding rates alongside the Open Interest will be critical in assessing whether the market remains overheated or if it is gearing up for further upward momentum.
Accumulation over distribution
Exchange netflows data underlined sustained outflows, with -7.5K BTC leaving exchanges compared to 4.2K BTC inflows. Consistent net outflows align with the narrative of accumulation, especially as investors move Bitcoin to cold wallets or custody solutions.
In previous market cycles, prolonged outflows have preceded major rallies, reflecting a market dynamic where supply on exchanges becomes increasingly scarce. These trends suggested that market participants are holding Bitcoin in anticipation of higher prices – Another bullish sign.
Bitcoin NVT Golden Cross – A signal of market strength
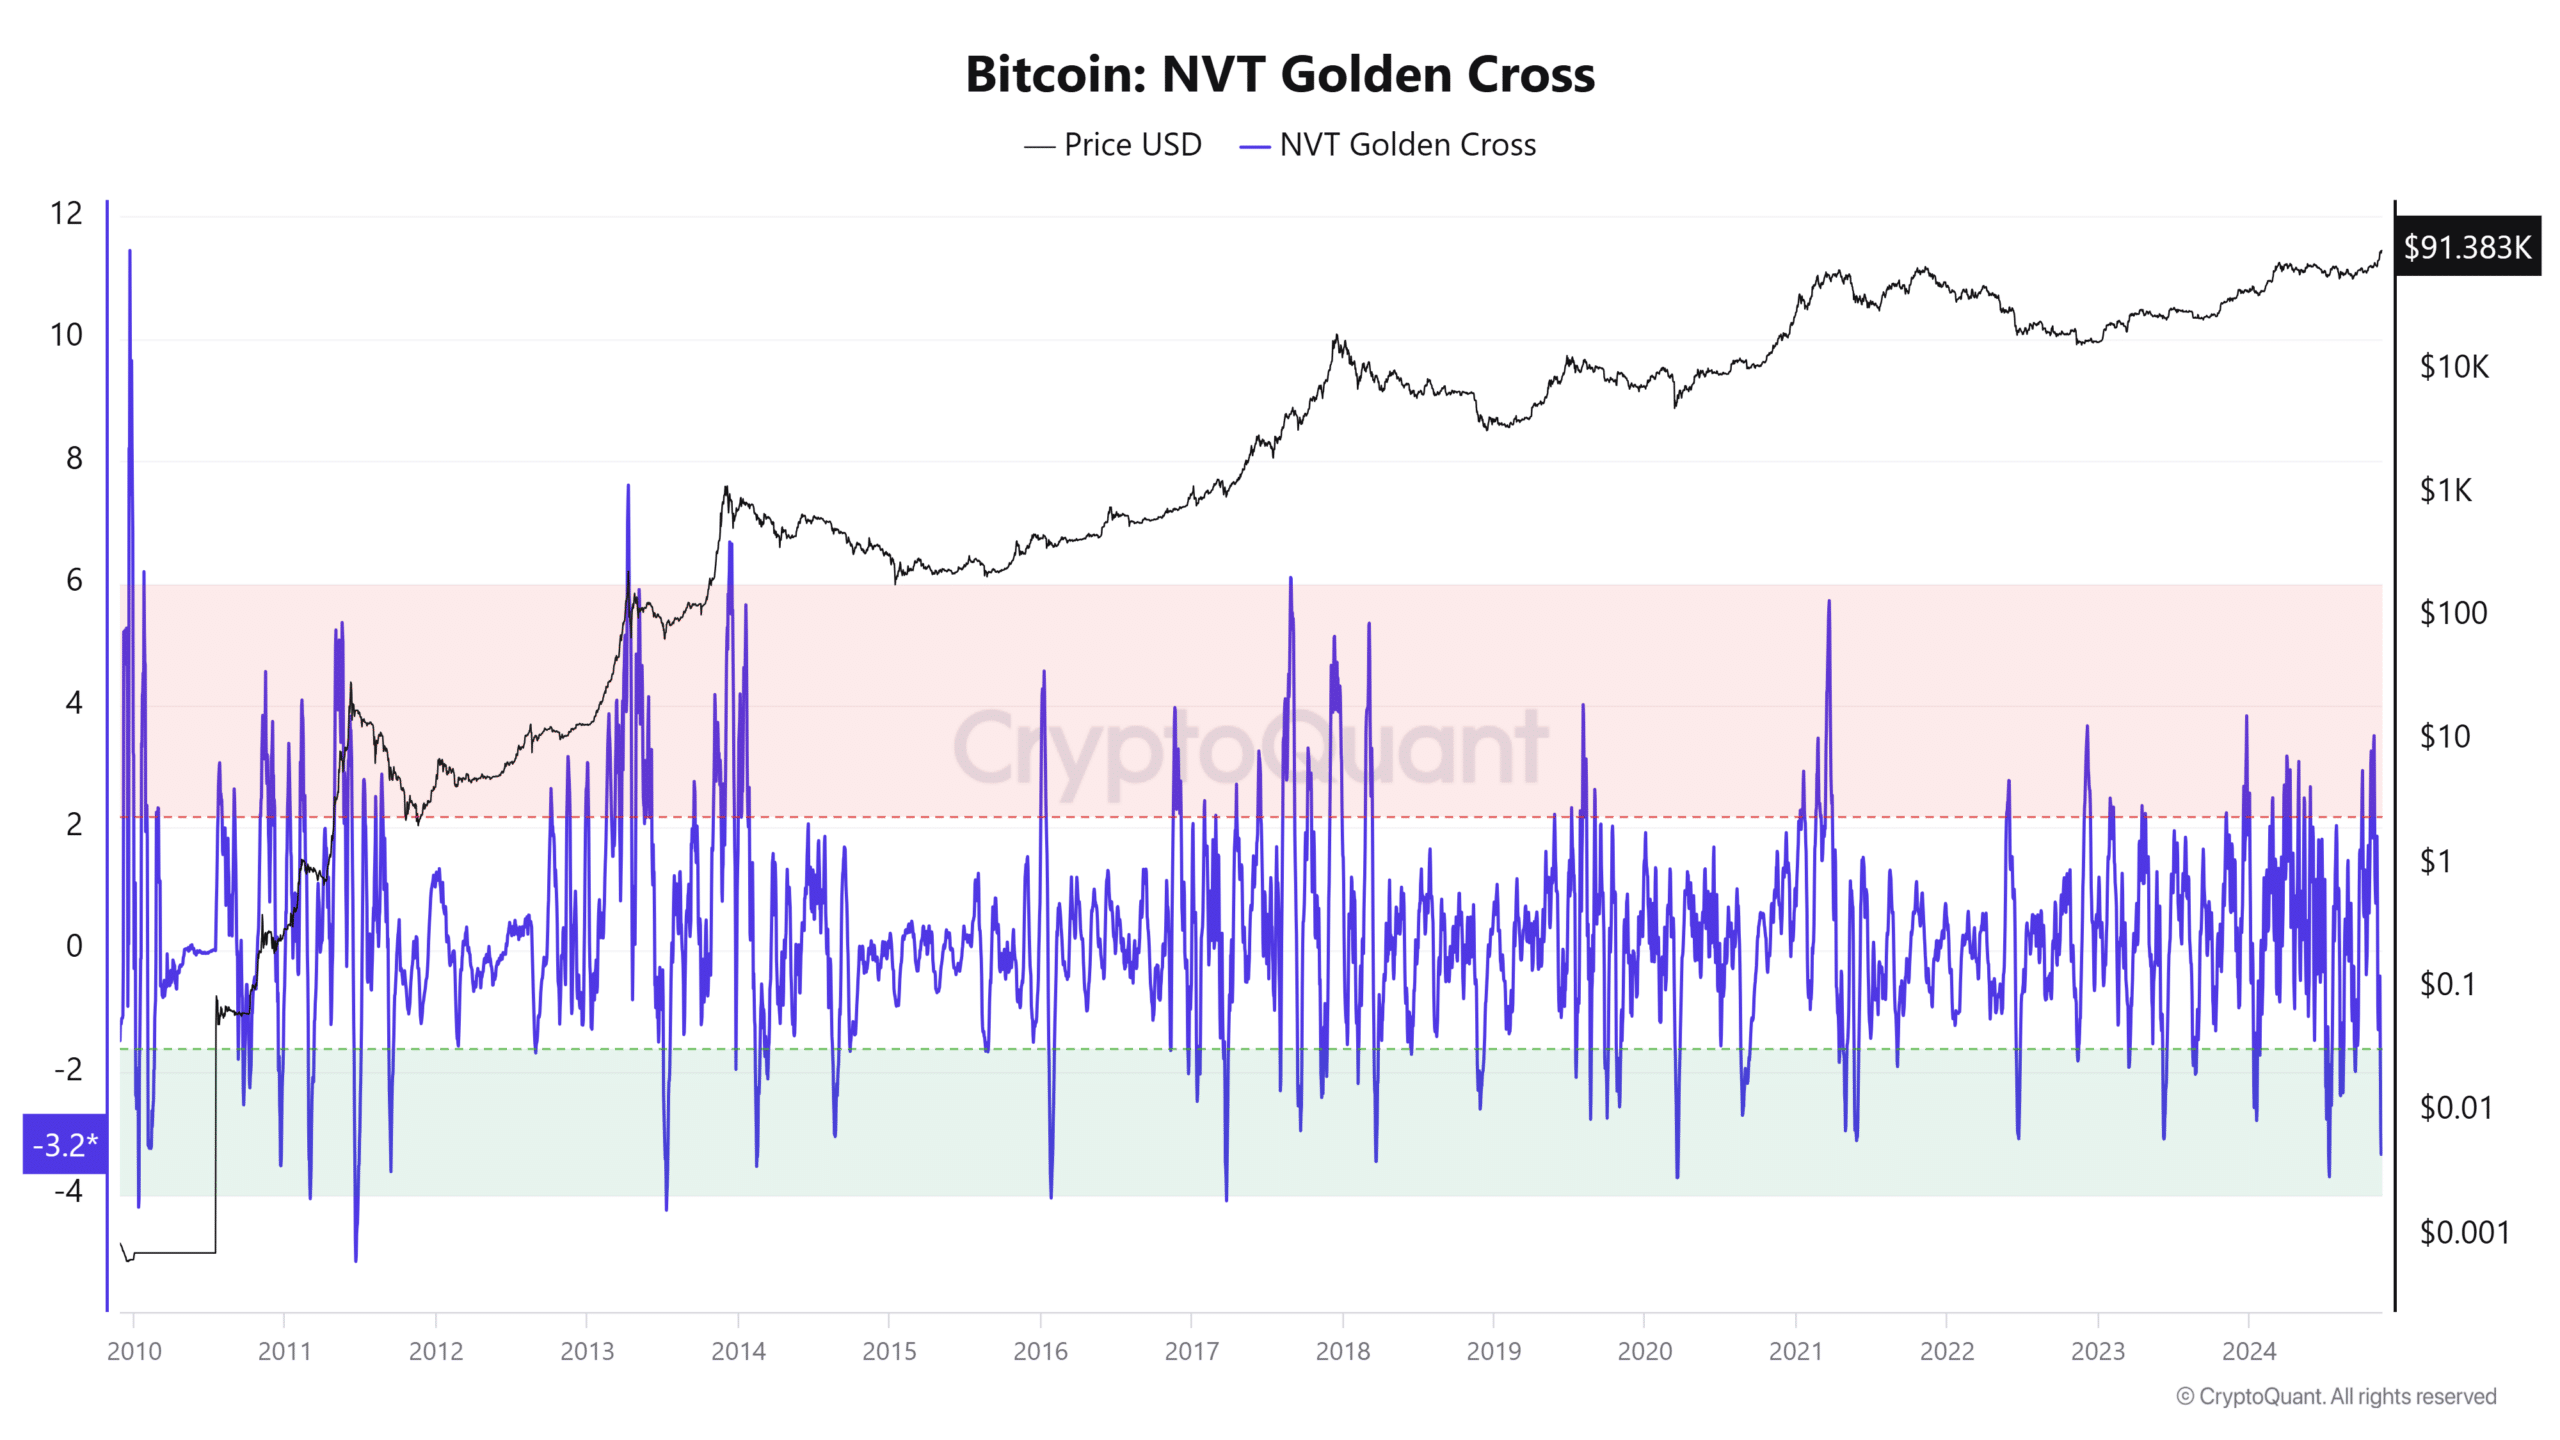
Bitcoin‘s NVT (Network Value to Transactions) Golden Cross recently entered bullish territory too, with the same underlined by CryptoQuant’s charts.
Here, it’s worth noting that this metric compares Bitcoin’s market capitalization to its transaction volume. It offers insights into whether the network’s valuation is supported by its activity.

Source: CryptoQuant
Historically, when the NVT Golden Cross rises into the green zone, it means that transaction activity is high relative to Bitcoin’s valuation – A sign of healthy network usage and bullish market conditions.
Conversely, a move into the red zone alludes to overvaluation or reduced network activity. Its press time positioning in the bullish zone reinforced the narrative of growing adoption and network confidence. This seemed to be in line with declining exchange reserves and rising Open Interest trends.
– Read Bitcoin (BTC) Price Prediction 2024-25
The decline in Bitcoin exchange reserves, coupled with rising Open Interest, consistent net outflows, and a bullish NVT Golden Cross, underscored a strong market setup.
While the reduced liquidity on exchanges could lead to higher volatility, the data seemed to suggest that market participants may be positioning for sustained upside.
- Despite corrections, Bitcoin’s price has remained firmly around the $90,000 zone
- Crypto’s price could hike well beyond this level soon
Bitcoin’s (BTC) exchange reserves have dropped to their lowest level since November 2018, reflecting a significant shift in market dynamics. This milestone was recorded soon after the crypto’s price surged past $91,000, supported by rising demand.
Needless to say, the confluence of these factors raises critical questions about the market’s liquidity and what this trend means for Bitcoin’s future.
Bitcoin exchange reserves and liquidity dynamics
Total Bitcoin reserves on exchanges fell to 2.57 million BTC, as highlighted by CryptoQuant’s chart. This level was last seen during the accumulation phase before the 2020-2021 bull run.
Historically, declining exchange reserves indicate a fall in selling pressure as more BTC is moved to private wallets. This can be interpreted to allude to a strong accumulation trend among long-term holders.

Source: CryptoQuant
With Bitcoin’s price climbing to $91,000, this drop in exchange reserves underlined constrained supply against a backdrop of growing demand.
If reserves continue to fall, liquidity could tighten further, potentially amplifying price volatility in the near term. However, this can also set the stage for a sustained rally, especially as available BTC for trading diminishes.
Derivatives data – Bitcoin Open Interest hits new highs
The Open Interest across all exchanges climbed to $26.8 billion, as per CryptoQuant’s data. Such a sharp hike reflected heightened speculative activity, especially since Bitcoin’s price seems to be approaching uncharted territory.
The Open Interest rising alongside a rising price is typically a bullish indicator – A sign of growing market participation and optimism.

Source: CryptoQuant
However, such elevated Open Interest levels warrant caution. Historically, sharp movements in price often lead to liquidations, particularly when leverage builds up.
Monitoring funding rates alongside the Open Interest will be critical in assessing whether the market remains overheated or if it is gearing up for further upward momentum.
Accumulation over distribution
Exchange netflows data underlined sustained outflows, with -7.5K BTC leaving exchanges compared to 4.2K BTC inflows. Consistent net outflows align with the narrative of accumulation, especially as investors move Bitcoin to cold wallets or custody solutions.
In previous market cycles, prolonged outflows have preceded major rallies, reflecting a market dynamic where supply on exchanges becomes increasingly scarce. These trends suggested that market participants are holding Bitcoin in anticipation of higher prices – Another bullish sign.
Bitcoin NVT Golden Cross – A signal of market strength
Bitcoin‘s NVT (Network Value to Transactions) Golden Cross recently entered bullish territory too, with the same underlined by CryptoQuant’s charts.
Here, it’s worth noting that this metric compares Bitcoin’s market capitalization to its transaction volume. It offers insights into whether the network’s valuation is supported by its activity.

Source: CryptoQuant
Historically, when the NVT Golden Cross rises into the green zone, it means that transaction activity is high relative to Bitcoin’s valuation – A sign of healthy network usage and bullish market conditions.
Conversely, a move into the red zone alludes to overvaluation or reduced network activity. Its press time positioning in the bullish zone reinforced the narrative of growing adoption and network confidence. This seemed to be in line with declining exchange reserves and rising Open Interest trends.
– Read Bitcoin (BTC) Price Prediction 2024-25
The decline in Bitcoin exchange reserves, coupled with rising Open Interest, consistent net outflows, and a bullish NVT Golden Cross, underscored a strong market setup.
While the reduced liquidity on exchanges could lead to higher volatility, the data seemed to suggest that market participants may be positioning for sustained upside.


buying cheap clomid price generic clomid c10m1d where can i get clomiphene no prescription clomiphene rx cost cheap clomid prices cost of generic clomiphene pills clomiphene for sale in usa
More articles like this would frame the blogosphere richer.
Proof blog you procure here.. It’s severely to espy strong status article like yours these days. I justifiably appreciate individuals like you! Take care!!
buy zithromax no prescription – flagyl 400mg for sale buy metronidazole
order semaglutide 14mg pill – semaglutide 14mg us buy cyproheptadine 4mg without prescription
buy generic domperidone over the counter – buy domperidone online flexeril 15mg tablet
amoxiclav generic – atbioinfo.com ampicillin for sale
order nexium 20mg online cheap – https://anexamate.com/ buy esomeprazole 20mg online cheap
buy generic medex online – coumamide cozaar 50mg tablet
meloxicam 15mg us – tenderness mobic 15mg usa
buy prednisone 5mg without prescription – https://apreplson.com/ buy prednisone 10mg sale
male ed pills – https://fastedtotake.com/ buy generic ed pills
cheap amoxicillin generic – cheap amoxil generic amoxicillin canada
fluconazole 100mg without prescription – https://gpdifluca.com/# diflucan 100mg pills
cost of cialis for daily use – https://ciltadgn.com/ vidalista tadalafil reviews
ranitidine order online – https://aranitidine.com/# buy zantac pill
cialis by mail – strong tadafl vidalista tadalafil reviews
I couldn’t hold back commenting. Adequately written! fildena como tomar
More posts like this would prosper the blogosphere more useful. generic furosemide
This is the stripe of content I enjoy reading. https://ursxdol.com/ventolin-albuterol/
I am in point of fact delighted to coup d’oeil at this blog posts which consists of tons of of use facts, thanks object of providing such data. https://prohnrg.com/product/metoprolol-25-mg-tablets/
The thoroughness in this piece is noteworthy. https://aranitidine.com/fr/acheter-cenforce/
This is the kind of advise I unearth helpful. https://ondactone.com/simvastatin/
With thanks. Loads of conception!
purchase topiramate pill
This is the kind of content I take advantage of reading. https://sportavesti.ru/forums/users/nyral-2/
buy forxiga 10mg online cheap – dapagliflozin without prescription buy dapagliflozin online cheap
buy generic xenical online – https://asacostat.com/# buy orlistat 60mg pill
Elite cleaning service, understands luxury Manhattan properties. Setting up monthly service. Outstanding Manhattan team.
I am in truth happy to glitter at this blog posts which consists of tons of profitable facts, thanks towards providing such data. http://www.orlandogamers.org/forum/member.php?action=profile&uid=29945
We are looking for partnerships with other businesses for mutual promotion. Please contact us for more information!
Business Name: Sparkly Maid NYC Cleaning Services
Address: 447 Broadway 2nd floor #523, New York, NY 10013, United States
Phone Number: +1 646-585-3515
Website: https://sparklymaidnyc.com
We pay $10 for a google review and We are looking for partnerships with other businesses for Google Review Exchange. Please contact us for more information!
Business Name: Sparkly Maid NYC Cleaning Services
Address: 447 Broadway 2nd floor #523, New York, NY 10013, United States
Phone Number: +1 646-585-3515
Website: https://sparklymaidnyc.com