


![What Is Asset Tokenization? Types, Why It Matters Now [2025]](https://coininsights.com/wp-content/uploads/2025/05/asset_tokenization-360x180.png)


- BTC’s long/short ratio dropped, hinting at a price correction.
- Technical indicators continued to remain bullish.
Bitcoin [BTC] successfully crawled above $66k a few days back, sparking excitement in the community. But the trend didn’t last as it again fell below that mark. In fact, the latest data suggested that this just might be the beginning of a major price correction.
Bitcoin has danger going forward
Bitcoin witnessed a price correction in the last 24 hours, pushing it under $66k. To be precise, at the time of writing, BTC was trading at $65,504.34. In fact, AMBCrypto reported earlier that there were chances of BTC falling victim to a price correction.
In the meantime, Crypto Bullet, a popular crypto analyst, recently posted a tweet revealing a bearish divergence on BTC’s 4-hour chart.
Whenever such a divergence appears, it suggests that the chances of a price correction are high. The tweet mentioned that in case of the bearish trend reversal, then its investors might as well witness BTC once again dropping to $60k.
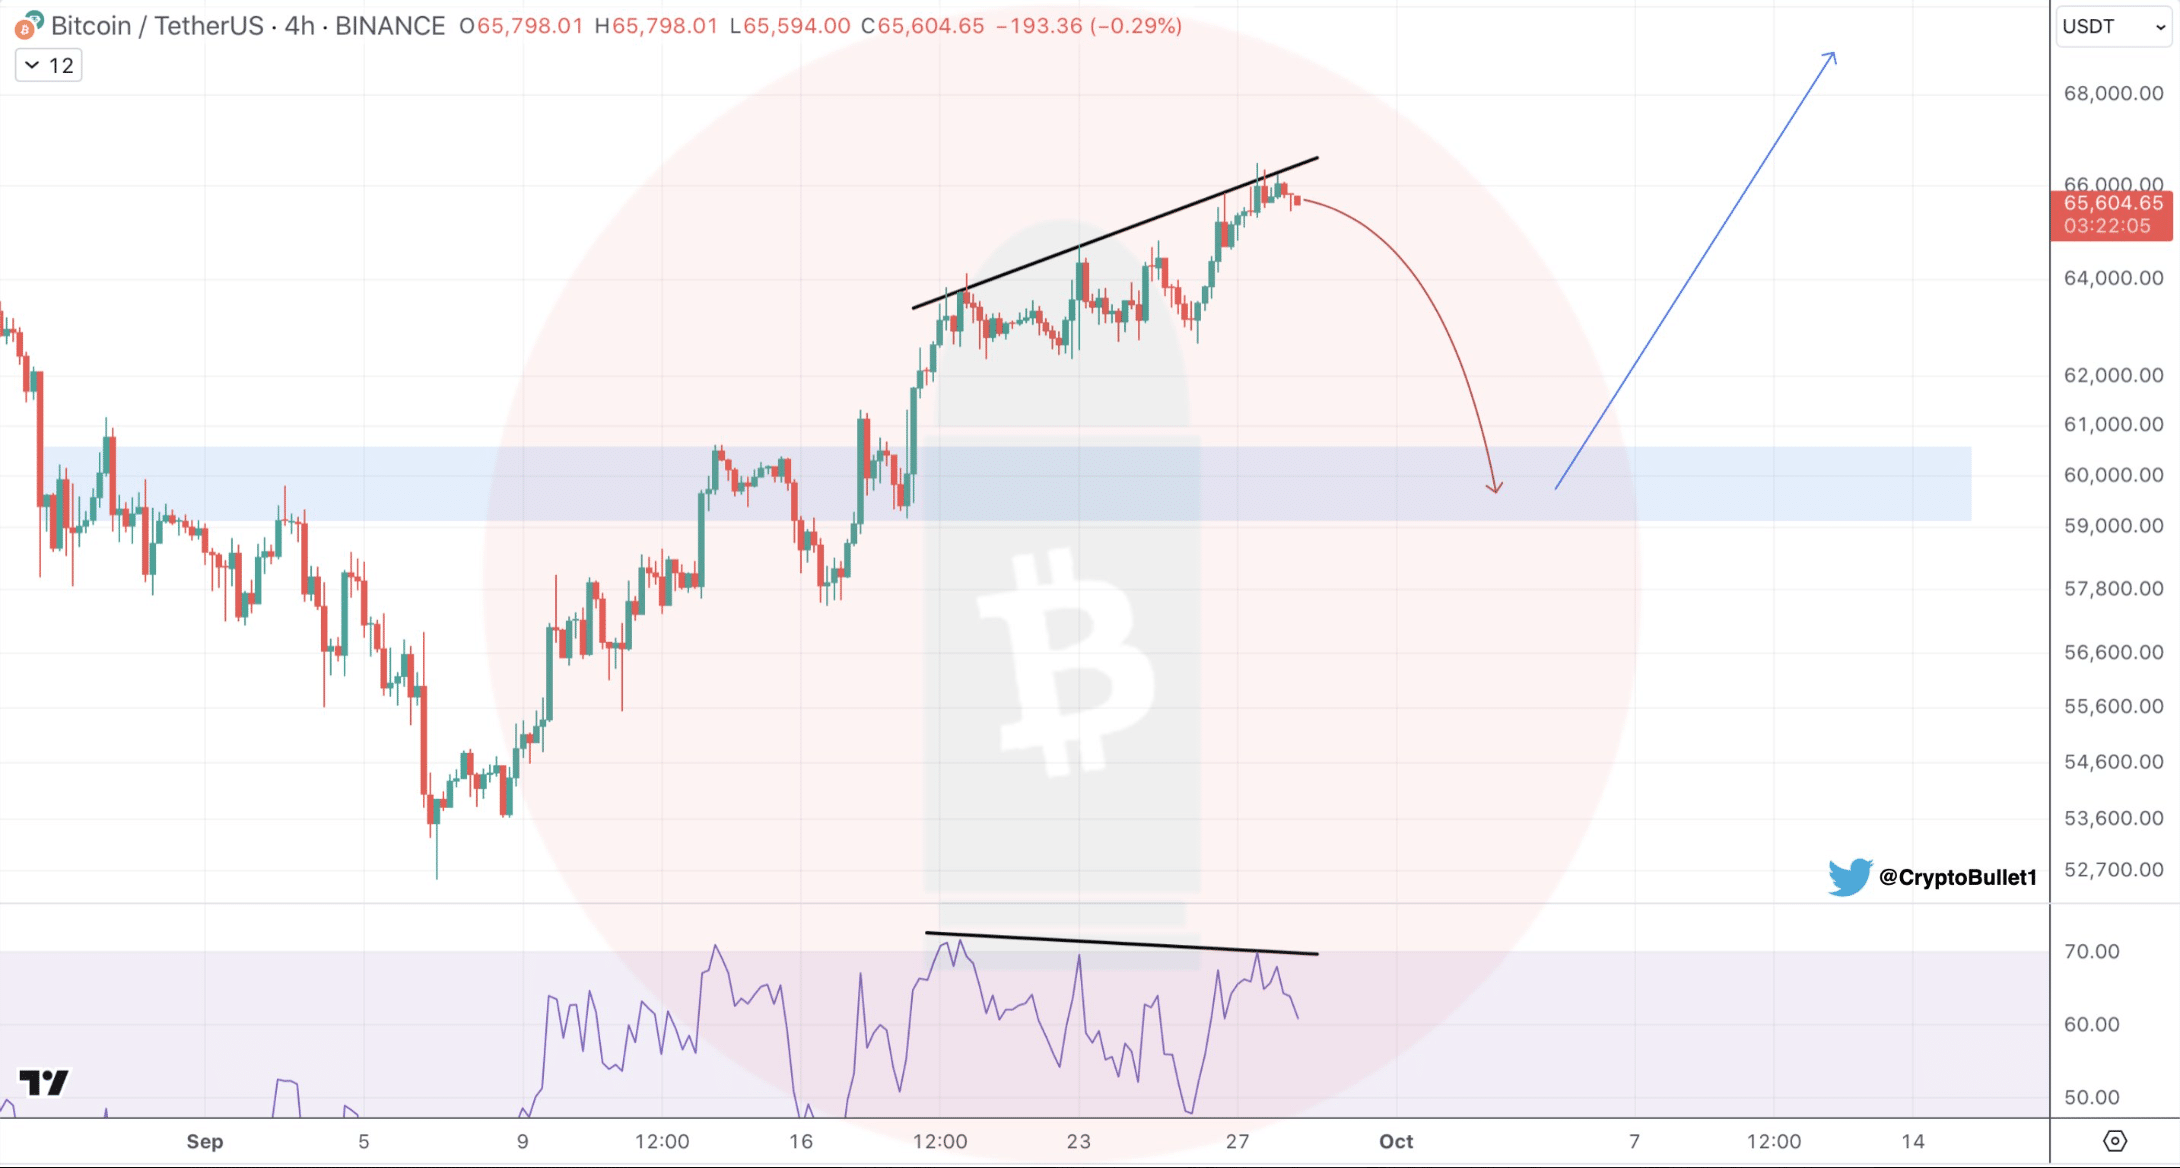
Source: X
What metrics suggest
AMBCrypto then checked the king coin’s on-chain data to find out whether they also indicated a price correction.
As per our analysis of Santiment’s data, it revealed that after a spike, BTC’s MVRV ratio dropped slightly in the last few days, which can be inferred as a bearish signal.
Market sentiment around the coin also turned bearish, which was evident from the drop in its weighted sentiment.
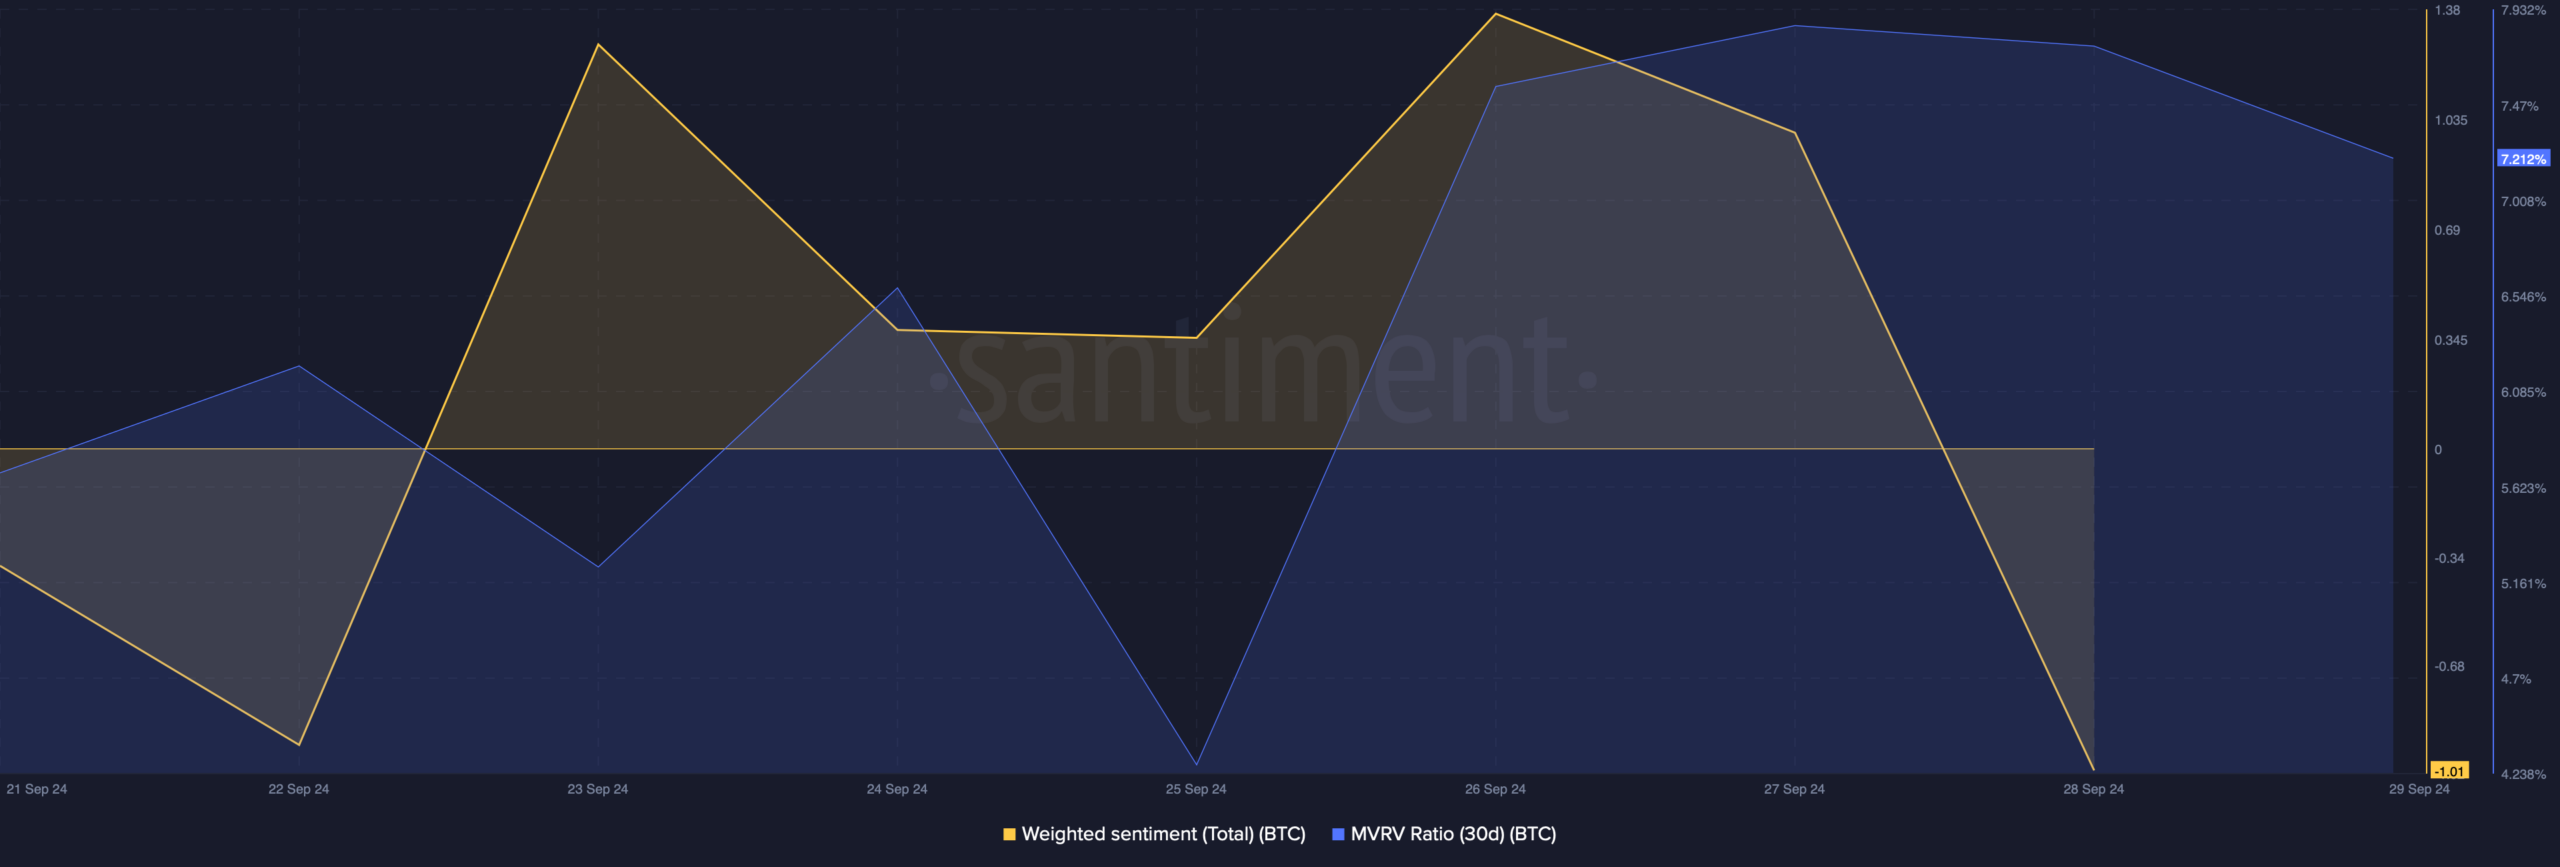
Source: Santiment
Apart from that, AMBCrypto’s look at Coinglass’ data also revealed a bearish signal. We found that Bitcoin’s long/short ratio dipped. A drop in the metric means that there are more short positions in the market than long positions.
This can be considered a bearish signal as it hints at a rise in bearish sentiment.
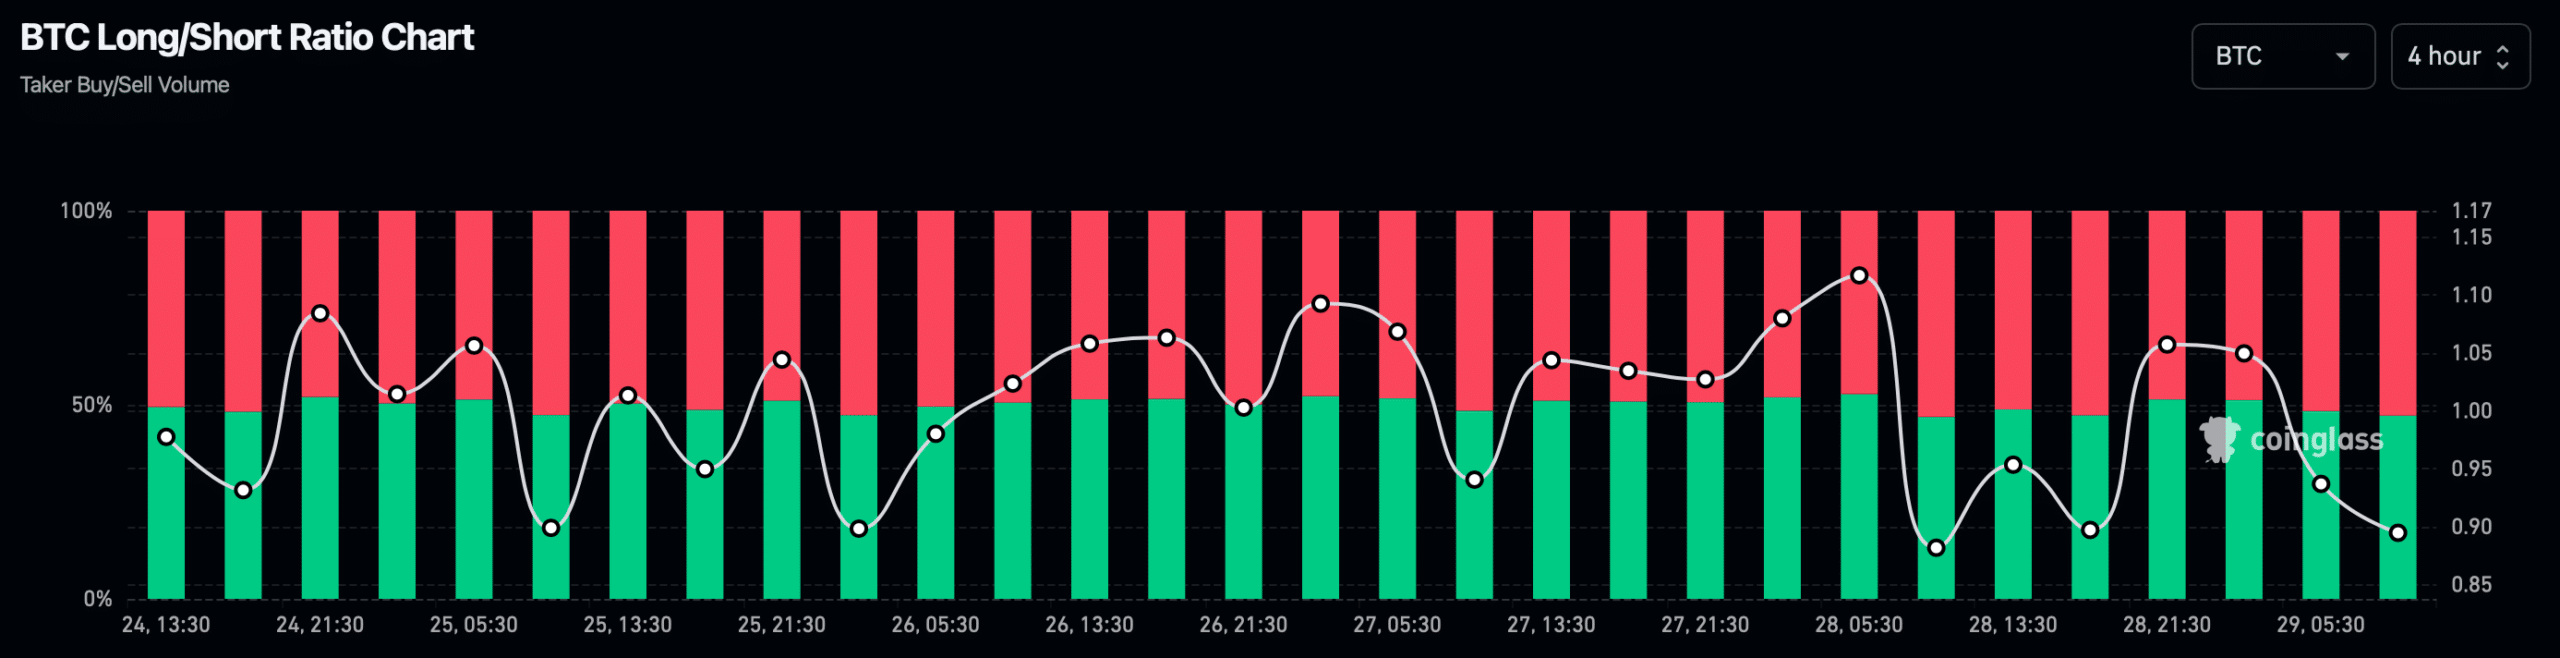
Source: Coinglass
However, not everything was in the bears’ favor. For instance, the fear and greed index had a value of 38% at press time. This meant that the market was in a “fear” phase.
Whenever that happens, it suggests that there is a possibility of a price increase. If that turns out to be true, then BTC might not as well drop to $60k again in the near term. Therefore, we checked the coin’s daily chart.
Is your portfolio green? Check out the BTC Profit Calculator
As per our analysis, the 9-day MA was still well above the 21-day MA, signaling a bullish advantage in the market. If the bull rally begins again, then BTC might first target $68k.
If the aforementioned analysis is true, then BTC might fall to $60k again.
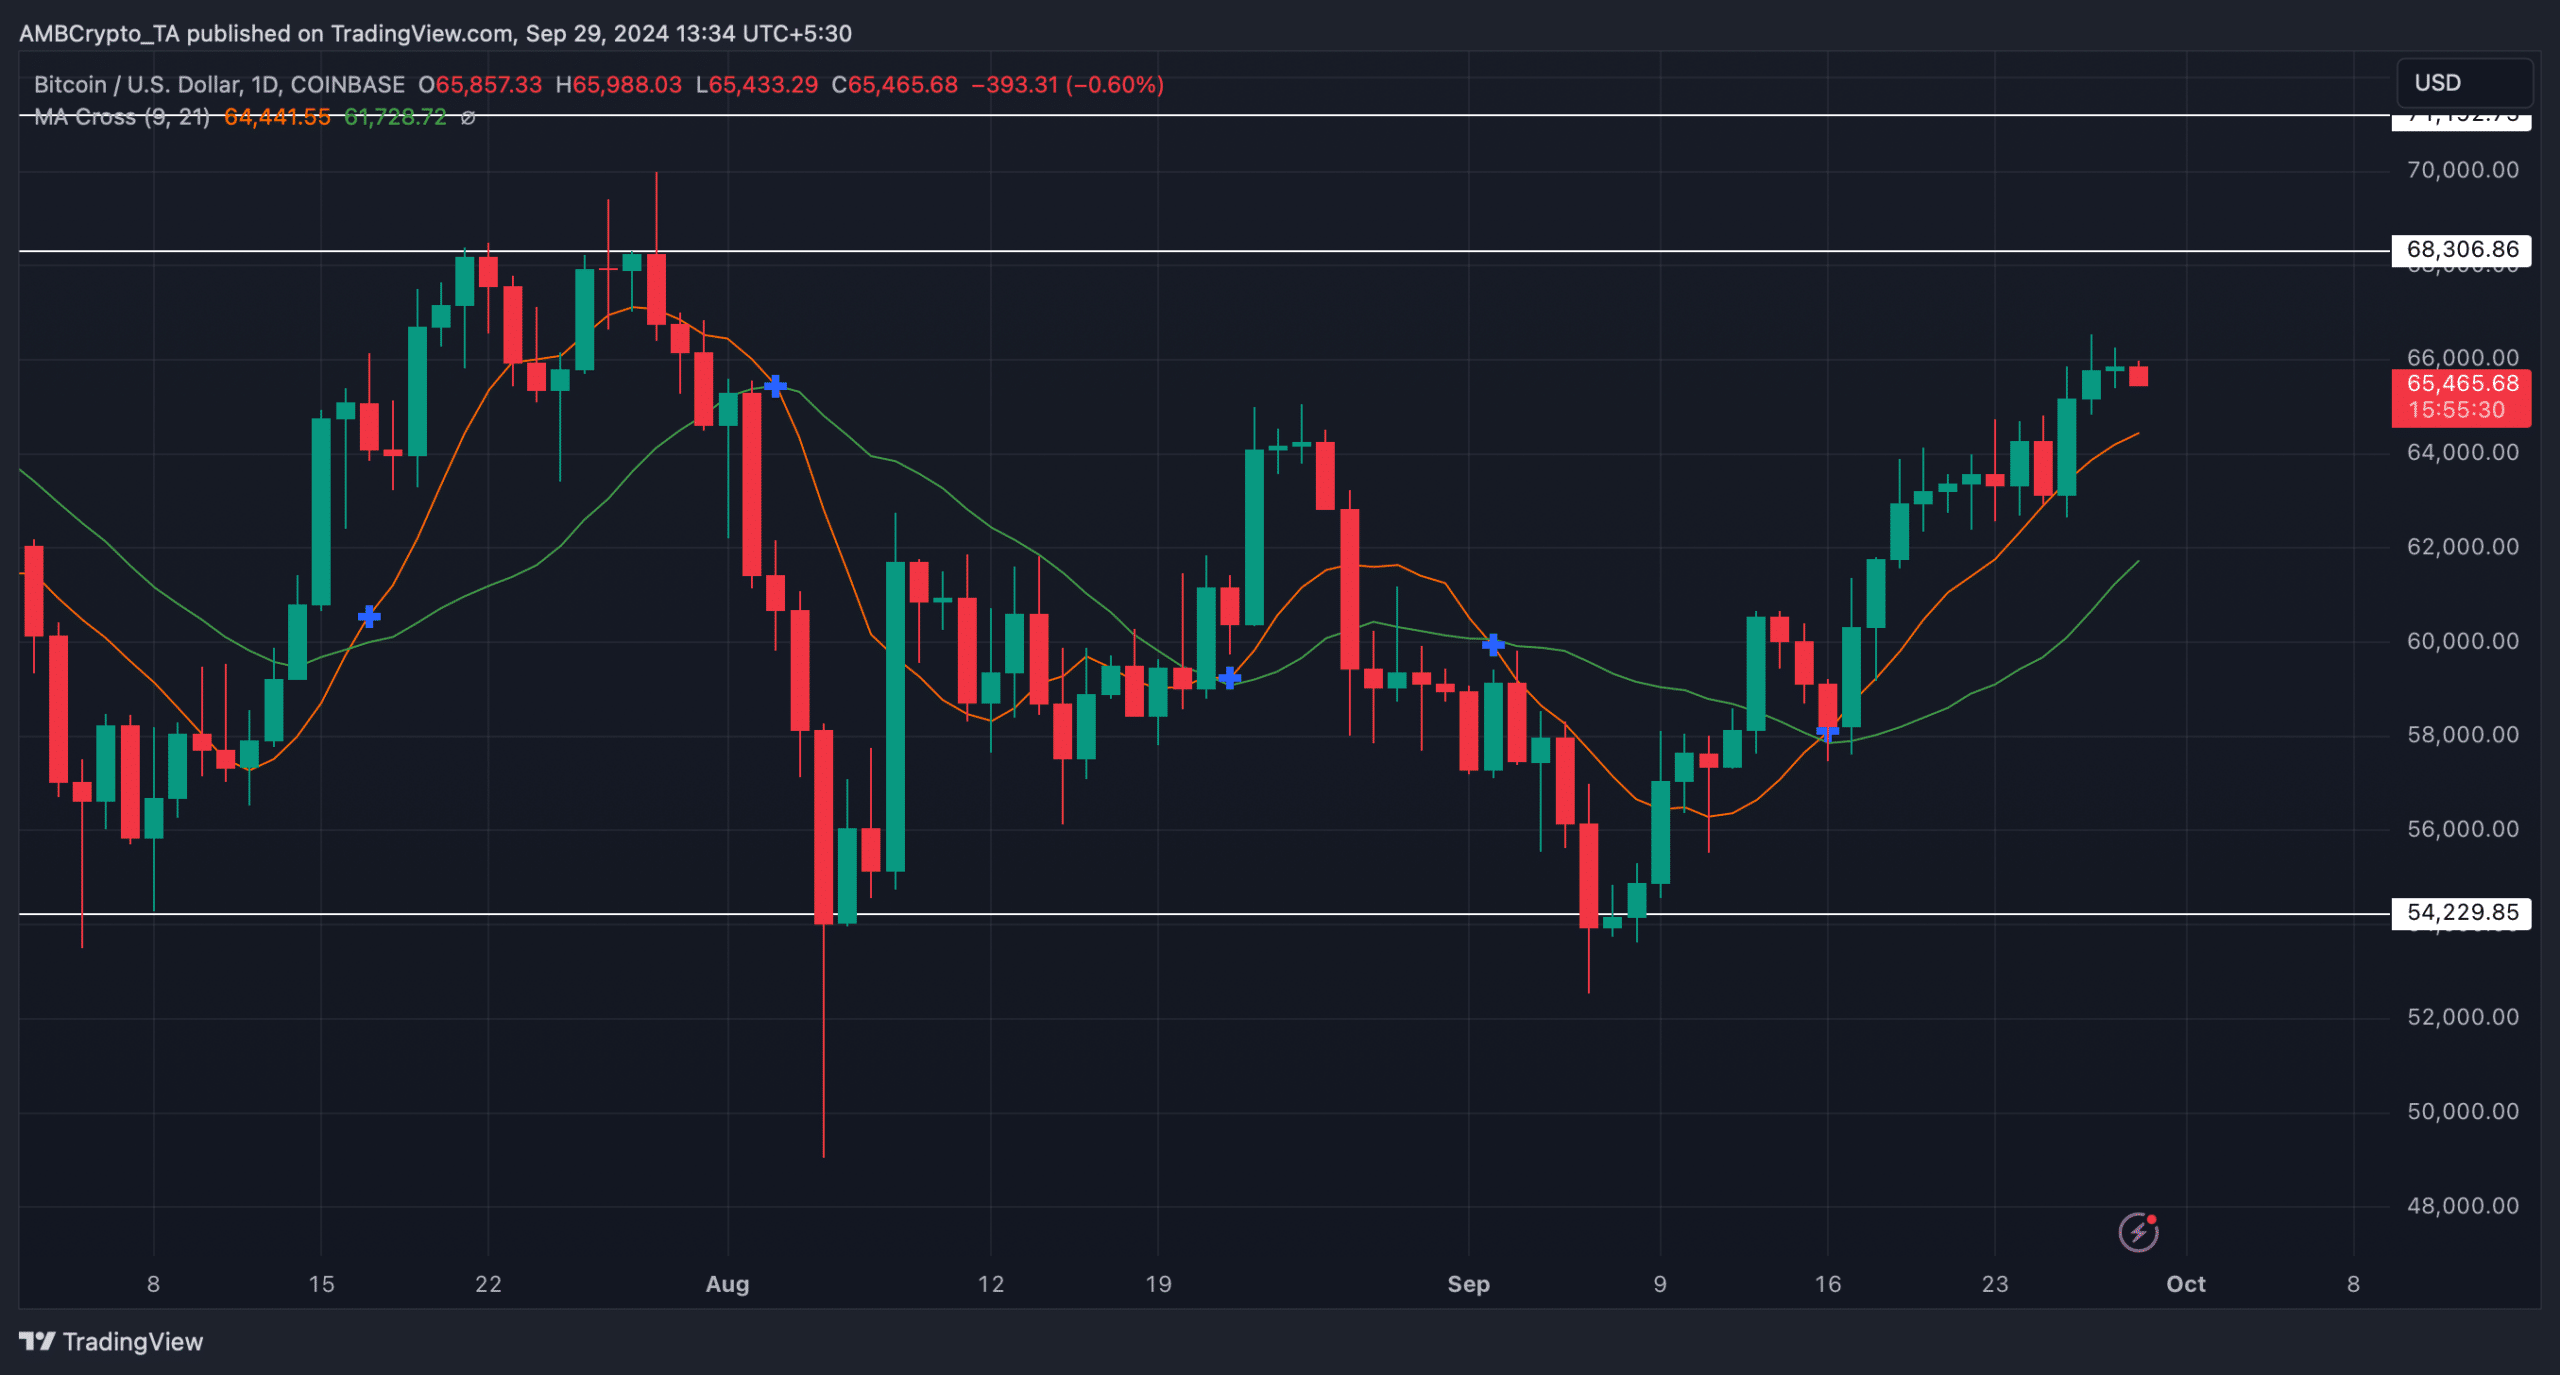
Source: TradingView
- BTC’s long/short ratio dropped, hinting at a price correction.
- Technical indicators continued to remain bullish.
Bitcoin [BTC] successfully crawled above $66k a few days back, sparking excitement in the community. But the trend didn’t last as it again fell below that mark. In fact, the latest data suggested that this just might be the beginning of a major price correction.
Bitcoin has danger going forward
Bitcoin witnessed a price correction in the last 24 hours, pushing it under $66k. To be precise, at the time of writing, BTC was trading at $65,504.34. In fact, AMBCrypto reported earlier that there were chances of BTC falling victim to a price correction.
In the meantime, Crypto Bullet, a popular crypto analyst, recently posted a tweet revealing a bearish divergence on BTC’s 4-hour chart.
Whenever such a divergence appears, it suggests that the chances of a price correction are high. The tweet mentioned that in case of the bearish trend reversal, then its investors might as well witness BTC once again dropping to $60k.
Source: X
What metrics suggest
AMBCrypto then checked the king coin’s on-chain data to find out whether they also indicated a price correction.
As per our analysis of Santiment’s data, it revealed that after a spike, BTC’s MVRV ratio dropped slightly in the last few days, which can be inferred as a bearish signal.
Market sentiment around the coin also turned bearish, which was evident from the drop in its weighted sentiment.
Source: Santiment
Apart from that, AMBCrypto’s look at Coinglass’ data also revealed a bearish signal. We found that Bitcoin’s long/short ratio dipped. A drop in the metric means that there are more short positions in the market than long positions.
This can be considered a bearish signal as it hints at a rise in bearish sentiment.
Source: Coinglass
However, not everything was in the bears’ favor. For instance, the fear and greed index had a value of 38% at press time. This meant that the market was in a “fear” phase.
Whenever that happens, it suggests that there is a possibility of a price increase. If that turns out to be true, then BTC might not as well drop to $60k again in the near term. Therefore, we checked the coin’s daily chart.
Is your portfolio green? Check out the BTC Profit Calculator
As per our analysis, the 9-day MA was still well above the 21-day MA, signaling a bullish advantage in the market. If the bull rally begins again, then BTC might first target $68k.
If the aforementioned analysis is true, then BTC might fall to $60k again.
Source: TradingView


can i get generic clomid pills generic clomid where to get clomid without dr prescription buy cheap clomiphene can i purchase clomiphene prices can i purchase generic clomiphene without rx cost of cheap clomiphene online
More posts like this would make the online play more useful.
This is the kind of delivery I find helpful.
buy azithromycin – buy tindamax pills for sale buy metronidazole 400mg online
order domperidone for sale – cheap sumycin 250mg buy flexeril online
amoxicillin online – oral combivent combivent cost
buy zithromax 250mg generic – azithromycin 250mg price order nebivolol 5mg online