


- Bitcoin struggled against $67,583 resistance; breaking this level could trigger a move toward $70,000.
- RSI and MACD show weakening momentum, while rising active addresses suggest potential bullish activity.
Bitcoin [BTC] fell below $67,000, reaching an intraday low of $65,700 after losing its overnight gains. Priced at $66,972.95 at press time, it shows a 1.22% decline in the past 24 hours and 2.01% over the past week.
Despite the short-term dip, Bitcoin’s market cap remains at $1.32 trillion, with a circulating supply of 20 million BTC. In the last 24 hours, trading volume reached $46.32 billion, reflecting continued interest from traders.
Bitcoin has been trading within a clear descending channel. This pattern shows a series of lower highs and lower lows, indicating a bearish trend.
The upper boundary of this channel, near $69,000, has repeatedly acted as a strong resistance level, pushing prices lower after each attempt to break above it.
As seen on the chart, recent rejections have followed similar patterns, suggesting that this resistance remains a key challenge for further gains.
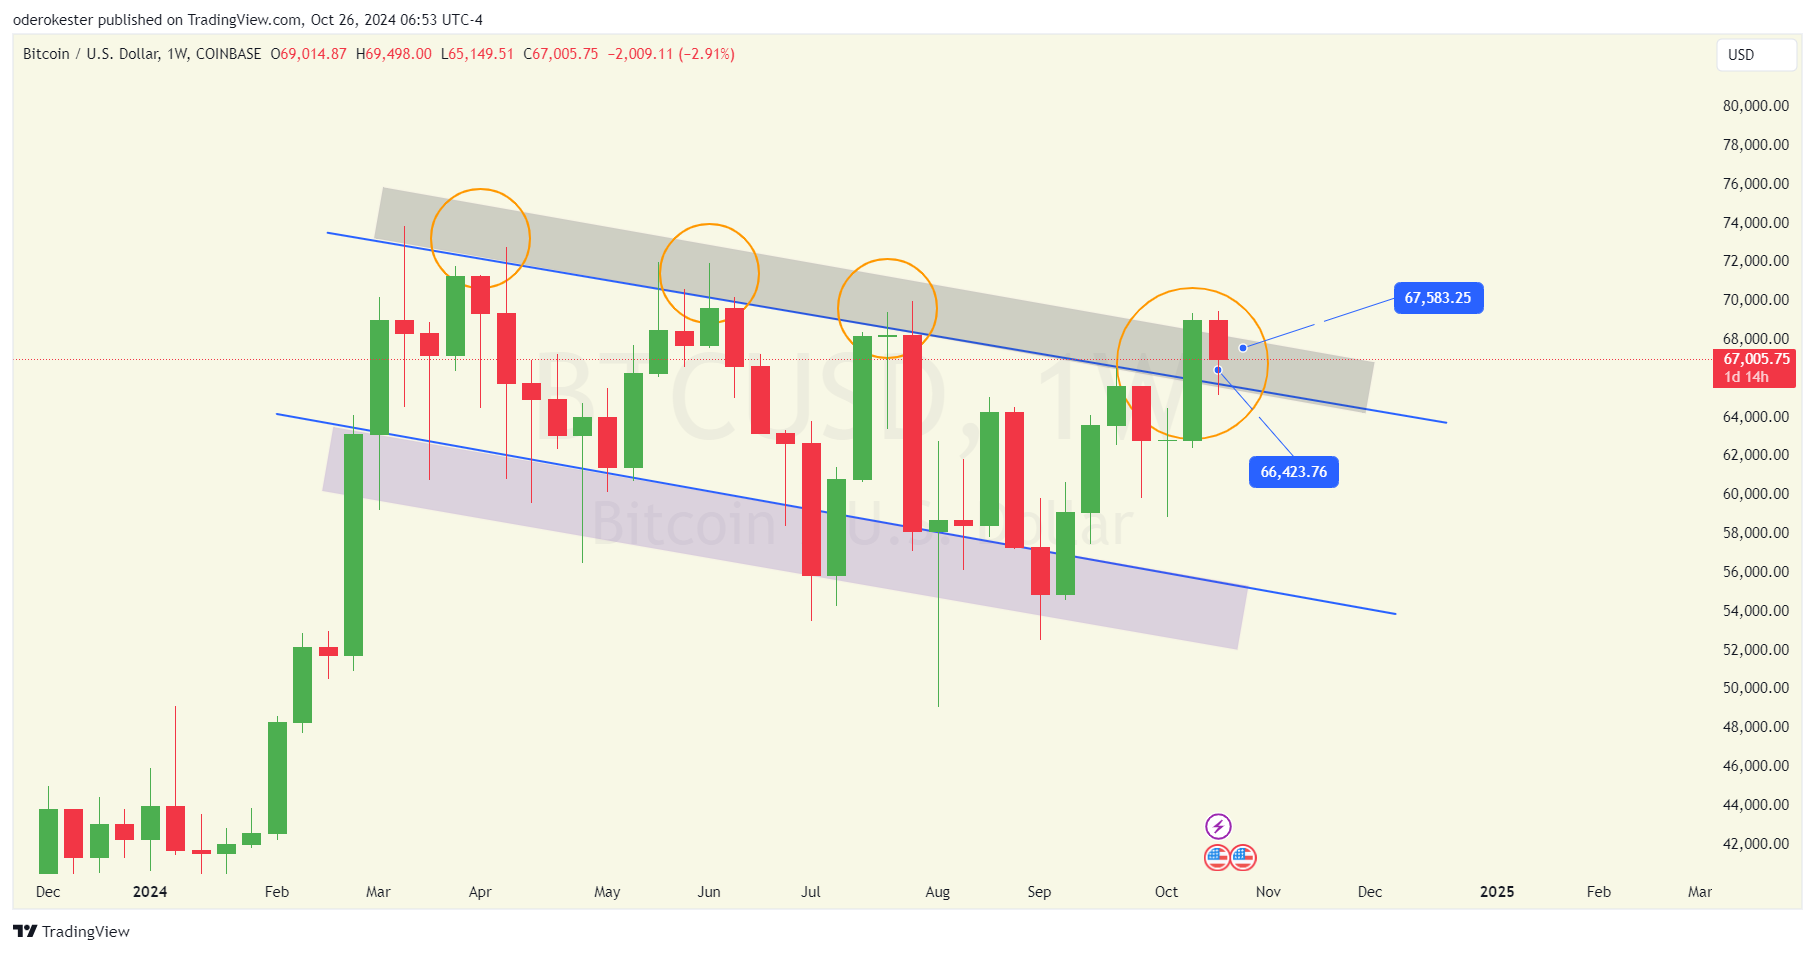
Source: TradingView
Support and resistance levels
Bitcoin’s press time upper resistance zone was between $67,583.25 and $69,000, a range that has consistently rejected bullish attempts.
If Bitcoin manages to break above this range, it could pave the way for an extended move toward $70,000.
However, failure to clear this level could see Bitcoin reverting lower within the descending channel.
Immediate support is identified around $66,423.76, marked as a critical level on the chart. Should Bitcoin breach this support, it could drop toward the lower boundary of the channel, projected between $60,000 and $62,000.
RSI and MACD analysis
At the time of this publication, Relative Strength Index (RSI) was at 56.75, positioned below its signal line at 63.00. This indicated that bullish momentum was weakening, approaching a more neutral zone.
Meanwhile, earlier in October, the RSI rose above 70, pointing to overbought conditions. The subsequent drop indicated a correction, yet the current RSI level still allows room for upward movement.
Maintaining above the 50 mark is important for bullish momentum to sustain.
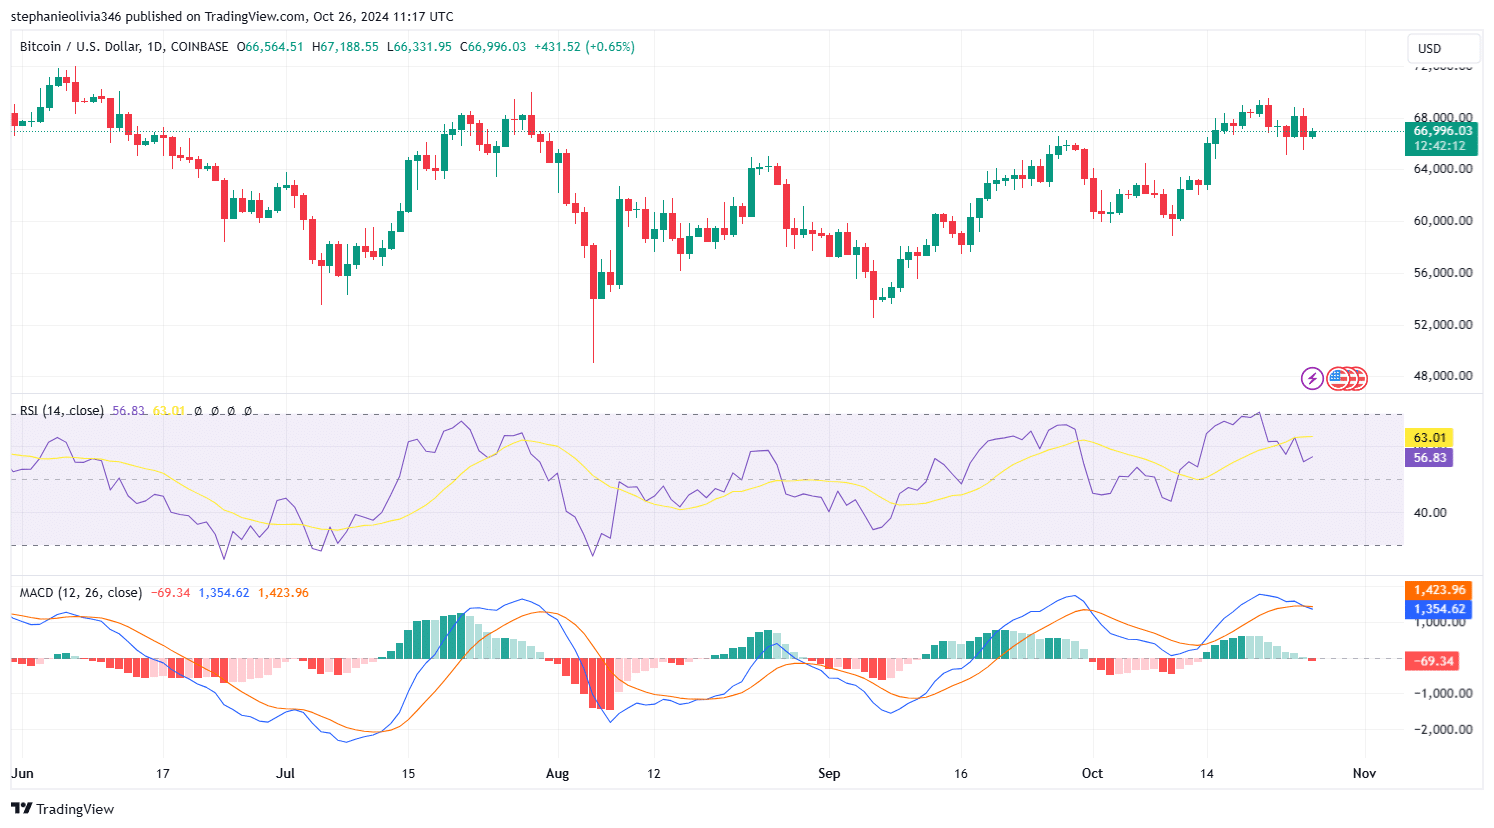
Source: TradingView
The Moving Average Convergence Divergence (MACD) line remains above the signal line, suggesting an ongoing bullish trend. However, shrinking histogram bars hint at decreasing momentum.
If the MACD line crosses below the signal line, it may indicate short-term downside or a period of consolidation.
On-chain activity
According to IntoTheBlock data, active Bitcoin addresses have increased by 5.20% in the last week, suggesting higher user engagement.
This contrasted with a 6.50% decline in new addresses, indicating that existing users were driving network activity.
Bitcoin’s 7-day average transaction volume stood at 539.81k BTC at press time, with a recent peak of 672.53k BTC on the 22nd of October and a low of 371.37k BTC on the 20th of October.
Source: IntoTheBlock
Read Bitcoin’s [BTC] Price Prediction 2024–2025
The fluctuating volume reflects shifting market activity, with the recent spike indicating rising engagement.
This variability in transaction volume suggests ongoing changes in trading patterns, which could shape Bitcoin’s price movements in the coming days.
- Bitcoin struggled against $67,583 resistance; breaking this level could trigger a move toward $70,000.
- RSI and MACD show weakening momentum, while rising active addresses suggest potential bullish activity.
Bitcoin [BTC] fell below $67,000, reaching an intraday low of $65,700 after losing its overnight gains. Priced at $66,972.95 at press time, it shows a 1.22% decline in the past 24 hours and 2.01% over the past week.
Despite the short-term dip, Bitcoin’s market cap remains at $1.32 trillion, with a circulating supply of 20 million BTC. In the last 24 hours, trading volume reached $46.32 billion, reflecting continued interest from traders.
Bitcoin has been trading within a clear descending channel. This pattern shows a series of lower highs and lower lows, indicating a bearish trend.
The upper boundary of this channel, near $69,000, has repeatedly acted as a strong resistance level, pushing prices lower after each attempt to break above it.
As seen on the chart, recent rejections have followed similar patterns, suggesting that this resistance remains a key challenge for further gains.
Source: TradingView
Support and resistance levels
Bitcoin’s press time upper resistance zone was between $67,583.25 and $69,000, a range that has consistently rejected bullish attempts.
If Bitcoin manages to break above this range, it could pave the way for an extended move toward $70,000.
However, failure to clear this level could see Bitcoin reverting lower within the descending channel.
Immediate support is identified around $66,423.76, marked as a critical level on the chart. Should Bitcoin breach this support, it could drop toward the lower boundary of the channel, projected between $60,000 and $62,000.
RSI and MACD analysis
At the time of this publication, Relative Strength Index (RSI) was at 56.75, positioned below its signal line at 63.00. This indicated that bullish momentum was weakening, approaching a more neutral zone.
Meanwhile, earlier in October, the RSI rose above 70, pointing to overbought conditions. The subsequent drop indicated a correction, yet the current RSI level still allows room for upward movement.
Maintaining above the 50 mark is important for bullish momentum to sustain.
Source: TradingView
The Moving Average Convergence Divergence (MACD) line remains above the signal line, suggesting an ongoing bullish trend. However, shrinking histogram bars hint at decreasing momentum.
If the MACD line crosses below the signal line, it may indicate short-term downside or a period of consolidation.
On-chain activity
According to IntoTheBlock data, active Bitcoin addresses have increased by 5.20% in the last week, suggesting higher user engagement.
This contrasted with a 6.50% decline in new addresses, indicating that existing users were driving network activity.
Bitcoin’s 7-day average transaction volume stood at 539.81k BTC at press time, with a recent peak of 672.53k BTC on the 22nd of October and a low of 371.37k BTC on the 20th of October.
Source: IntoTheBlock
Read Bitcoin’s [BTC] Price Prediction 2024–2025
The fluctuating volume reflects shifting market activity, with the recent spike indicating rising engagement.
This variability in transaction volume suggests ongoing changes in trading patterns, which could shape Bitcoin’s price movements in the coming days.


buying generic clomid price can i buy cheap clomid no prescription clomid uk buy can i purchase clomiphene without rx get clomid pills how to get clomid without prescription order generic clomid prices
I am actually happy to coup d’oeil at this blog posts which consists of tons of worthwhile facts, thanks for providing such data.
Thanks for sharing. It’s first quality.
order zithromax 500mg without prescription – purchase ciprofloxacin pill flagyl pills
rybelsus 14mg price – order cyproheptadine 4mg pills cyproheptadine 4mg price
buy motilium generic – buy cyclobenzaprine tablets flexeril pills
buy augmentin generic – atbioinfo buy acillin tablets
esomeprazole 20mg cost – https://anexamate.com/ esomeprazole order
warfarin generic – https://coumamide.com/ buy hyzaar for sale
buy meloxicam 7.5mg pills – tenderness mobic 7.5mg uk
oral deltasone – corticosteroid buy deltasone sale
buy ed pills best price – https://fastedtotake.com/ ed pills for sale
order amoxicillin online cheap – combamoxi buy generic amoxil
buy fluconazole 200mg pill – flucoan diflucan pill
buy generic cenforce – https://cenforcers.com/# buy cenforce pills for sale
buy cheap tadalafil online – ciltad genesis tadalafil (exilar-sava healthcare) version of cialis] (rx) lowest price
ranitidine medication – https://aranitidine.com/# buy zantac without prescription
best place to buy liquid tadalafil – cialis samples tadalafil prescribing information
buy viagra hyderabad india – can you really buy viagra online generic viagra 50 mg
Good blog you be undergoing here.. It’s severely to find elevated worth script like yours these days. I really appreciate individuals like you! Go through mindfulness!! prednisone sale
This website positively has all of the tidings and facts I needed there this case and didn’t identify who to ask. ursxdol.com
This website exceedingly has all of the information and facts I needed about this subject and didn’t positive who to ask. https://prohnrg.com/product/orlistat-pills-di/
This is the tolerant of post I find helpful. https://aranitidine.com/fr/levitra_francaise/