- BTC LTHs are torn between selling and holding amidst price volatility.
- Bitcoin remained below $60,000 at press time.
The recent increase in Bitcoin’s [BTC] volatility is evident, as its price struggles to maintain the crucial $60,000 range.
Despite these price fluctuations, a notable trend has emerged: Bitcoin exchange reserves have declined. This decrease in exchange reserves indicates that major holders, often called “whales,” are increasingly unwilling to sell their Bitcoin.
Bitcoin exchange reserves hit another low
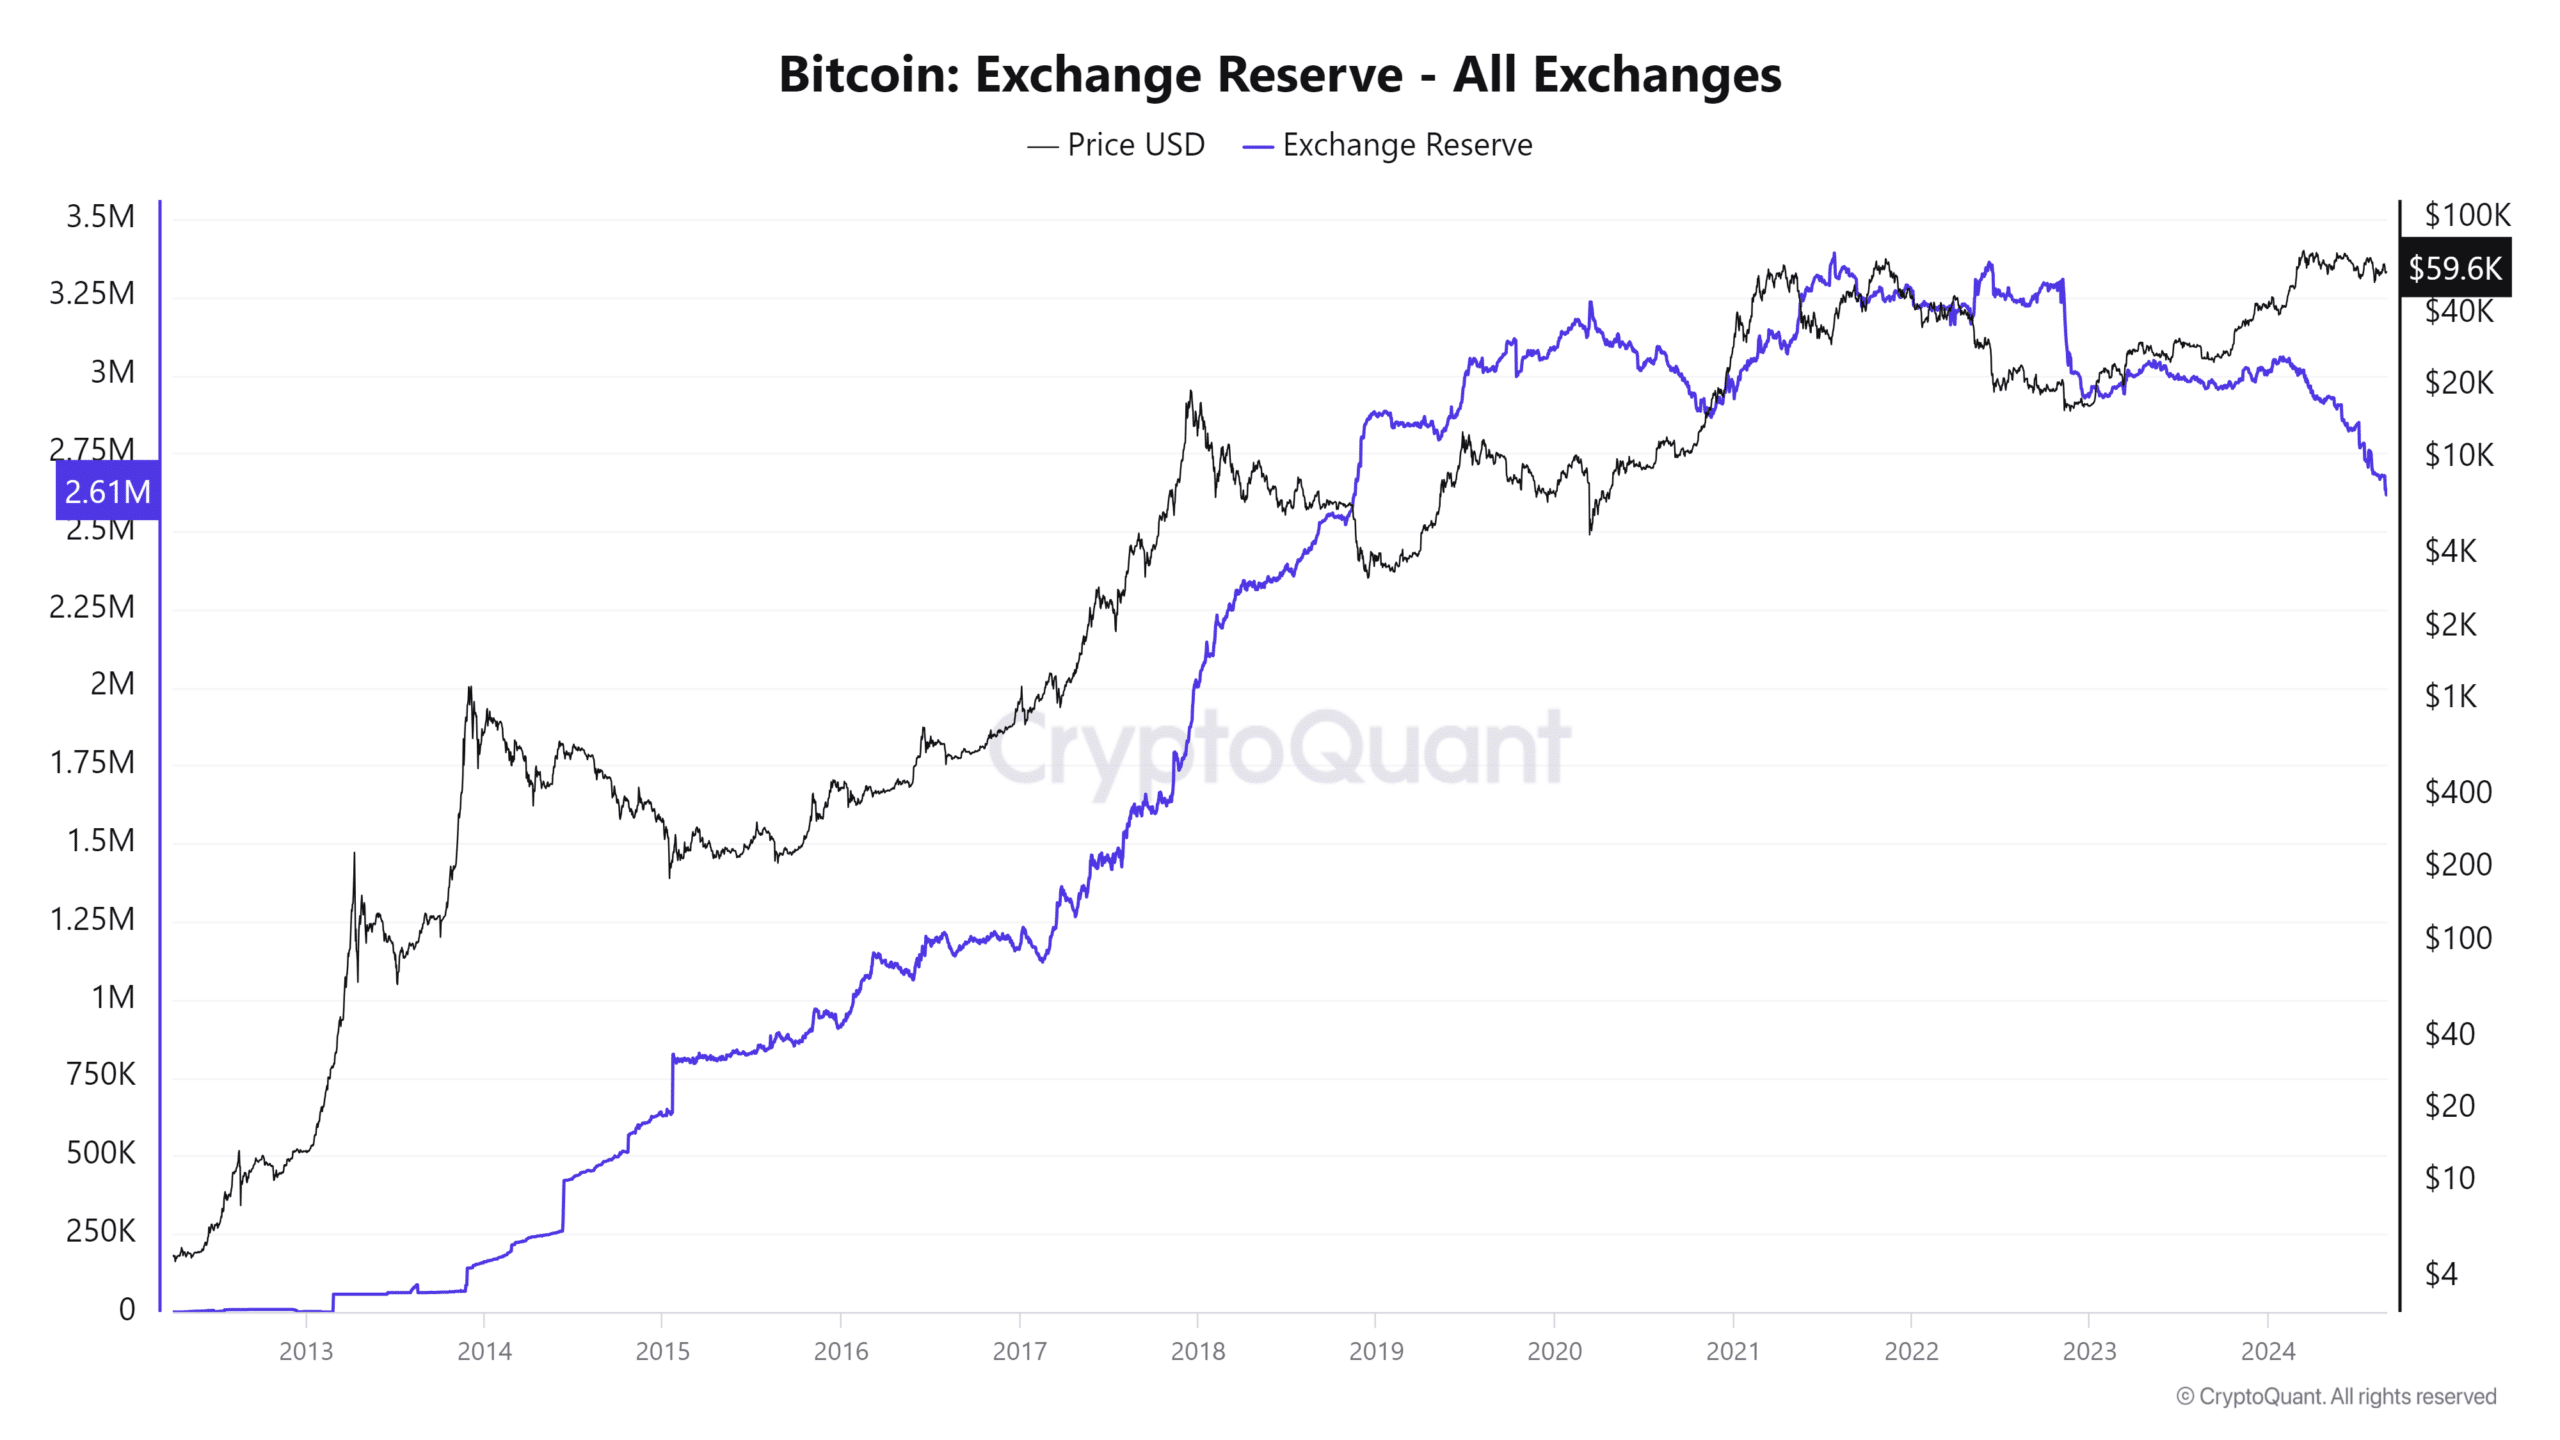
AMBCrypto’s analysis of Bitcoin’s exchange reserves revealed that they have hit another low, continuing a significant downward trend that began at the start of the year.
According to the chart on CryptoQuant, the reserves have fallen to approximately 2.6 million BTC. This was down from over 3 million BTC reserves recorded in January.
Also, this decline in exchange reserves suggests a reduction in the liquidity available on exchanges.
This reduction in liquidity can be a positive sign for Bitcoin’s price, as it indicates that fewer holders are looking to sell their BTC. The move reduces the selling pressure on the market.

Source: CryptoQuant
Furthermore, the ongoing decline in exchange reserves is likely driven by long-term holders (HODLers). This behavior reflects a strong belief in Bitcoin’s future value and a reluctance to engage in short-term trading.
As long-term holders’ dominance increases, the market could become more stable and less susceptible to large panic sales.
Comparing CDD with Bitcoin exchange reserves
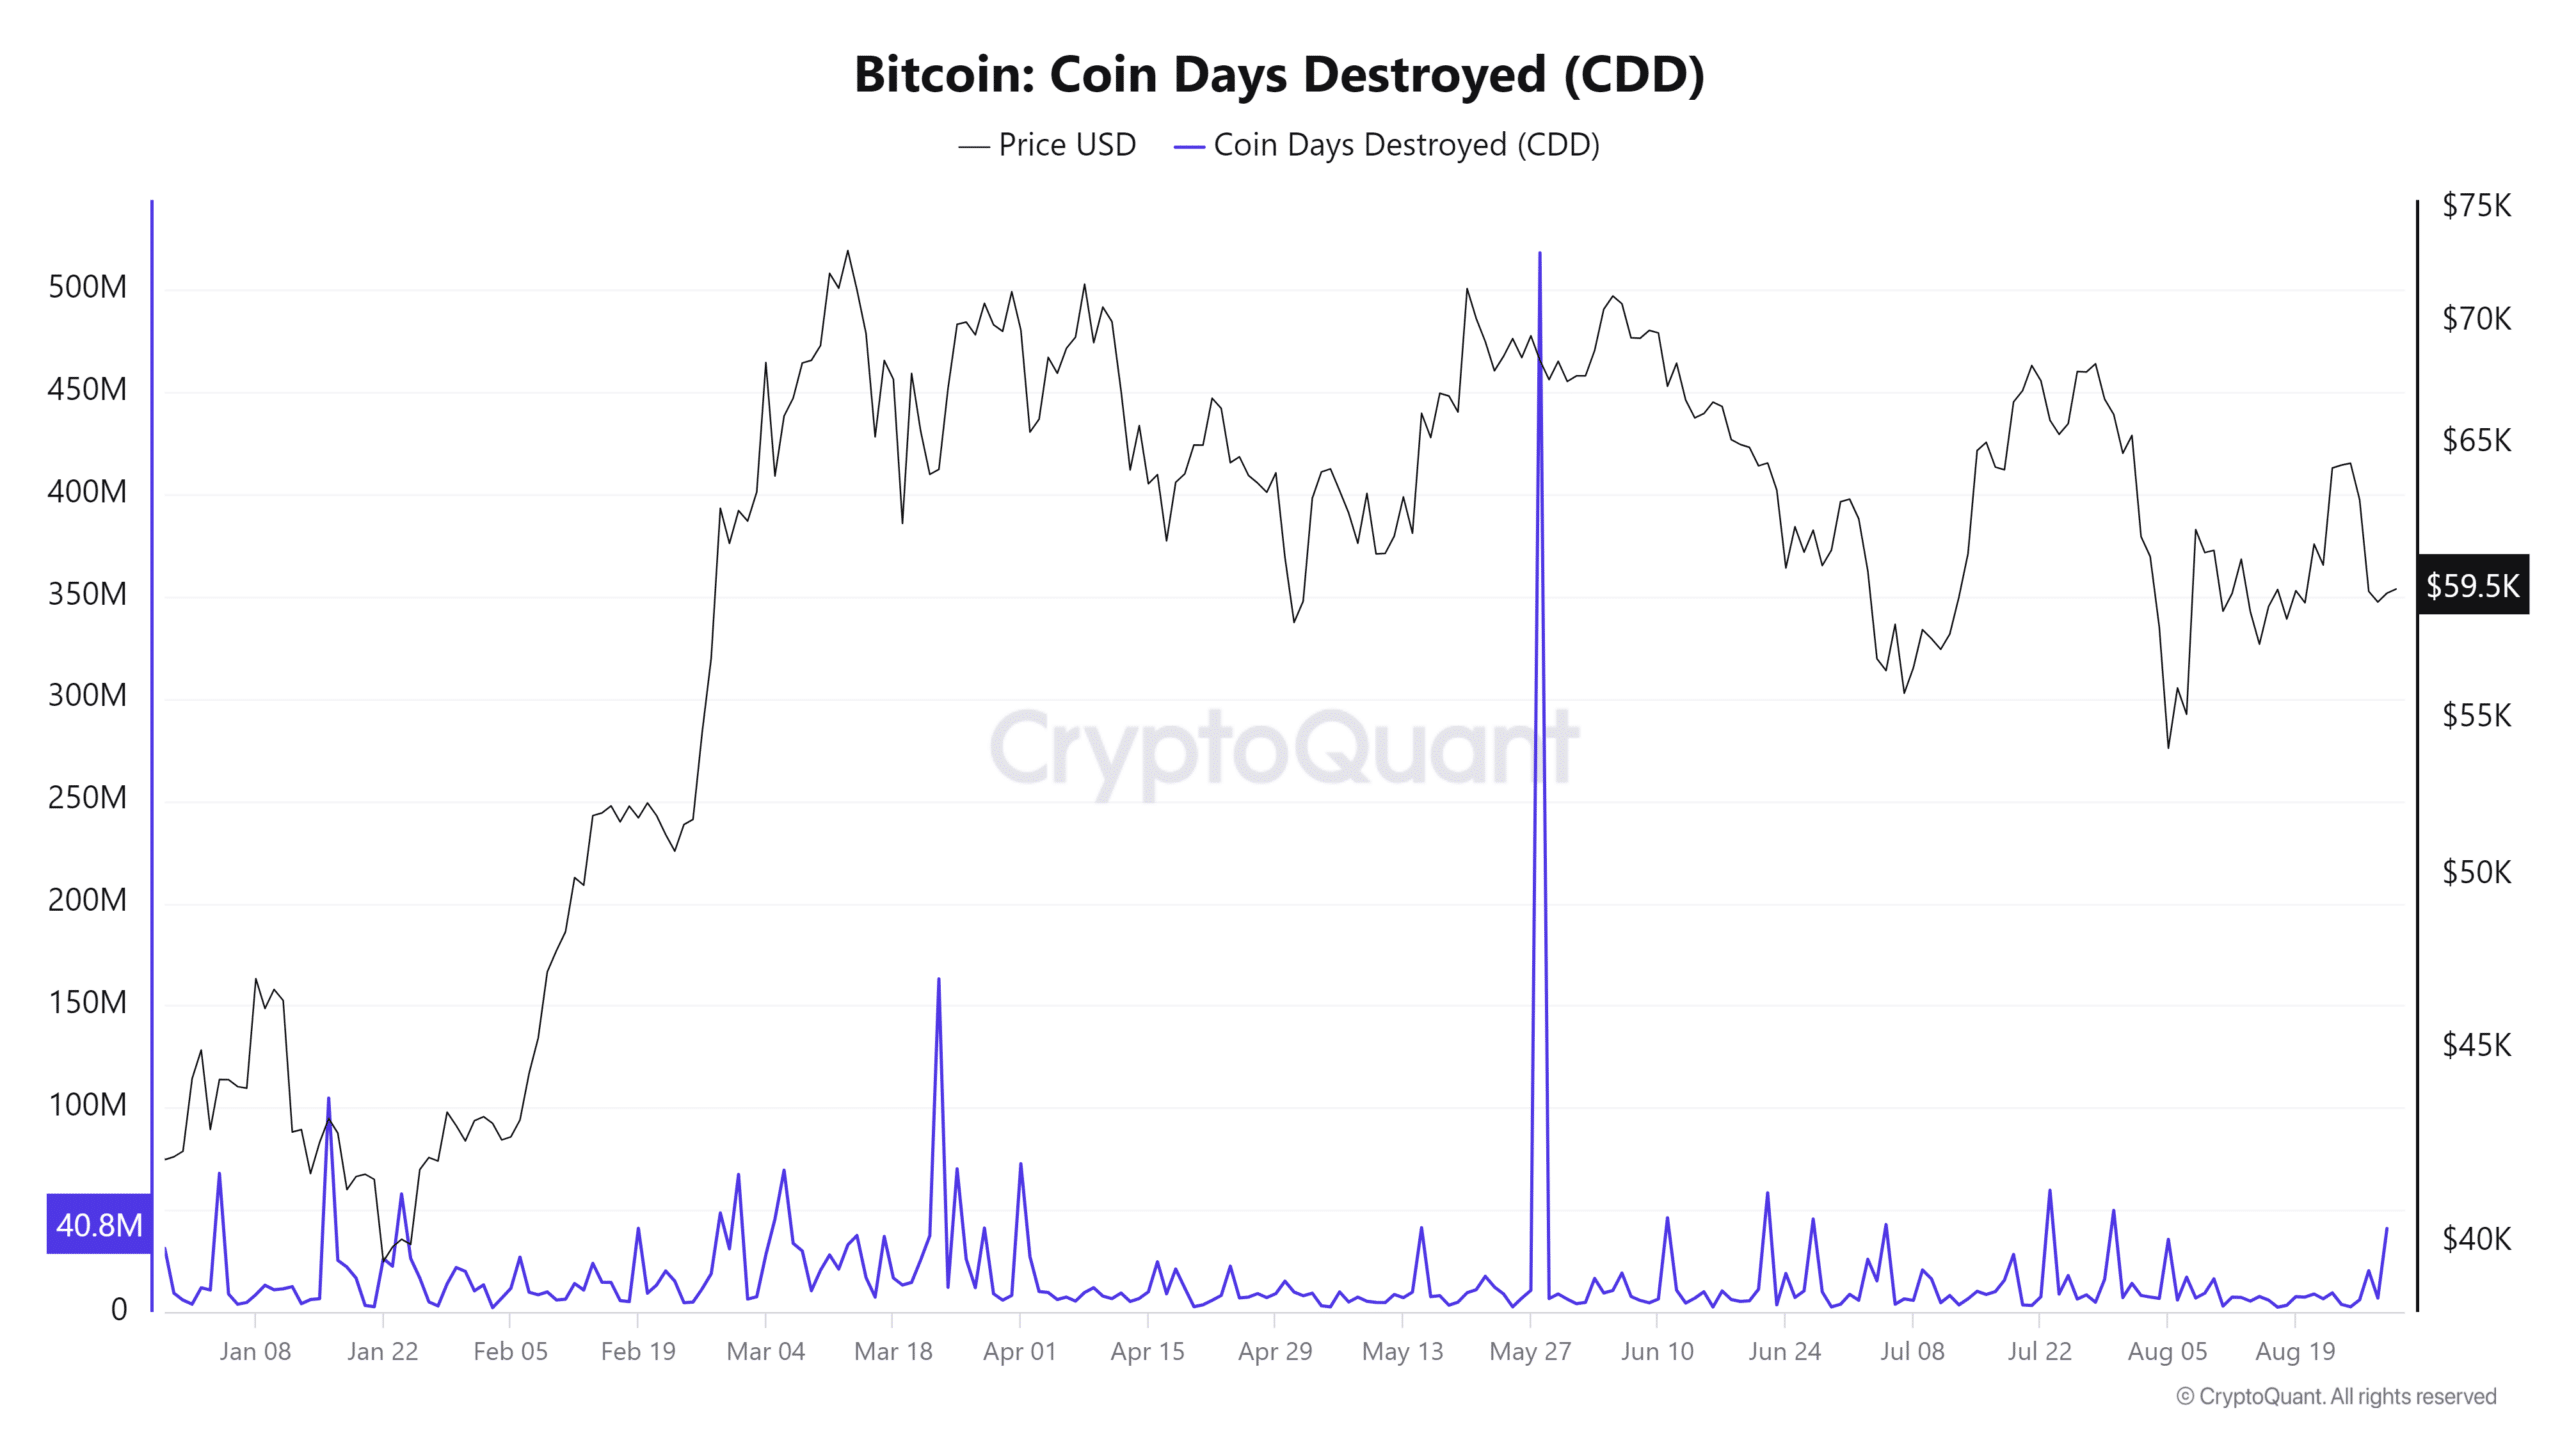
The recent analysis of Bitcoin’s Coin Day Destroyed (CDD) metric alongside Bitcoin exchange reserves suggests an interesting divergence. The CDD metric has experienced a slight spike recently.
This contrasted with the previously stable trend that indicated long-term holders (LTHs) were not actively spending their coins.
The CDD metric tracks the movement of older Bitcoins that have accumulated “coin days” while remaining unspent. Each Bitcoin earns a “coin day” for everyday it is held in a wallet without being moved.
When these Bitcoins are eventually spent, the accumulated coin days are “destroyed,” hence the term “Coin Day Destroyed.”

Source: CryptoQuant
The recent increase in CDD suggests that the recent volatility in Bitcoin’s price may have triggered some long-term holders to move or sell their coins, breaking the previous trend of holding.
This shift could be a response to market uncertainty or a strategic decision by some holders to capitalize on price movements.
BTC remains volatile
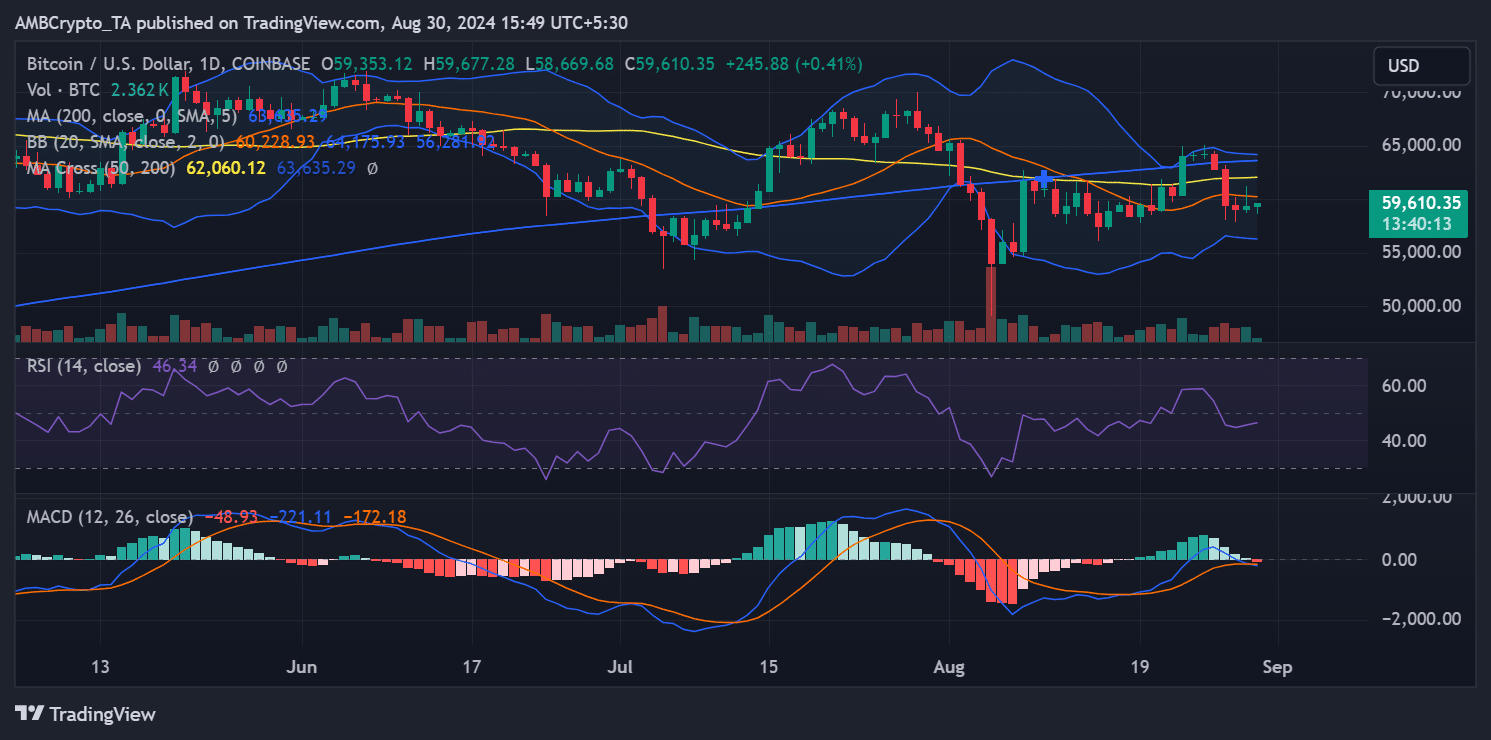
The recent analysis of Bitcoin’s daily price trend indicates that Bitcoin rose to approximately $61,000 in the previous trading session. However, it could not sustain this level and eventually closed the session at around $59,264.
This pattern of briefly reaching higher prices before retreating has been a consistent trend for Bitcoin over the last few days, contributing to increased market volatility.

Source: TradingView
The extent of this volatility is further illustrated by the behavior of Bitcoin’s Bollinger Bands, a technical indicator that measures price volatility.
Read Bitcoin’s [BTC] Price Prediction 2024-25
The “elasticity” of the Bollinger Bands refers to their widening in response to increased price fluctuations. When the bands stretch wider, it signifies higher volatility as the price moves more dramatically in either direction.
As of this writing, Bitcoin is trading at around $59,597, with a slight increase of less than 1%. The ongoing volatility, as shown by the Bollinger Bands, suggests that Bitcoin is experiencing significant short-term price swings.
- BTC LTHs are torn between selling and holding amidst price volatility.
- Bitcoin remained below $60,000 at press time.
The recent increase in Bitcoin’s [BTC] volatility is evident, as its price struggles to maintain the crucial $60,000 range.
Despite these price fluctuations, a notable trend has emerged: Bitcoin exchange reserves have declined. This decrease in exchange reserves indicates that major holders, often called “whales,” are increasingly unwilling to sell their Bitcoin.
Bitcoin exchange reserves hit another low
AMBCrypto’s analysis of Bitcoin’s exchange reserves revealed that they have hit another low, continuing a significant downward trend that began at the start of the year.
According to the chart on CryptoQuant, the reserves have fallen to approximately 2.6 million BTC. This was down from over 3 million BTC reserves recorded in January.
Also, this decline in exchange reserves suggests a reduction in the liquidity available on exchanges.
This reduction in liquidity can be a positive sign for Bitcoin’s price, as it indicates that fewer holders are looking to sell their BTC. The move reduces the selling pressure on the market.

Source: CryptoQuant
Furthermore, the ongoing decline in exchange reserves is likely driven by long-term holders (HODLers). This behavior reflects a strong belief in Bitcoin’s future value and a reluctance to engage in short-term trading.
As long-term holders’ dominance increases, the market could become more stable and less susceptible to large panic sales.
Comparing CDD with Bitcoin exchange reserves
The recent analysis of Bitcoin’s Coin Day Destroyed (CDD) metric alongside Bitcoin exchange reserves suggests an interesting divergence. The CDD metric has experienced a slight spike recently.
This contrasted with the previously stable trend that indicated long-term holders (LTHs) were not actively spending their coins.
The CDD metric tracks the movement of older Bitcoins that have accumulated “coin days” while remaining unspent. Each Bitcoin earns a “coin day” for everyday it is held in a wallet without being moved.
When these Bitcoins are eventually spent, the accumulated coin days are “destroyed,” hence the term “Coin Day Destroyed.”

Source: CryptoQuant
The recent increase in CDD suggests that the recent volatility in Bitcoin’s price may have triggered some long-term holders to move or sell their coins, breaking the previous trend of holding.
This shift could be a response to market uncertainty or a strategic decision by some holders to capitalize on price movements.
BTC remains volatile
The recent analysis of Bitcoin’s daily price trend indicates that Bitcoin rose to approximately $61,000 in the previous trading session. However, it could not sustain this level and eventually closed the session at around $59,264.
This pattern of briefly reaching higher prices before retreating has been a consistent trend for Bitcoin over the last few days, contributing to increased market volatility.

Source: TradingView
The extent of this volatility is further illustrated by the behavior of Bitcoin’s Bollinger Bands, a technical indicator that measures price volatility.
Read Bitcoin’s [BTC] Price Prediction 2024-25
The “elasticity” of the Bollinger Bands refers to their widening in response to increased price fluctuations. When the bands stretch wider, it signifies higher volatility as the price moves more dramatically in either direction.
As of this writing, Bitcoin is trading at around $59,597, with a slight increase of less than 1%. The ongoing volatility, as shown by the Bollinger Bands, suggests that Bitcoin is experiencing significant short-term price swings.


buying generic clomid pill order clomiphene pill where can i buy generic clomid generic clomiphene without dr prescription can i get generic clomid for sale can you buy cheap clomiphene online buy clomid pill
Palatable blog you be undergoing here.. It’s intricate to espy great status article like yours these days. I honestly appreciate individuals like you! Withstand vigilance!!
Thanks for putting this up. It’s evidently done.
buy zithromax medication – azithromycin 250mg generic buy metronidazole 400mg online
buy semaglutide generic – semaglutide for sale online buy cyproheptadine 4 mg without prescription
order domperidone online – buy generic flexeril online buy flexeril medication
inderal pill – order methotrexate pill methotrexate 2.5mg price
buy amoxil without prescription – order generic amoxicillin ipratropium over the counter
buy generic azithromycin 250mg – order zithromax sale cost bystolic 5mg
buy augmentin 625mg sale – atbioinfo buy ampicillin cheap
oral esomeprazole 40mg – https://anexamate.com/ nexium 40mg usa
medex for sale online – cou mamide cozaar over the counter
mobic medication – relieve pain buy generic meloxicam for sale
prednisone 40mg pills – adrenal order prednisone 5mg sale
buy erection pills – erection pills buy ed pills uk
amoxil pills – https://combamoxi.com/ buy generic amoxil online
buy cheap diflucan – https://gpdifluca.com/ buy fluconazole sale
order cenforce 100mg without prescription – https://cenforcers.com/# buy cenforce 100mg generic
is tadalafil available in generic form – fast ciltad which is better cialis or levitra
zantac 150mg drug – https://aranitidine.com/ order ranitidine 300mg generic
cialis canada prices – https://strongtadafl.com/# cialis delivery held at customs
I am in point of fact thrilled to glitter at this blog posts which consists of tons of useful facts, thanks representing providing such data. https://gnolvade.com/es/comprar-cenforce-online/
viagra sale sydney – strong vpls how to order viagra in australia
The thoroughness in this break down is noteworthy. prednisone prices
More posts like this would add up to the online play more useful. https://ursxdol.com/azithromycin-pill-online/
This is the stripe of content I enjoy reading. prohnrg.com
The thoroughness in this section is noteworthy. https://aranitidine.com/fr/acheter-cenforce/