


- Bitcoin and Ethereum saw a notable decline in retail adoption, as reflected by shrinking network activity.
- Will Q2 signal the onset of a deeper corrective cycle?
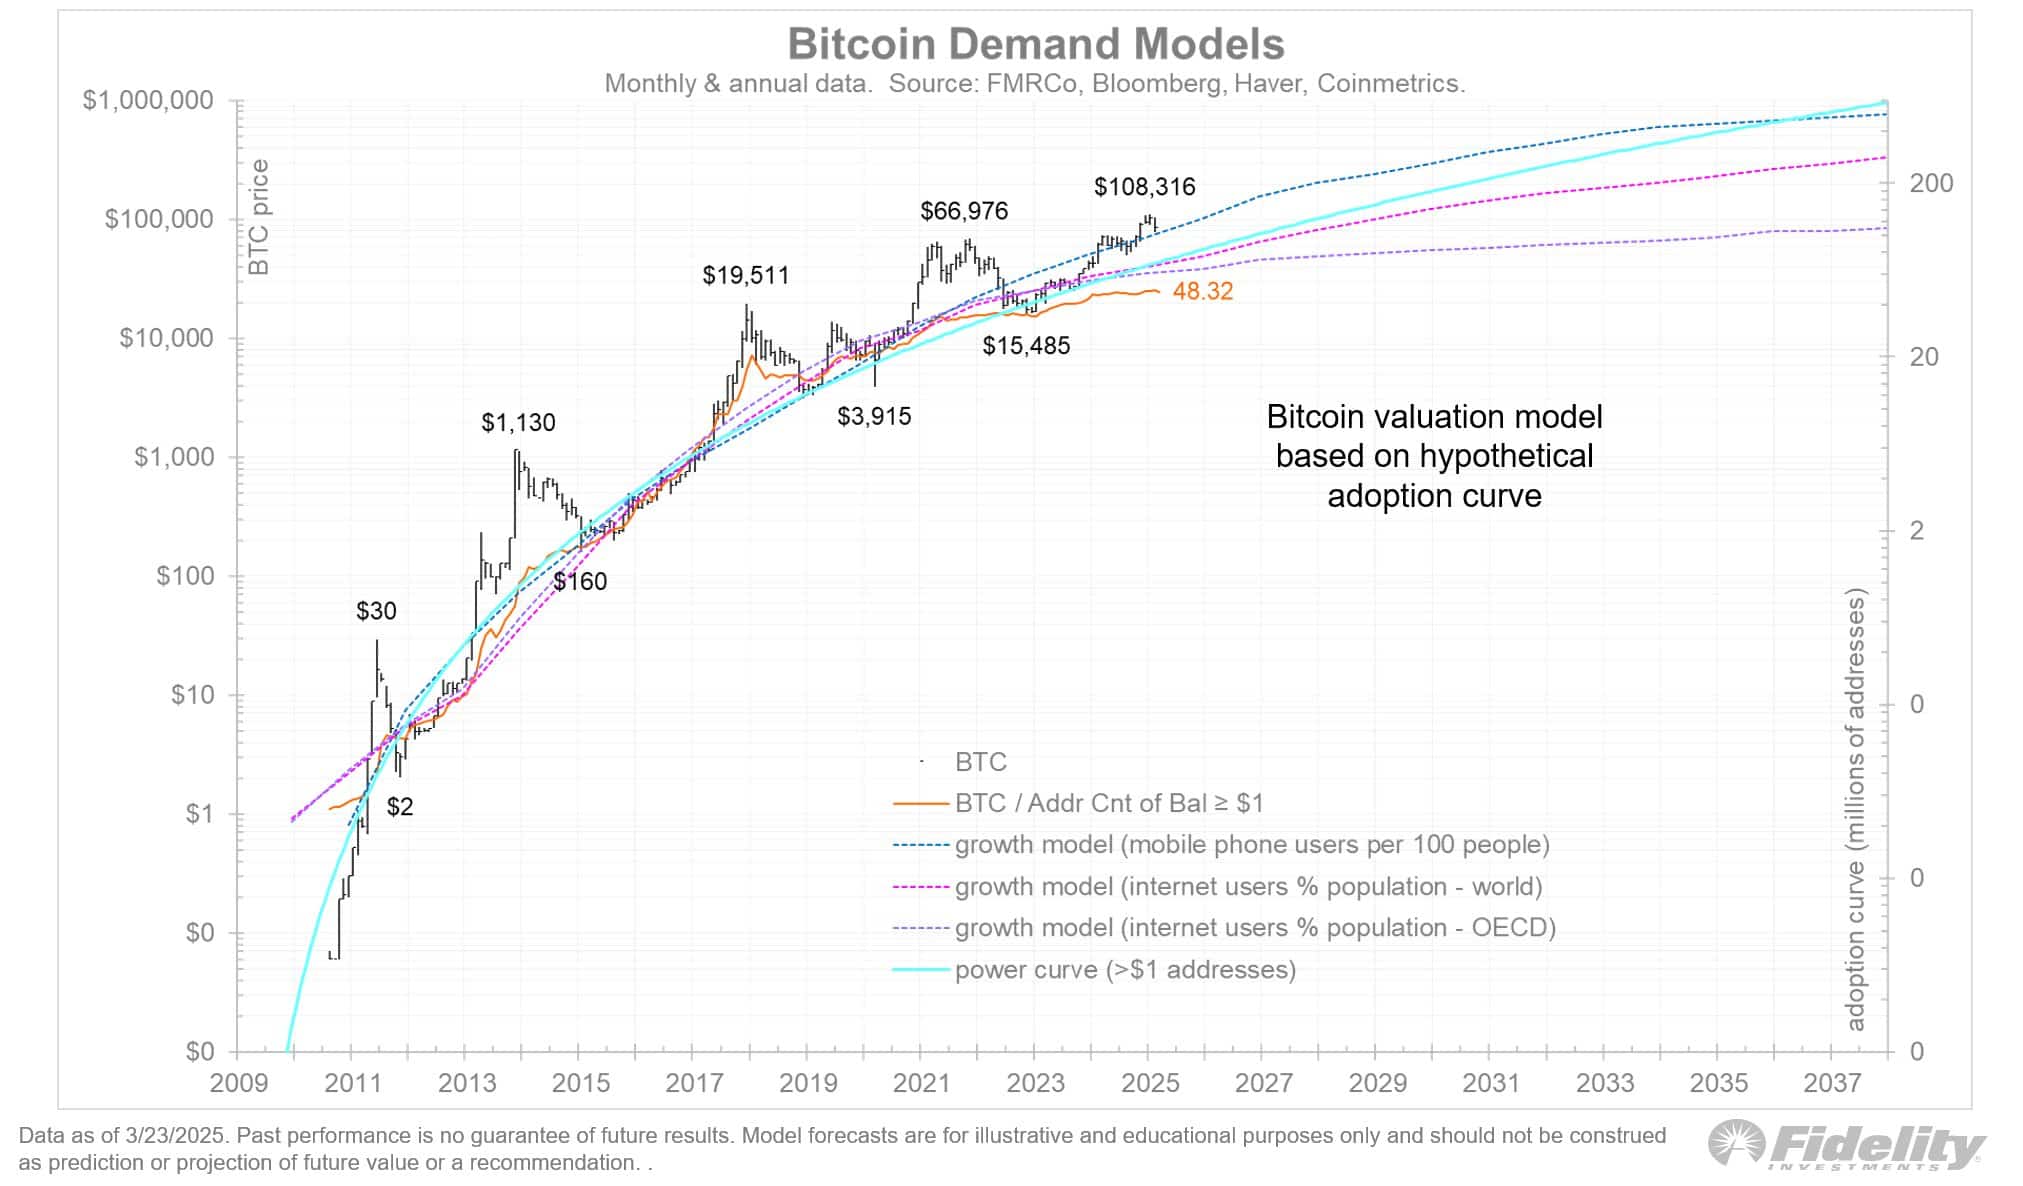
According to the chart below, since Bitcoin’s [BTC] post-2020 bull cycle, the expansion of unique wallets and active addresses has slowed, particularly among wallets holding balances exceeding $1.
This stagnation aligns with the adoption curve model, suggesting institutional accumulation has consolidated BTC into fewer high-value wallets.

Source: Fidelity Investments
In simple words, large-scale entities, such as MicroStrategy (MSTR) have concentrated holdings, reducing the need for broad wallet distribution. As a result, broader distribution among retail participants has declined.
Ethereum [ETH] has mirrored this trend, registering its lowest adoption rate in 2025. As institutional dominance grows, on-chain metrics may become less reliable for assessing retail adoption in the future.
The market impact of this structural shift could be profound. Institutional wallets increasingly dictate liquidity cycles. For instance, Bitcoin’s sharp retracement to $77k in February directly correlated with sustained BTC ETF outflows.
On the 25th of February, BTC ETFs registered a net outflow of $1.4 billion, catalyzing a 5.11% price decline within 24 hours. Ethereum ETFs have similarly remained in a persistent sell-side phase, struggling to attract fresh inflows.
More critically, these institutional outflows have coincided with Trump’s aggressive tariff policies, adding a macroeconomic layer to crypto market volatility.
As Q2 unfolds, the administration appears to be in full “reset” mode. While market reactions remain uncertain, Bitcoin and Ethereum’s failure to replicate their Q1 rally raises the question:
Will Q2 bring a bleak bearish cycle?
Food for thought: Is Bitcoin and Ethereum’s Q2 cycle at risk?
Within two weeks, Bitcoin has reclaimed $88k as BTC ETFs reverted to net inflows. MSTR capitalized on this momentum, accumulating 6,911 BTC for $584 million at an average acquisition price of $86k.
Ethereum followed suit, briefly retesting $2k. However, its prolonged consolidation, coupled with declining network adoption and subdued institutional inflows, suggests underlying structural weakness.
If BTC encounters resistance and retraces, ETH’s price action could be vulnerable to a deeper corrective phase.
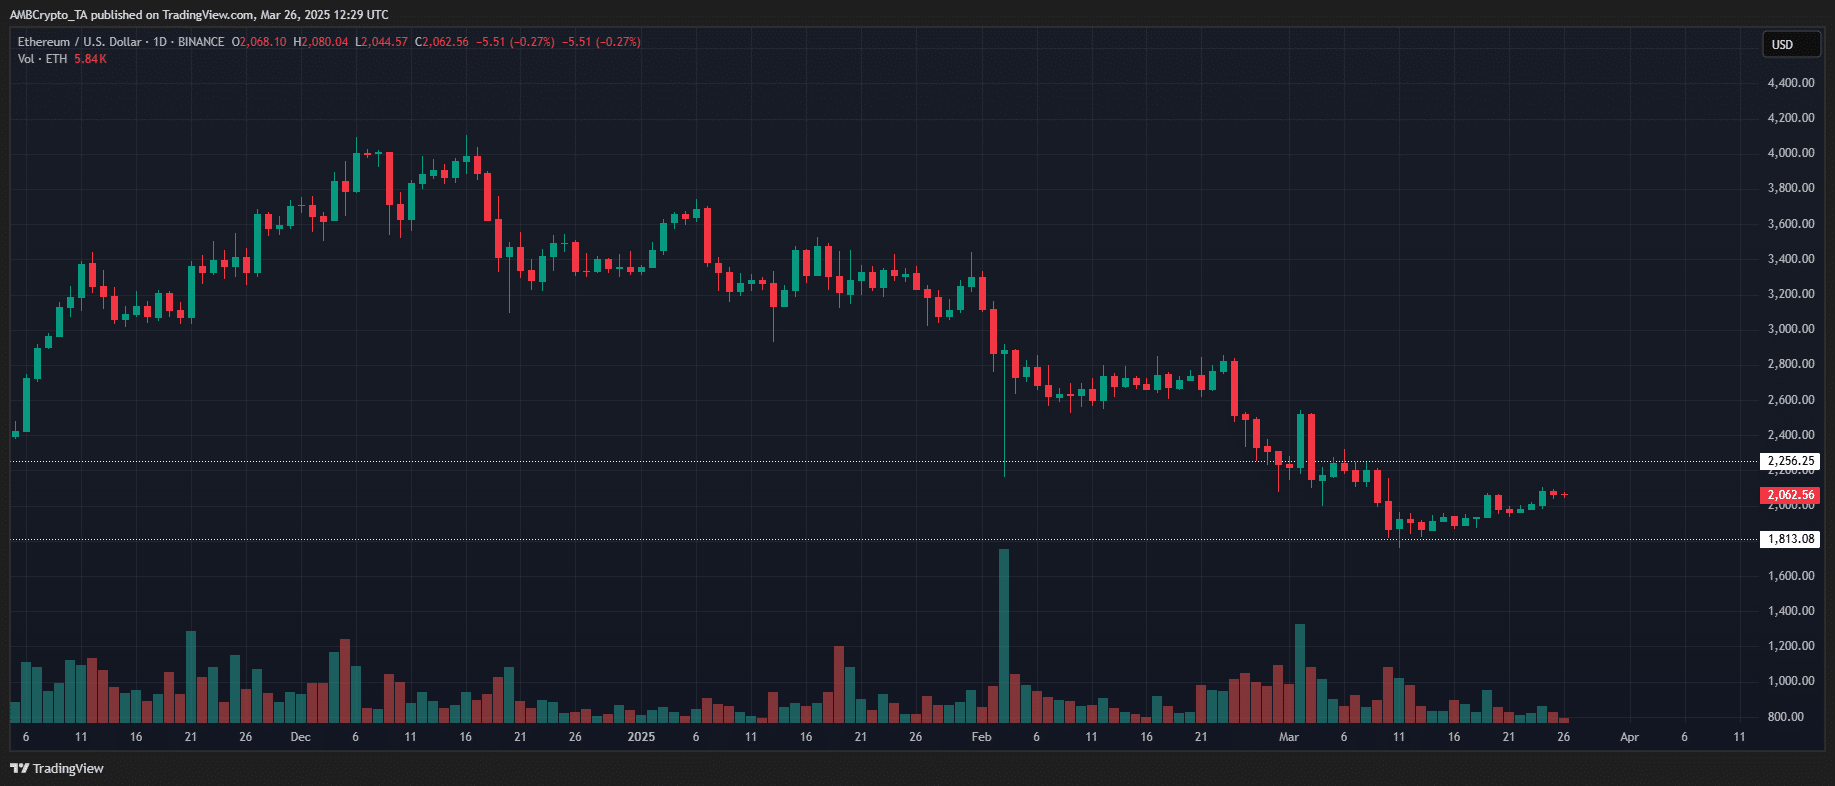
Source: TradingView (ETH/USDT)
Weak fundamentals and selective accumulation by high-value wallets could act as a headwind for both Bitcoin and Ethereum’s Q2 rally.
Historically, BTC’s Q1 strength has triggered an altcoin surge, yet this cycle’s price action has diverged. The key differentiator? Heightened macroeconomic volatility.
If institutional capital inflows fail to offset this volatility in the upcoming quarter, both Bitcoin and Ethereum may face distribution pressure and delay a full-scale trend continuation.
- Bitcoin and Ethereum saw a notable decline in retail adoption, as reflected by shrinking network activity.
- Will Q2 signal the onset of a deeper corrective cycle?
According to the chart below, since Bitcoin’s [BTC] post-2020 bull cycle, the expansion of unique wallets and active addresses has slowed, particularly among wallets holding balances exceeding $1.
This stagnation aligns with the adoption curve model, suggesting institutional accumulation has consolidated BTC into fewer high-value wallets.
Source: Fidelity Investments
In simple words, large-scale entities, such as MicroStrategy (MSTR) have concentrated holdings, reducing the need for broad wallet distribution. As a result, broader distribution among retail participants has declined.
Ethereum [ETH] has mirrored this trend, registering its lowest adoption rate in 2025. As institutional dominance grows, on-chain metrics may become less reliable for assessing retail adoption in the future.
The market impact of this structural shift could be profound. Institutional wallets increasingly dictate liquidity cycles. For instance, Bitcoin’s sharp retracement to $77k in February directly correlated with sustained BTC ETF outflows.
On the 25th of February, BTC ETFs registered a net outflow of $1.4 billion, catalyzing a 5.11% price decline within 24 hours. Ethereum ETFs have similarly remained in a persistent sell-side phase, struggling to attract fresh inflows.
More critically, these institutional outflows have coincided with Trump’s aggressive tariff policies, adding a macroeconomic layer to crypto market volatility.
As Q2 unfolds, the administration appears to be in full “reset” mode. While market reactions remain uncertain, Bitcoin and Ethereum’s failure to replicate their Q1 rally raises the question:
Will Q2 bring a bleak bearish cycle?
Food for thought: Is Bitcoin and Ethereum’s Q2 cycle at risk?
Within two weeks, Bitcoin has reclaimed $88k as BTC ETFs reverted to net inflows. MSTR capitalized on this momentum, accumulating 6,911 BTC for $584 million at an average acquisition price of $86k.
Ethereum followed suit, briefly retesting $2k. However, its prolonged consolidation, coupled with declining network adoption and subdued institutional inflows, suggests underlying structural weakness.
If BTC encounters resistance and retraces, ETH’s price action could be vulnerable to a deeper corrective phase.
Source: TradingView (ETH/USDT)
Weak fundamentals and selective accumulation by high-value wallets could act as a headwind for both Bitcoin and Ethereum’s Q2 rally.
Historically, BTC’s Q1 strength has triggered an altcoin surge, yet this cycle’s price action has diverged. The key differentiator? Heightened macroeconomic volatility.
If institutional capital inflows fail to offset this volatility in the upcoming quarter, both Bitcoin and Ethereum may face distribution pressure and delay a full-scale trend continuation.


cost cheap clomiphene pills can i buy cheap clomiphene price buy clomiphene clomid chart cost of clomiphene pill how to buy cheap clomid without dr prescription where buy clomid without dr prescription
With thanks. Loads of knowledge!
More content pieces like this would create the web better.
buy generic azithromycin 500mg – buy generic tindamax for sale metronidazole order online
buy semaglutide 14mg – rybelsus cost generic cyproheptadine 4mg
motilium 10mg tablet – buy tetracycline 500mg online buy generic cyclobenzaprine 15mg
buy generic inderal – buy clopidogrel 150mg generic buy methotrexate 5mg pills
buy amoxicillin tablets – amoxicillin cost buy ipratropium 100 mcg online
how to get azithromycin without a prescription – purchase tinidazole online cheap bystolic pills
cost augmentin 625mg – atbioinfo.com ampicillin pills
nexium 40mg brand – https://anexamate.com/ nexium pills
cost warfarin 5mg – blood thinner buy cozaar 50mg online cheap
buy meloxicam generic – tenderness meloxicam order online
prednisone 10mg pills – allergic reactions order generic deltasone 20mg
best ed pills non prescription uk – https://fastedtotake.com/ mens erection pills
cheap amoxicillin generic – https://combamoxi.com/ buy amoxil pills for sale
diflucan brand – purchase forcan generic fluconazole 100mg cost
buy cenforce 100mg online cheap – buy cenforce medication buy generic cenforce over the counter
buy cialis online from canada – https://ciltadgn.com/ take cialis the correct way
cialis store in philippines – cialis canada free sample how to get cialis without doctor
buy ranitidine 300mg for sale – https://aranitidine.com/# brand ranitidine 150mg
order viagra online illegal – https://strongvpls.com/ sildenafil citrate 50mg price
More peace pieces like this would create the интернет better. this
I’ll certainly return to be familiar with more. buy generic azithromycin
This is the kind of writing I truly appreciate. https://ursxdol.com/get-cialis-professional/
This is the big-hearted of criticism I truly appreciate. online
Thanks on putting this up. It’s evidently done. levitra effet secondaire
Thanks towards putting this up. It’s well done. https://ondactone.com/simvastatin/
I’ll certainly return to review more.
online keflex
More articles like this would frame the blogosphere richer. http://zqykj.com/bbs/home.php?mod=space&uid=302514
cheap forxiga – order forxiga without prescription dapagliflozin 10mg drug
buy xenical generic – orlistat without prescription generic xenical 60mg