


![What Is Asset Tokenization? Types, Why It Matters Now [2025]](https://coininsights.com/wp-content/uploads/2025/05/asset_tokenization-360x180.png)


- Analysts project a possible BTC rise after a record uptick in US money supply.
- However, short positions against BTC have spiked, raising fears of a price correction.
Bitcoin [BTC] has been in a price consolidation range between $60K and $70K for weeks, a boring set-up for speculators who thrive on volatility.
This sideways movement extended after the April halving event and the seemingly ‘stagnant’ demand from US spot BTC ETFs.
But there’s a new developing narrative for the King coin—an uptick in the US money supply.
Bitcoin’s path forward
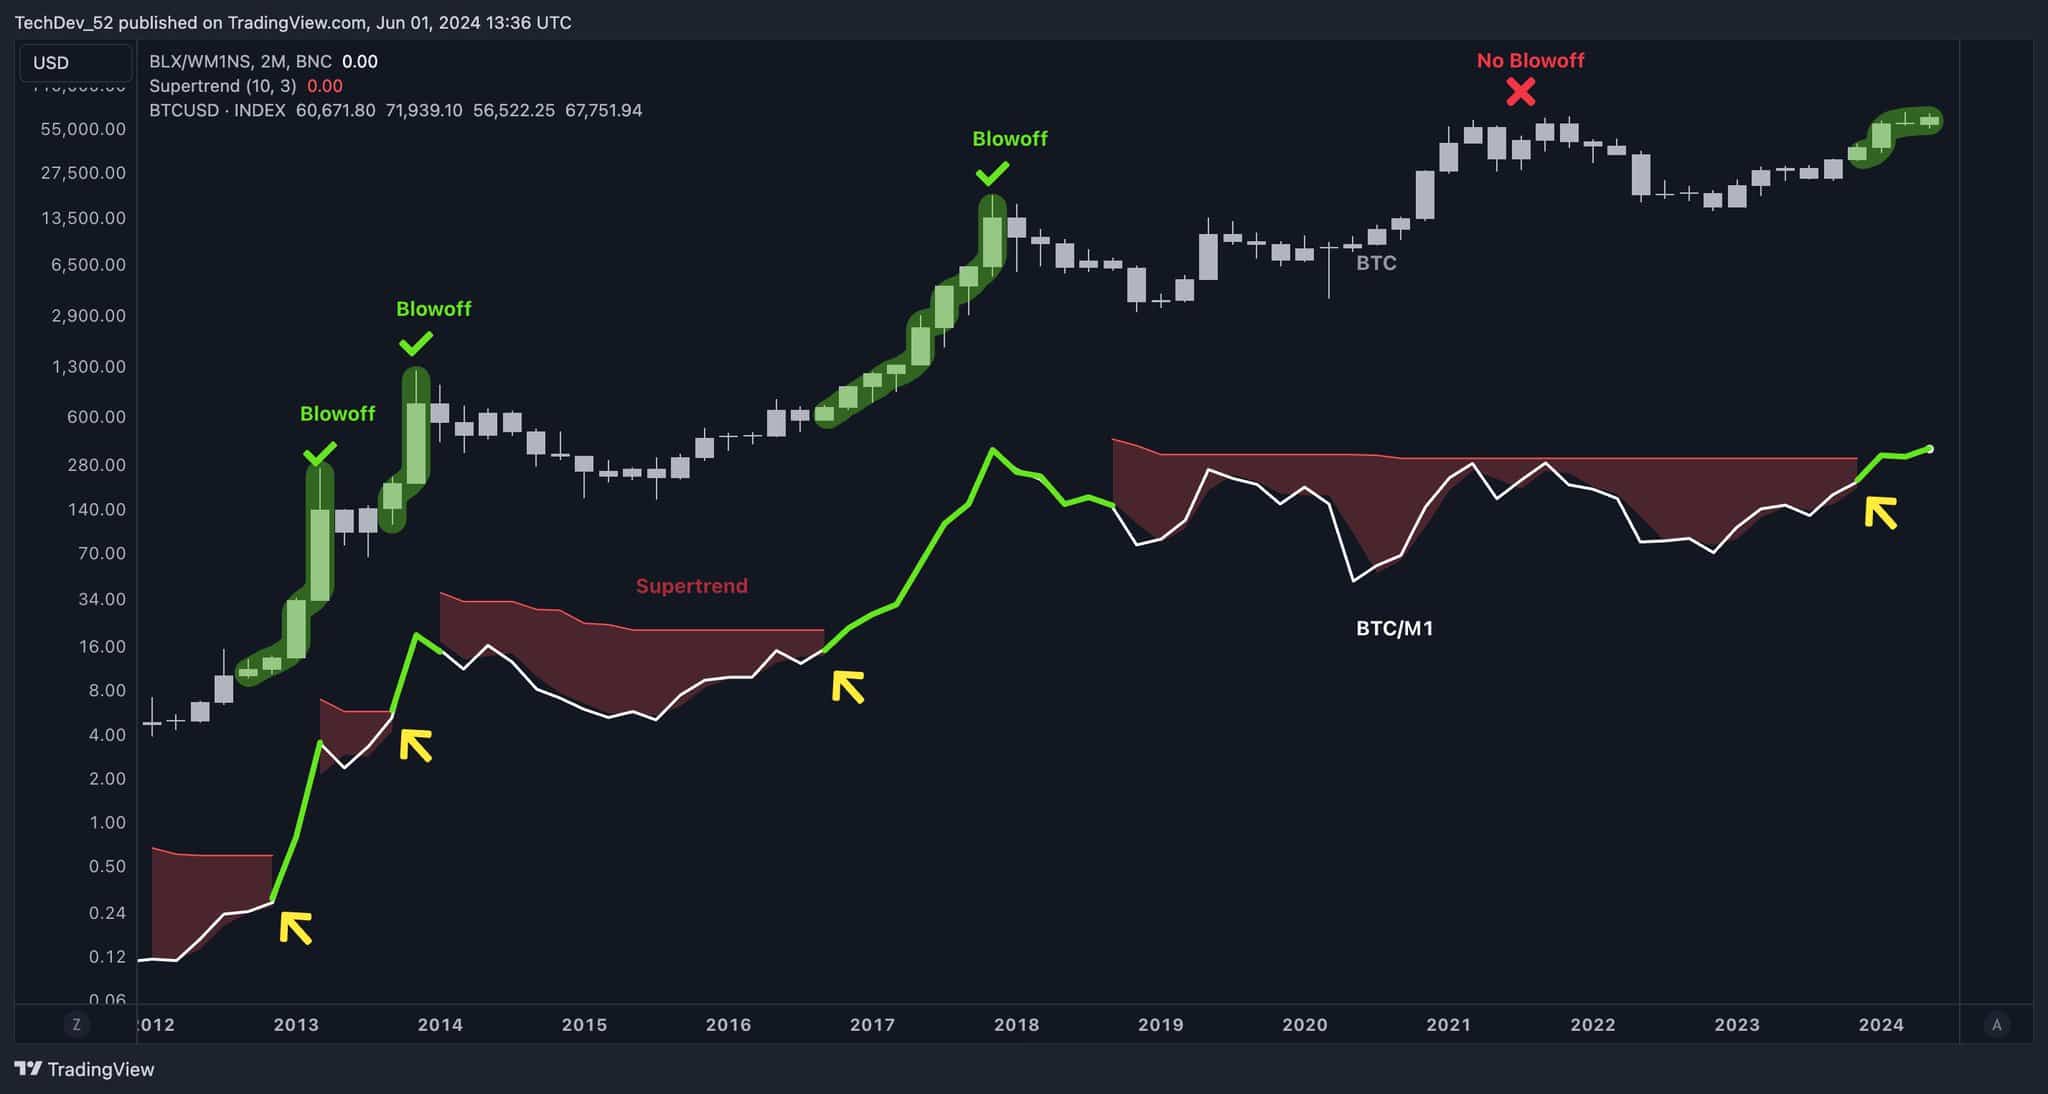
According to X user (formerly Twitter) TechDev_52, an entrepreneur and crypto analyst, BTC could be tipped for a ‘blowoff’ after BTC vs. M1 liquidity hit a record high.
‘$BTC had no business setting new highs in 2021. M1 soared to record heights, but #bitcoin couldn’t set one against it. Now that it’s broken above its 2M supertrend, we’re likely in for that blowoff move it’s always signaled.’
Source: X/TechDev_52
The analyst blamed the ‘COVID panic M1 liquidity’ for the lack of ‘blowoff’ in 2021 when BTC printed a similar breakout against the money supply.
For the unfamiliar, M1 liquidity tracks the most liquid chunk of the money supply. It includes currency and any assets that can swiftly be converted to cash. For M2, the scope goes further to some ‘not so liquid parts’ of the money supply, like savings deposits.
Interestingly, M2 has also expanded by 0.7%, per another analyst, Willy Woo. In previous cycles, the surge in the money supply led to an uptick in BTC’s value in USD terms.
It remains to be seen whether the BTC’s breakout against the M1 liquidity and M2 expansion will push it above the range.
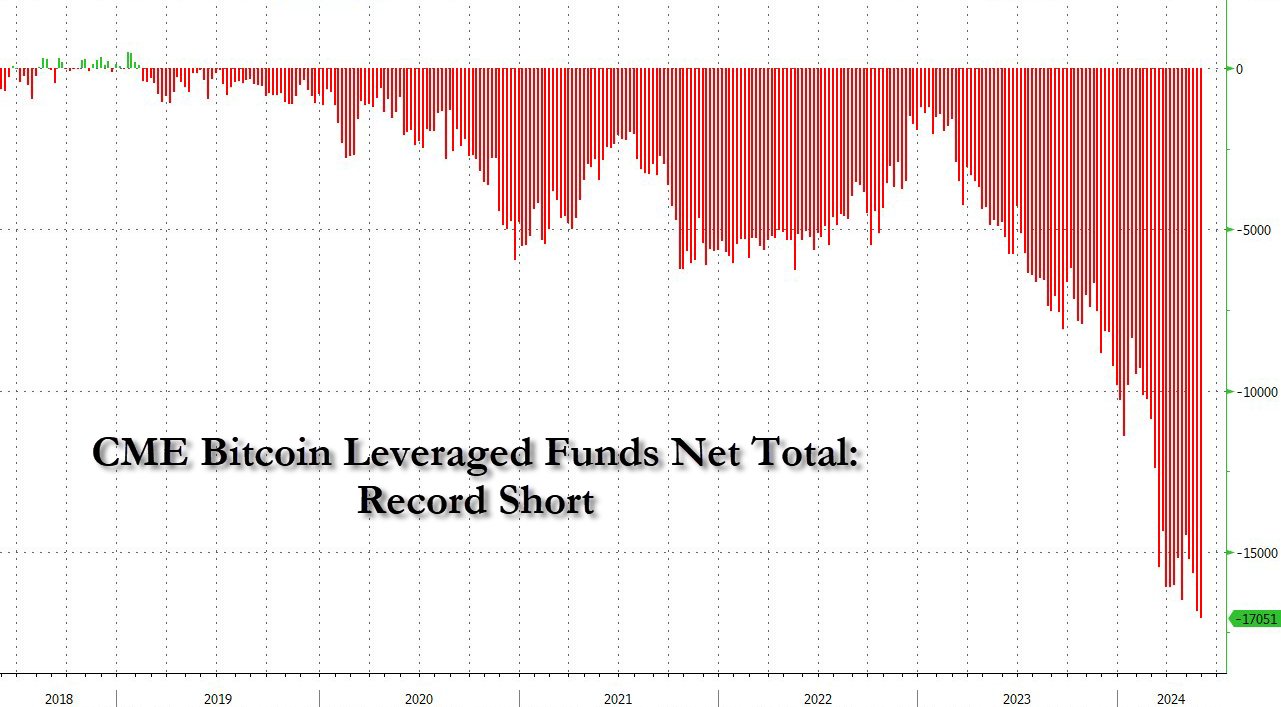
However, recent data showed that leveraged funds hit record BTC short positions. This could be a hedge against any potential drop in BTC or bets on price correction.
Source: X/ZeroHedge
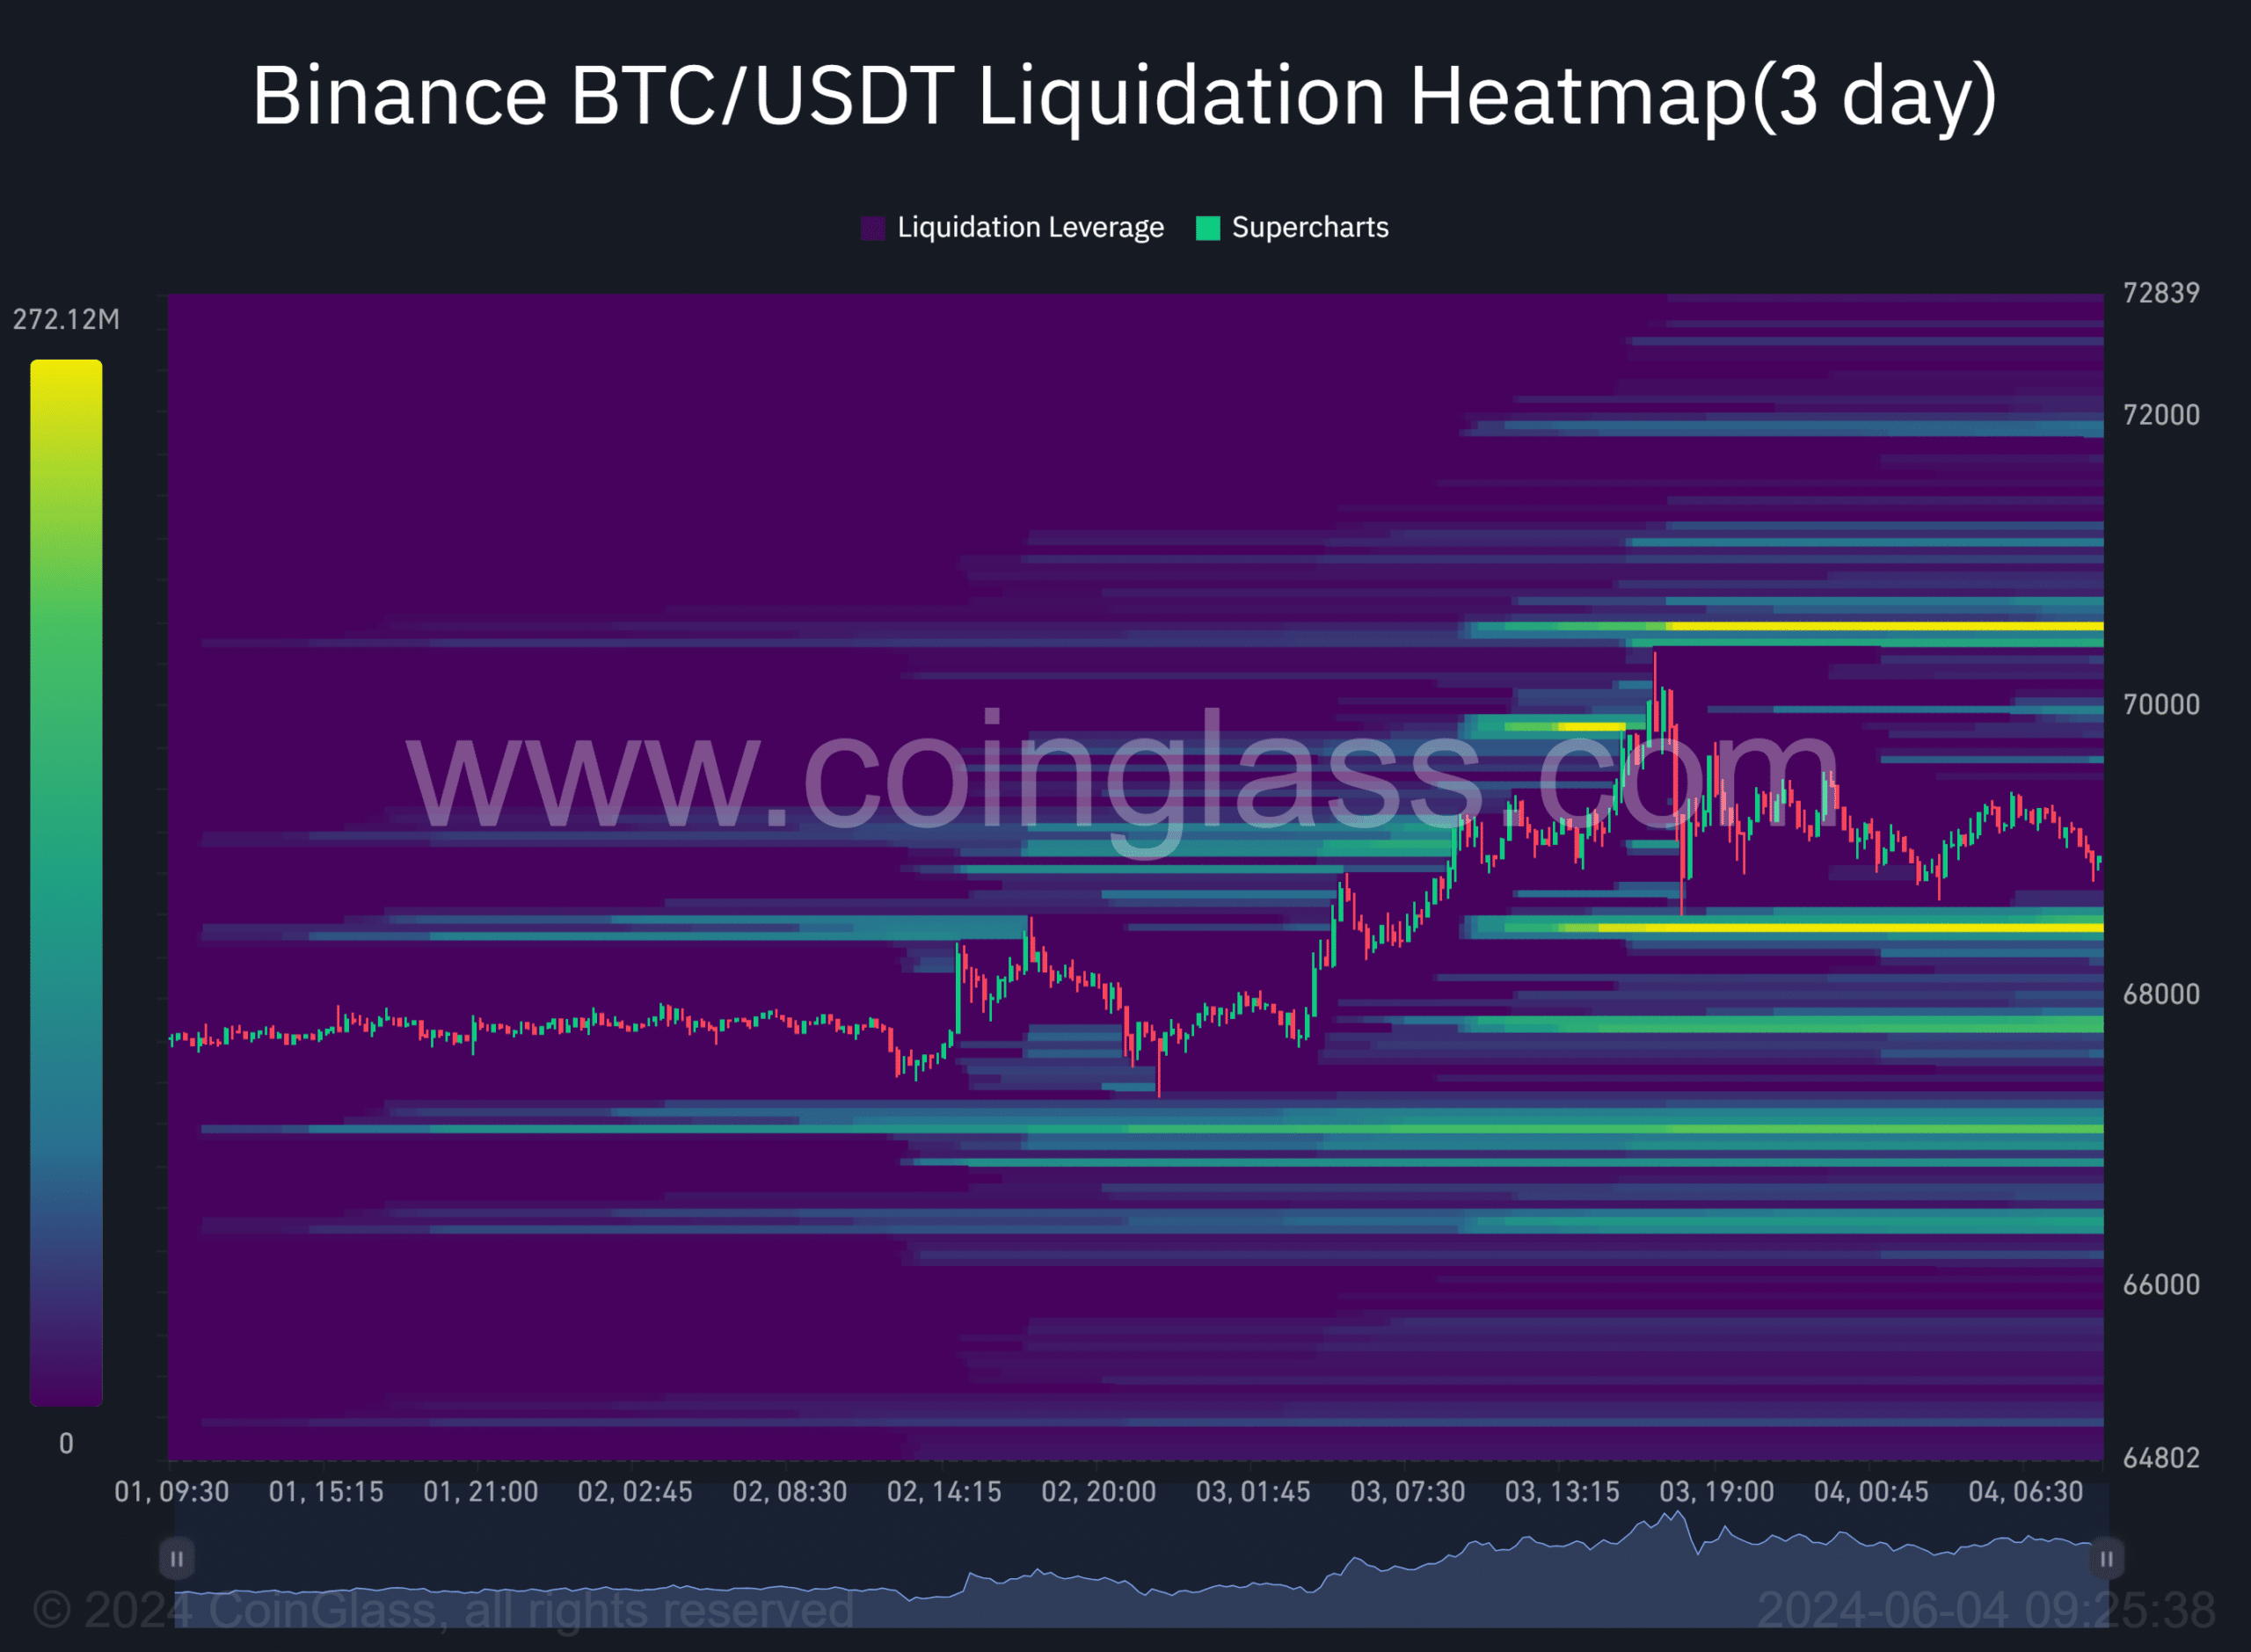
In the meantime, a short-term move towards $70.5K was more likely after sweeping the liquidity at $68.4K.
According to Coinglass data, both levels, marked orange, were key liquidity cluster points that could act as magnets for price action.
Source: Coinglass
- Analysts project a possible BTC rise after a record uptick in US money supply.
- However, short positions against BTC have spiked, raising fears of a price correction.
Bitcoin [BTC] has been in a price consolidation range between $60K and $70K for weeks, a boring set-up for speculators who thrive on volatility.
This sideways movement extended after the April halving event and the seemingly ‘stagnant’ demand from US spot BTC ETFs.
But there’s a new developing narrative for the King coin—an uptick in the US money supply.
Bitcoin’s path forward
According to X user (formerly Twitter) TechDev_52, an entrepreneur and crypto analyst, BTC could be tipped for a ‘blowoff’ after BTC vs. M1 liquidity hit a record high.
‘$BTC had no business setting new highs in 2021. M1 soared to record heights, but #bitcoin couldn’t set one against it. Now that it’s broken above its 2M supertrend, we’re likely in for that blowoff move it’s always signaled.’
Source: X/TechDev_52
The analyst blamed the ‘COVID panic M1 liquidity’ for the lack of ‘blowoff’ in 2021 when BTC printed a similar breakout against the money supply.
For the unfamiliar, M1 liquidity tracks the most liquid chunk of the money supply. It includes currency and any assets that can swiftly be converted to cash. For M2, the scope goes further to some ‘not so liquid parts’ of the money supply, like savings deposits.
Interestingly, M2 has also expanded by 0.7%, per another analyst, Willy Woo. In previous cycles, the surge in the money supply led to an uptick in BTC’s value in USD terms.
It remains to be seen whether the BTC’s breakout against the M1 liquidity and M2 expansion will push it above the range.
However, recent data showed that leveraged funds hit record BTC short positions. This could be a hedge against any potential drop in BTC or bets on price correction.
Source: X/ZeroHedge
In the meantime, a short-term move towards $70.5K was more likely after sweeping the liquidity at $68.4K.
According to Coinglass data, both levels, marked orange, were key liquidity cluster points that could act as magnets for price action.
Source: Coinglass


you are in reality a just right webmaster The site loading velocity is incredible It seems that you are doing any unique trick In addition The contents are masterwork you have performed a wonderful task on this topic
can i get generic clomid without a prescription where to buy clomiphene without prescription can you get clomid without insurance cost of cheap clomid without a prescription where can i buy cheap clomid price can i get generic clomiphene for sale can i buy cheap clomiphene without prescription
This is the stripe of topic I get high on reading.
Howdy would you mind letting me know which web host you’re working with? I’ve loaded your blog in 3 completely different web browsers and I must say this blog loads a lot quicker then most. Can you recommend a good hosting provider at a honest price? Thanks, I appreciate it!
With thanks. Loads of expertise!
zithromax price – buy generic tinidazole buy metronidazole 200mg pills
order rybelsus 14mg sale – buy semaglutide 14mg generic periactin oral
buy generic domperidone over the counter – cheap flexeril 15mg cyclobenzaprine 15mg for sale
how to get inderal without a prescription – order inderal 10mg generic purchase methotrexate pill
purchase amoxil generic – ipratropium uk buy combivent 100mcg without prescription